www.nat-hazards-earth-syst-sci.net/16/1519/2016/ doi:10.5194/nhess-16-1519-2016
© Author(s) 2016. CC Attribution 3.0 License.
The flood of June 2013 in Germany: how much do we know
about its impacts?
Annegret H. Thieken1, Tina Bessel2,6, Sarah Kienzler1, Heidi Kreibich3,6, Meike Müller4, Sebastian Pisi5, and Kai Schröter3,6
1University of Potsdam, Institute of Earth and Environmental Science, Karl-Liebknecht-Strasse 24–25, 14476 Potsdam, Germany
2Karlsruhe Institute of Technology, Institute for Economics (ECON), Waldhornstrasse 27, 76131 Karlsruhe, Germany 3Helmholtz Centre Potsdam, GFZ German Research Centre for Geosciences, Section 5.4 Hydrology, Telegrafenberg, 14473 Potsdam, Germany
4Deutsche Rückversicherung AG, NatCat-Center, Hansaallee 177, 40549 Düsseldorf, Germany
5German Committee for Disaster Reduction (DKKV), UN Campus, Platz der Vereinten Nationen 1, 53113 Bonn, Germany 6CEDIM – Center for Disaster Management and Risk Reduction Technology, Karlsruhe Institute of Technology,
Hermann-von-Helmholtz-Platz 1, 76344 Eggenstein-Leopoldshafen, Germany Correspondence to:Annegret H. Thieken ([email protected])
Received: 25 November 2015 – Published in Nat. Hazards Earth Syst. Sci. Discuss.: 15 January 2016 Revised: 26 May 2016 – Accepted: 30 May 2016 – Published: 1 July 2016
Abstract.In June 2013, widespread flooding and consequent damage and losses occurred in Central Europe, especially in Germany. This paper explores what data are available to investigate the adverse impacts of the event, what kind of information can be retrieved from these data and how well data and information fulfil requirements that were recently proposed for disaster reporting on the European and interna-tional levels. In accordance with the European Floods Direc-tive (2007/60/EC), impacts on human health, economic ac-tivities (and assets), cultural heritage and the environment are described on the national and sub-national scale. Information from governmental reports is complemented by communica-tions on traffic disrupcommunica-tions and surveys of flood-affected res-idents and companies.
Overall, the impacts of the flood event in 2013 were mani-fold. The study reveals that flood-affected residents suffered from a large range of impacts, among which mental health and supply problems were perceived more seriously than fi-nancial losses. The most frequent damage type among af-fected companies was business interruption. This demon-strates that the current scientific focus on direct (financial) damage is insufficient to describe the overall impacts and severity of flood events.
The case further demonstrates that procedures and stan-dards for impact data collection in Germany are widely miss-ing. Present impact data in Germany are fragmentary, hetero-geneous, incomplete and difficult to access. In order to ful-fil, for example, the monitoring and reporting requirements of the Sendai Framework for Disaster Risk Reduction 2015– 2030 that was adopted in March 2015 in Sendai, Japan, more efforts on impact data collection are needed.
1 Introduction
damag-Figure 1.River reaches with flood discharges (Qp) exceeding a 10-year discharge (HQ10) or a 100-year discharge (HQ100), exceedance of highest navigable water level (NavWL) in days at selected gauges (data source: BfG, 2014, p. 152), as well as hot spots of inundation in June 2013 including major dike breach locations; details for(a)Fischbeck,(b)confluence of the rivers Saale and Elbe,(c)Fischerdorf at the confluence of the rivers Isar and Danube as well as(d)the city of Passau (source: Schröter, 2015, based on satellite images of TerraSAR-X and MODIS).
ing event with an overall loss of EUR 11.6 billion (as of July 2005; Thieken et al., 2006a).
The event of 2013 was especially characterised by extraor-dinarily high antecedent moisture. During the second half of May 2013 exceptional rainfall amounts had been witnessed due to a quasi-stationary upper-level trough over central Eu-rope. This circulation pattern triggered a sequence of sur-face lows on its eastern side, a process that was also re-ferred to as repeated Rossby wave breaking (RWB; Grams et al., 2014) and that repeatedly transported warm and humid air from south-eastern Europe to central Europe (Schröter et al., 2015). Notably, continental evapotranspiration was the main moisture source as revealed by Grams et al. (2014). By the end of May, rainfall totalled 178 % of the average monthly amount and record-breaking soil moisture was ob-served in 40 % of the German territory (DWD, 2013). Ac-cordingly, Schröter et al. (2015) also reported high initial streamflow levels in the river network.
First local flooding was caused by a thunderstorm on 18 May 2013 in the southern part of Lower Saxony, where re-newed heavy rainfall and flooding occurred a week later (NL-WKN, 2013). However, the large-scale flooding was mainly
triggered by rainfall between 31 May and 2 June 2013. These rainfall amounts were considerable – especially over moun-tains – but not exceptional (Schröter et al., 2015). However, in combination with the wet soils and above-average ini-tial streamflow levels, high flood peaks resulted in the upper catchments of the rivers Rhine and Weser in the western part of Germany as well as in many parts of the catchments of the rivers Danube in southern Germany and Elbe in eastern Germany.
Flood discharges above a 5-year return period were ob-served in many rivers reaches in Germany between 21 May 2013 and 20 June 2013. Over a length of approximately 1400 km in the river network even 100-year flood discharges were exceeded. Therefore, widespread inundation occurred as depicted in Fig. 1. At several locations, embankments were unable to withstand the floodwater, resulting in dike breaches and inundation of the hinterland. As a result, 12 out of the 16 federal states were affected by the flood, of which 8 declared a state of emergency (see Fig. 2a for a geographic overview).
(Fig. 1a), at the confluence of the rivers Saale and Elbe at Klein Rosenburg-Breitenhagen (Fig. 1b) and in Deggendorf-Fischerdorf at the confluence of the rivers Isar and Danube (Fig. 1c). The city of Passau (Fig. 1d) is commonly known as the “three-river city” since it is located at the confluences of the rivers Danube, Inn and Ilz. Due to its special geographic– topographic situation no flood defence schemes are in place. In 2013, the water level of 12.89 m above gauge zero nearly reached that of a flood event in 1501, which is with 13.20 m above gauge zero the highest water level ever recorded in Passau (BfG, 2013).
While the meteorological and hydrological aspects of the flood event were already published in scientific journals a few months after the flood (e.g. Blöschl et al., 2013; Grams et al., 2014; Merz et al., 2014; Schröter et al., 2015), only a little information is available on the flood impacts. However, the societal significance of natural hazards such as floods only becomes visible through their effects on human society and its assets and activities. Accordingly, the crucial dimension when it comes to the assessment of events is not the flood hazard but the flood risk. In this context, flood hazard is de-fined as the exceedance probability of potentially damaging flood situations and is often assessed by a frequency analysis of the discharges or the water levels at a given point within a specified period, usually a year (Merz and Thieken, 2004). Flood risk statements, in contrast, do include information about the consequences of flood situations, for example di-rect losses or fatalities. Hence, flood risks are dependent not solely on the flood hazard but also on the vulnerability of the affected society. This is determined by the use of the flood-prone areas, i.e. the exposure of human beings, infrastruc-tures and buildings to flooding (also referred to as elements at risk or damage potential), as well as the susceptibility of these elements to inundation. The extent of vulnerability and risk is strongly influenced by the resilience of the affected society or its ability to resist: the better the preventive and protective measures, early warning systems and emergency response have been developed, the less severe the resulting damage will be.
In general, adverse effects of floods are divided into direct and indirect damage (Smith and Ward, 1998). Direct damage, such as fatalities, injured people and damaged or destroyed buildings, is directly caused by a physical contact of the el-ement at risk with the flood water; in contrast, indirect dam-age occurs in space and time outside the actual event. Among these effects are not only traffic and business disruptions but also migration or long-term psychological illnesses.
Accounting for all impacts and costs of a particular event is complicated for many reasons (Downton and Pielke Jr., 2005). To begin with, damage to buildings seems to be mon-etised easily since the goods concerned are traded on the market (Merz et al., 2010). The damage costs can thus be estimated on the basis of the necessary repair works and materials in a first instance. For some applications such as cost–benefit analyses, however, the financial damage that is
based on repair and replacement costs has to be depreciated by the upgrading that the damaged structures underwent dur-ing reconstruction; taxes also have to be excluded (see Merz et al., 2010). A monetary estimate can also be put on dis-ruptions of operations, turnover losses or costs incurred by delivery detours. However, further indirect costs of disasters along production chains are difficult to measure and can often only be assessed by models (Greenberg et al., 2007; Meyer et al., 2013). Moreover, many losses (and benefits) associ-ated with a flood event are intangible and difficult to mone-tise or even to count. Many health effects due to flooding, as well as damage to cultural heritage or the environment, can only be monetised – if at all – through indirect assessments based on, for example, the willingness of the population to pay for measures that avert evacuation or for the restoration of a cultural heritage site or a recreational area (see Meyer et al., 2013, for an overview). Furthermore, even big flood events have direct and indirect benefits, such as donations, relief funds or other (financial) support provided to affected regions, that should be crosschecked with the costs. Finally, flood losses might differ and depend on the spatial and tem-poral scale of the assessment, such as the property (asset), local, regional, national or international scale as defined by De Groeve et al. (2013), as well as on the overall context of the analysis and its underlying monetary assessment.
The true costs of flood events may hence include hidden costs, such as health effects and long-term societal impacts, and hidden benefits caused by e.g. extra compensation pay-ments, which are difficult to identify and quantify (Downton and Pielke Jr., 2005). Due to this complexity, there is cur-rently a clear focus on accounting direct damage costs or pri-mary effects of actual events (Pielke Jr. and Landsea, 1998) by using economic and/or human indicators (IRDR, 2015). While human indicators such as the number of people killed, injured or evacuated can be determined fairly reliable shortly after the event, a reliable estimate of the direct economic or financial costs of an event can often only be made after sev-eral years when all repair works and compensation payments have been completed. Using flood damage data provided by the National Weather Service (NWS) in the USA, Down-ton and Pielke Jr. (2005) demonstrated that reliable loss fig-ures require regular data updates and consistent definitions of the damage components included. Data consistency is, how-ever, difficult to assess when sub-amounts such as damage in different sectors or damage to movable and fixed items are not explicitly recorded (Blong, 2004; Downton et al., 2005). Further potential biases of loss data are outlined by Gall et al. (2009).
standard-ised datasets have been constantly demanded since an accu-rate, comparable and consistent impact database is required for many applications, among others
– to assess the influences of climate, population growth, land use and policies on trends in losses and damage (Downton et al., 2005);
– to improve risk assessment methods by calibrating and validating loss models with real data (De Groeve et al., 2013);
– to identify drivers and root causes of disasters and to deepen our understanding of damaging processes (dis-aster forensic; DKKV, 2012);
– to set priorities between competing demands for na-tional and internana-tional budget allocations (Guha-Sapir and Below, 2002);
– to evaluate policy successes and failures on the basis of trends and spatial patterns of damage;
– to think about new policies (insurance, climate poli-cies);
– to set priorities of research funding; and
– to evaluate contributions of science to real-world out-comes (Downton and Pielke Jr., 2005).
Since damage information is assumed to be collected more systematically and comprehensively for a major flood than for a small event and information is more likely to be shared among different agencies and institutions (Downton and Pielke Jr., 2005), this paper explores what data are cur-rently available to describe the impacts of the flood event of June 2013 and what can be learnt from them about the types and severities of flood impacts in different sectors. Finally, it will be discussed how good current data and information are and what could be done to create better impact data.
Consistent with the European Floods Directive (2007/60/EC) that aims to establish a framework for the assessment and management of flood risks in Europe and to reduce adverse consequences of flooding for human health, economic activities (and assets), cultural heritage and the environment, predominantly data and impacts on these domains are explored in this paper. Further, we mainly concentrate on direct flood impacts on different scales, i.e. from the national down to the property (asset) scale, due to the above-mentioned complexities and problems that are associated with indirect and long-term effects. In the next section, the used data sources are introduced before the actual flood impacts are presented per damage type and scale (if applicable) in Sect. 3. This part of the paper is accompanied by an overall evaluation of the data content and quality in comparison to recently published guidelines on recording disaster losses (Corbane et al., 2015; IRDR,
2015), which will be introduced in each section dealing with a damage category. The paper concludes with an overview of the data requested by the guidelines and those gathered for the flood of 2013, from which recommendations for future event documentation and loss data collection are derived.
2 Data sources
Three main data sources were used for this study: (i) govern-mental reports on the flood in June 2013, (ii) communications of disruptions of road and railway traffic and (iii) computer-aided telephone interviews among flood-affected residents and companies.
2.1 Governmental reports
General information on the flood impacts was collected from official governmental reports on the flood on the fed-eral/national level (e.g. BMF, 2013; BMI, 2013; BfG, 2014; GMLZ, 2014) as well as on the subnational level of the af-fected states (Länder; e.g. Saxon State Chancellery, 2013; Saxony-Anhalt Ministry of the Interior and Sport, 2013). In addition, enquiries on the overall losses detailed per eco-nomic sector and affected municipality were directed at the federal ministries of the Interior and of Finance as well as at the respective ministries of flood-affected states in spring 2014. All ministries responded; most of them referred to the numbers reported in the application of the German federal government to the European Union Solidarity Fund from July 2013 (BMF, 2013). Some states updated their loss es-timates; almost none provided numbers on a finer spatial level. For Saxony, some numbers are documented per ad-ministrative district (Landkreis) by the Saxon State Chan-cellery (2013); Bavaria reported costs for emergency ser-vices on the level of the seven Bavarian administrative re-gions (Regierungsbezirke; StMI, personal communication, June 2014). The most recent numbers were published in an answer to a minor parliamentarian enquiry (Federal Parlia-ment, 2015).
In this paper, these governmental reports were used to re-trieve information on the general human and economic in-dicators proposed by De Groeve et al. (2014), Corbane et al. (2015) and IRDR (2015) on the national and the sub-national level. In addition, the reports provided insight into expenses for emergency services as well as into impacts on cultural heritage and the environment.
2.2 Communications on disruptions of road and railway traffic
2.2.1 Road traffic
In order to capture the impact of the June 2013 flood on road traffic systematically, all communications contained in po-lice traffic reports for the period between 15 May and 31 De-cember 2013 with respect to flooding were filtered out and the retrieved information was saved in a database. An exam-ple of a police traffic report with respect to the flood event reads as follows: “4 June 2013, 11:30 a.m. B96 Hoyerswerda in the direction of Bautzen, between junctions Zeissig and Neu Buchwalde traffic obstructions in both directions due to flooding, traffic obstruction due to flood, both directions of traffic closed, a detour has been instated” (source: Saxon Po-lice, 2013, own translation).
All situations that posed an obstruction to road traffic, such as a closed road on one side or on both sides, narrowing of lanes, obstructions by traffic (e.g. by emergency vehicles) as well as dangers (e.g. an increase in game crossing the road due to the flood), were further considered as traffic obstruc-tion. Repeated identical reports were merged so that they counted as one traffic obstruction. However, should a piece of information in the report change, for example the stated section of the affected road, then the report was captured as a new traffic obstruction. A traffic obstruction was deemed to have ended, as soon as
– information in the report changed so that this could be captured as a new traffic obstruction
– it had been reported that the street was traversable once again or that the danger on the road had passed
– the traffic obstruction did not appear in the police traffic reports any longer.
2.2.2 Railway transportation
The German national railway corporation (Deutsche Bahn AG) provided several internal communication maps, in which the railway segments that were affected by extreme weather conditions or flooding are indicated. The maps cover the time period between 3 June and 1 July 2013 with, however, some days without any information. On other days, especially at the beginning of the flood event, the maps were updated sev-eral times a day. Besides the geographic information, the type of interference, i.e. low-speed routes, platform or route clo-sures, is reported in the maps. Further, the press releases of theDeutsche Bahn AGwere used to retrieve additional infor-mation.
2.3 Computer-aided telephone interviews
To capture more detailed flood effects on the level of individ-ual properties (assets, households), information from flood-affected residents and companies was systematically gath-ered.
2.3.1 Flood-affected residents
Computer-aided telephone interviews (CATI) were con-ducted among households in the flood-affected regions of Germany 9 months after the event. On the basis of informa-tion from affected municipalities, flood reports or mapped flooded areas, street lists were compiled and the telephone numbers of residents potentially affected by the flood were retrieved from the telephone directory. For the survey on the 2013 event, a comprehensive survey was conducted; i.e. all the chosen telephone numbers were contacted. In total, 1652 interviews were completed between 18 February and 24 March 2014 with affected residents. In the survey, the term “affected” was defined as a household that had suf-fered (financial) flood damage in May or June 2013. The spatial distribution of the surveyed households is illustrated in Fig. 2b.
Similarly to former surveys (see Thieken et al., 2005; Kienzler et al., 2015), the main objective was to investigate how financial flood losses are influenced by other factors, for example flood characteristics or private mitigation. How-ever, after the June 2013 flood, some questions were posed regarding flood effects on health and wellbeing as well as on the assessment of the (governmental) aid for reconstruction. Overall, the questionnaire addressed the following topics (in the order of appearance):
– hydraulic characteristics of the flood at or in the build-ing;
– early warning and emergency measures; – contamination of the floodwater; – evacuation;
– clean-up work and recovery;
– adverse flood effects, including effects on health and wellbeing, and perceived severity;
– physical and financial flood damage to the building and the household contents;
– building ownership and further information on the resi-dential building (or the rented apartment);
– previously experienced flood and flood awareness; – long-term preventive and protective measures
under-taken by the affected household and motivation (not) to do so;
– aid and financial compensation; – socio-demographic information.
Figure 2.Geographic overview of affected federal states and districts that declared a state of emergency(a)as well as the number of surveyed households and companies(b).
The above-mentioned former surveys that were conducted a few months after the floods in 2002, 2005 and 2006 (see Kienzler et al., 2015) were complemented by a follow-up household survey in autumn 2012 (n=910 households), i.e. 10 years after the flood in 2002. The survey focused on long-term (health) effects of the flood as well as property-level mitigation measures. These data are used in Sect. 3.1.2 to illustrate short- and long-term flood effects on affected resi-dents.
2.3.2 Flood-affected companies
Companies that had been affected by the flood in June 2013 were surveyed with regard to the losses incurred and the circumstances influencing the type and amount of damage before, during and after the event. For the sampling pro-cedure, street lists were compiled on the basis of informa-tion obtained from municipalities, flood reports or mapped inundation areas and were further used to determine the telephone numbers of companies potentially affected by the flood. Some large-sized companies were searched addition-ally from flood reports to include them in the random sam-pling as well.
Affected companies were surveyed from May to mid-July 2014. Again, the term “affected” was defined as an en-terprise that had suffered (financial) flood damage. The in-formation was gathered through CATI with the individual in the company who was most knowledgeable about the flood.
In total, 557 interviews were completed. The spatial distri-bution of the surveyed companies is illustrated in Fig. 2b. The interviews lasted 15–35 min on average; the question-naire covered approx. 90 questions on the following topics (in the order of appearance):
– company description (sector, size, number of buildings, assets, perceived vulnerability with regard to flooding, etc.);
– hydraulic characteristics of the flood on the company grounds;
– early warning and emergency measures; – contamination and clean-up work;
– (financial) flood damage (to buildings, operational facil-ities, merchandise, products and warehouse inventory, motor vehicle inventory; due to interruptions of opera-tions);
– reconstruction, compensation, plans to relocate; – previously experienced floods;
– long-term preventive and protective measures at the property level.
3 Impacts of the flood in June 2013 3.1 Flood impacts on human health
The effects of flooding on health can be significant and may concern both physical and mental health. Physical health ef-fects are deaths due to drowning, electrocution, heart attacks, vehicle-related accidents, etc. as well as injuries, illnesses and infections that require medical assistance and result di-rectly from the flood, for example due to a lack of sanitation, contaminated water, chemical hazards or mildew (within wet or insufficiently reconstructed buildings; IRDR, 2015). Men-tal health effects might be acute or long-term due to a loss of family members or friends, displacement, destruction of homes, delayed recovery and water shortages (Menne and Murray, 2013). Recurrent flash backs, nightmares, sleepless-ness (insomnia), angst, panic and depression are some exam-ples for mental health effects and might even lead to post-traumatic stress disorder (PTSD). Limited access to health facilities during and after a flood event, in particular medical treatment and nursing of flood-affected or evacuated people suffering from chronical diseases, is a further issue related to this domain (Menne and Murray, 2013), but this is usually reported as part of the physical and economic damage (see Sect. 3.2).
Human indicators in disaster loss databases are commonly related to physical health or the displacement and move-ments of people caused by the flooding; mental health ef-fects are usually not explicitly reported. For example, IRDR (2015) proposes the numbers of dead, missing, injured and exposed people as primary human impact indicators, while the numbers of homeless, evacuated, relocated and affected people are regarded as secondary. Some indicators, e.g. dead and missed people, are mutual exclusive, others, e.g. home-less, evacuated and relocated people, are not since they cor-respond to consecutive management phases of a damaging event (IRDR, 2015).
In the European guidelines for recording disaster losses (Corbane et al., 2015), the number of deaths, missing peo-ple, as well as directly affected people are recommended as the minimum information that should be recorded with re-gard to human losses. All information should be provided on the NUTS levels 2 or 3 (NUTS stands for Nomencla-ture of Territorial Units for Statistics). In Germany, NUTS 2 mainly correspond to the 38 (former) administrative regions (Regierungsbezirke), while NUTS 3 comprise the 402 urban and rural administrative districts (kreisfreie Städte und Land-kreise). Since almost no information was provided for ad-ministrative levels below the federal states, an overview of human loss indicators (see Table 1) can currently be provided for this level (NUTS 1) only.
3.1.1 Overview of human loss indicators for the flood of June 2013
Table 1 illustrates that 14 people lost their lives in the June 2013 flood. Five fatalities occurred in Saxony-Anhalt (Saxony-Anhalt Ministry for the Interior and Sport, 2013), three in Baden-Württemberg (Die Welt, 2013), two to Bavaria (BMF, 2013) and one in Saxony (BMF, 2013). In fact, in the application of the German Government to the Eu-ropean Union Solidarity Fund, only eight (immediate) fatal-ities were reported. This number was later corrected to 14 (GMLZ, 2014). In addition, 128 people were injured and ap-proximately 80 630 were evacuated in eight different federal states (GMLZ, 2014). In general, 600 000 people in 1800 mu-nicipalities were affected by the flood (BMF, 2013; Table 1). However, the term “affected” is not clearly defined nor is its relation to the categories “injured” and “evacuated” in terms of ex-/inclusiveness. Due to this ambiguity, IRDR (2015) rec-ommends using exposed people, defined as the number of people who permanently or temporarily reside in the hazard area before or during the event, in a first instance, as this number can be more reliably determined from census data and geographic information on the flooded area. In princi-ple, the disaggregated population density is mapped for all of Germany (Thieken et al., 2006b) and could be used to de-termine the number of exposed people. However, the inun-dated areas depicted in Fig. 1 were derived from satellite im-ages that mainly contain inundated areas along the big rivers. Smaller inundated areas, especially at the beginning of the event, are not captured by these images. Therefore, the num-ber of people exposed to the June 2013 flood has not been determined.
As a further human-related indicator, the number of helpers in emergency services and relief or aid organisations in Germany totalling more than 1 million was often reported in governmental reports on the June 2013 flood. Hence, this information was added to Table 1, although this indicator is not considered in any guideline for disaster documentation. This number does not include volunteers who helped to cope with the flood (damage) without being organised in an emer-gency service or an aid or relief organisation. With regard to the 2013 flood, the numbers illustrate that the magnitude of responders and helpers is similar to the amount of people directly affected by this widespread flood event.
Table 1.Overview of human loss indicators as recommended by Corbane et al. (2015) or IRDR (2015), accessible for the flood in June 2013 per federal state (data sources: BMF (2013) including annexes; GMLZ (2014) without annexes; ND: no data reported).
Federal state Number of people Number of helpers Died Missed Injured Affected Evacuated
Baden-Württemberg 3 human damage is ND at least 200 18 394 mentioned but not
specified by numbers
Bavaria 2 0 9 80 000 13 600 40 000
Brandenburg ND ND ND 25 000 3500 ND
Hamburg ND ND ND ND ND ND
Hesse ND ND ND ND ND ND
Mecklenburg-Western Pomerania ND ND ND ND ND ND
Lower Saxony ND ND ND ND ND ND
Rhineland-Palatinate ND ND ND ND ND ND Saxony 1 ND 21 ND 33 700 (8270–16 000 per day) 76 161 Saxony-Anhalt 5 ND ND ND 88 000 >120 000
Schleswig-Holstein ND ND ND ND ND 660
Thuringia ND ND ND ND ND ND
Overall 14 ND 128 600 000 80 630 871 000 regional and 217 000 federal helpers (in person days)
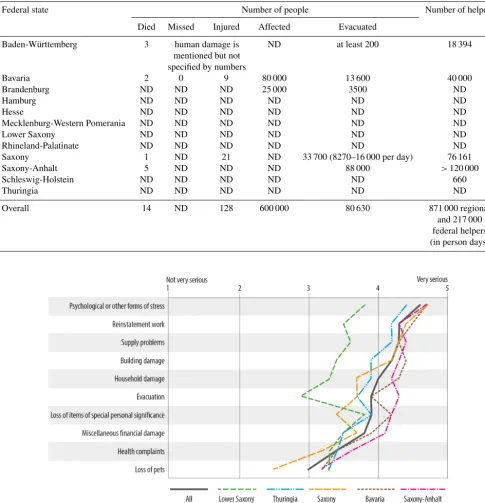
Figure 3.Average perception of the severity of flood impacts witnessed by flood-affected residents and assessed on a scale of 1 (impact was not very serious) to 6 (impact was very serious).
3.1.2 Flood impacts on affected residents and perceived severity
To obtain more insights into the variety and severity of flood impacts on affected residents, the surveyed households (see
seri-ous). The perceptions of all respondents to a particular dam-age type resulted in averdam-age assessments between 3.0 and 4.6 (Fig. 3). The damage types that were assessed on average with 4.0 or worse – and were thus evaluated as serious – in-cluded psychological stress or other stresses, reinstatement works (e.g. cleaning or repairs), supply problems (e.g. no electricity, water), as well as damage to buildings and house-hold contents (Fig. 3). This highlights that mental health is-sues and disruption of daily life are of great importance for affected people.
Figure 3 further highlights that the perception of residents from Bavaria and Saxony-Anhalt is above average: six or seven types of flood impacts were on average assessed by 4.0 or worse. In contrast, residents from Thuringia and Lower Saxony perceived most impacts as less severe. In Thuringia, only averages for three types of impact (psychological stress or other stresses, reinstatement works and supply problems) exceeded 4.0. In Lower Saxony, there was no impact that was perceived that seriously (Fig. 3). This pattern reflects the hy-drological severity of the flood as depicted in Fig. 1.
Figure 3 further elucidates that the flood situation had a great impact not only on the mental health of the affected per-sons but also – to a lesser degree – on their physical health. To shed some light on the underlying medical conditions, all re-spondents who had reported mental or physical health effects (84.4 %) were surveyed in more detail. In an open question regarding the type of stress undergone and grievances in de-tail, uncertainty about the future, worries with regard to fam-ily, existence and subsistence, and the future, fears of loss, panic, trauma, shock, crying fits or nervous breakdowns were cited most frequently. In addition to these, sleep disorders or nightmares were mentioned, as well as feeling restless, tense and nervous or agitated.
Physical symptoms manifested themselves most fre-quently in the form of states of exhaustion or lack of sleep; joint, bone or muscle complaints; nervous system com-plaints; infections, inflammation, (skin) irritations or the ex-acerbation of pre-existing illnesses or conditions. It is note-worthy that the flood situation aggravated people’s chronic illnesses or conditions.
Psychological stress is, however, not limited to the period of the actual flood event but can still remain a long time af-terwards. The above-mentioned surveyed group of affected persons with health impairments was therefore additionally asked about the extent to which they were still stressed by the flood event at the time of the interview (answer scale from 1,“I am not stressed by it any longer/I feel like I did before the event”, to 6,“I am still very stressed by it”). Slightly more than a third of the respondents (35 %) were still very or ex-tremely stressed as a result of the flood as much as 9 months after the event (answers 5 and 6); in contrast, a further third hardly felt stressed any longer or not at all (answers 1 and 2). However, the 2013 flood was still very prevalent in the minds of all the residents affected. This is clearly evident from the results to the question: “how often have you thought
Figure 4.Frequency of flood memories of affected residences in the 6 months preceding the survey (information is given in percentages of respondents; the first two categories of answers – (several times) daily – were not provided to the respondents in autumn 2012).
about the June 2013 flood over the past 6 months?” At the time of the survey, i.e. approximately 9 months after the event, 35 % of all the affected persons still thought about the 2013 flood once or several times a day and 50 % still at least once a month to several times a week (Fig. 4). This distribu-tion of answers clearly differs from the answers of affected persons who were asked the same question in autumn 2012, i.e. 10 years after having witnessed the severe flood of Au-gust 2002 (Fig. 4). On the one hand, the comparison illus-trates the extent to which a flood can change daily life and thinking; on the other hand, the long-term and ongoing im-pression that an extreme flood can leave behind is evidenced: 10 years after the event of August 2002, only 20 % of re-spondents stated that they never thought of the event in the 6 months preceding the interview. On the contrary, 8 % still thought of it approximately daily. However, it is worth noting that thoughts about the flood were not negative throughout: the experience of solidarity and a sense of community were often positively highlighted.
affected by flooding in 2013 for the first time. In addition, households that already suffered flood damage several times thought considerably more often about resettlement, which might have severe consequences for flood-prone communi-ties that do not get flood protection (Kuhlicke et al., 2014).
In conclusion, the survey among flood-affected residents highlights the importance of physical and particularly mental health issues caused by flooding. This is contrasted by the little attention this domain received in official governmental flood documentations and reports in Germany.
3.2 Overview of impacts on economic activities (and assets) on the regional and national scale
In industrialised countries, economic or financial losses caused by natural hazards are a major concern and achieve a lot of attention during and after disastrous events. Quick and reliable loss estimates are requested by the (re-)insurance industry as well as by governmental institutions. However, data on economic or financial losses are fairly uncertain (Merz et al., 2004; Downton and Pielke Jr., 2005; Down-ton et al., 2005). To assess impacts of natural hazards on the economic activities according to the European guidance for recording disaster losses (Corbane et al., 2015), indicators describing the physical number of damaged items should be distinguished from indicators that quantify financial losses (costs). As a minimum requirement, it is proposed that phys-ical damage indicators should deliver information on the number of damaged or destroyed houses, educational centres (e.g. schools, kindergartens) and health facilities (e.g. hos-pitals). Optionally, further aggregated damage indicators can be provided, i.e. on the total area of destroyed or affected crops and woods (in hectares), the number of lost four-legged livestock, the number of damaged or destroyed governmen-tal and administrative buildings, the number of damaged or destroyed industrial and commercial facilities as well as the length of damaged or destroyed roads and railways (in kilo-metres) and the number of damaged or destroyed transporta-tion infrastructure such as bridges, airports and marine ports (Corbane et al., 2015). These physical damage indicators are further translated into economic monetary indicators, in par-ticular into the overall direct tangible loss, i.e. the mone-tary value of the physical damage to capital assets. This loss should ideally be disaggregated over all sectors or loss own-ers and accompanied by information on the loss bearer. Ex-penditures for emergency services and clean-up are further costs to be recorded optionally (Corbane et al., 2015).
As a minimum requirement the overall direct damage should be reported on NUTS levels 2 or 3 (see Sect. 3.1). As outlined above, almost no information was provided for administrative levels below the state level (NUTS 1). There-fore, the overview of damage and losses can currently be pro-vided for NUTS 1 only. Table 2 summarises the information that was collected for the flood of June 2013 on the minimum
indicators on direct damage and economic loss as proposed by Corbane et al. (2015).
3.2.1 Overview of financial losses
Table 2 illustrates that data on the physical damage indi-cators are so fragmentary that they do not allow a sound interpretation. Only from the Saxon report (Annex 14 in BMF, 2013; Saxon State Chancellery, 2013) could informa-tion for all minimum indicators recommended by Corbane et al. (2015) be retrieved. Therefore, the overall (direct) finan-cial loss given in Table 2 is further used as main indicator for the economic impact.
Table 2.Damage and loss indicators as recommended by Corbane et al. (2015) and IRDR (2015) available for the flood of June 2013 in Germany per federal state (data sources: BMF, 2013; Saxon State Chancellery, 2013; Brandenburg, personal communication, May 2014; Federal Parliament, 2015; ND: no data reported; n/a: not applicable).
Federal state Number of damaged or destroyed Overall financial loss
Houses Educational centres Health facilities Reported in Funds claimed by
(e.g. schools, (e.g. hospitals) BMF (2013) 30 June 2015
kindergartens) (million EUR) (Federal Parliament, 2015)
(million EUR)
Baden-Württemberg 3697 129 ND 74 59
Bavaria 13 000 ND ND 1308 760
Brandenburg 1100 ND ND 92 81
Hamburg 0 0 0 1 0
Hesse ND ND ND 21 6
Mecklenburg-Western Pomerania 0 ND ND 8 6
Lower Saxony ND ND ND 64 41
Rhineland-Palatinate 0 ND ND 4 6
Saxony 13 000 widespread disruption, no disruptions 1923 1171
no numbers reported in hospitals
Saxony-Anhalt ND ND ND 2699 1496
Schleswig-Holstein ND ND ND 25 14
Thuringia ND ND one hospital 452 187
(power failure)
Federal government n/a n/a n/a 1484 114
Emergency response 71
Insured loss 1650
Total >32 000 disruption mentioned, ND 8154 5664
no numbers reported
(Federal Parliament, 2015). Only thereafter will it be possi-ble to compile a conclusive loss statement.
Nevertheless, it is already possible to look at the spatial and sector-wise distribution of losses. Table 2 reveals that Saxony-Anhalt, Saxony and Bavaria are the three most af-fected federal states in terms of financial losses, each cov-ering about 20 % to more than 30 % of the overall loss. For the flood of 2013, approximately 22 % of all losses incurred in private households, 19 % in the industrial and commer-cial sector, 7 % in agricultural and forestry and almost 50 % in governmental domains (infrastructure and emergency ser-vices; BMF, 2013). This distribution can, however, consid-erably vary between federal states as is illustrated in Fig. 5, taking Bavaria and Saxony as examples. While in Bavaria two-thirds of the losses are allocated to private households as well as the commercial and industrial sectors, losses to the state and municipal infrastructure amount to around 60 % in Saxony (Fig. 5). This can be divided into 20 % state infras-tructure and 40 % municipal infrasinfras-tructure. With respect to state infrastructure, the biggest damage can be attributed to surface water bodies and flood defence systems belonging to Water Body Category I. In regard to municipal infrastruc-ture, the largest share of the damage is allocated to streets and bridges, as well as to flood defence systems belonging to Wa-ter Body Category II (Saxon State Chancellery, 2013). More
Figure 5.Distribution of the overall direct losses of the flood event in June 2013 according to loss-incurring sectors in the federal states of Bavaria (EUR 1.3 billion) and Saxony (EUR 1.9 billion), accord-ing to the Federal Ministry of Finance (BMF, 2013).
details about the type of the damaged infrastructure were un-fortunately not available for Bavaria. So the reason for the differences is still unclear. In addition the sector-wise loss distributions are based on the first loss estimates of the fed-eral states and have not been updated. Further investigations could be carried out when the final losses and their allocation are recorded.
statements of the federal government and the federal states. To some extent, losses to cultural facilities, sport and recre-ational centres, churches and research institutions are also provided. Unfortunately not all the sectors are systematically dealt with in every flood event and state, and the definitions (which damage should be reported in which category) are not managed uniformly over space and time. This can be another reason for the differences in the loss allocations reported by Saxony and Bavaria (see Fig. 5). Moreover, in the case of changes to the overall loss estimates, the distribution among the sectors is often not updated. This considerably hinders a comparison of the overall financial or economic losses of different flood events and in different federal states (Thieken et al., 2010).
Of all losses, the insurance industry in Germany has covered around EUR 1.65 billion (GDV, 2015). With EUR 900 million, the most insured damages occurred in the Free State of Saxony, followed by Saxony-Anhalt (EUR 310 million), Bavaria (EUR 270 million) and Thuringia (EUR 140 million; GDV, 2014). 142 major claims – this equals individual claims exceeding EUR 500 000 – were re-ported to the Association of the German Insurance Indus-try (GDV) with an overall damage total of EUR 257 million (GDV, 2015).
In addition, the federal government and all federal states launched flood relief funds containing a total amount of EUR 8 billion. The parties agreed that losses of private households can be compensated up to 80 %, whereas re-pair costs for damaged state and municipal infrastructure can be covered up to 100 %. Further, private donations of EUR 108 million have been available (BMF, 2013). Algether, the funds available for reconstruction excel the to-tal damage. Therefore, more reliable methods for first and immediate damage estimates are required. In order to eval-uate the reasonability of first loss estimates reported by the federal states to the federal government, not only should the estimation methods applied be documented but the numbers of physically damaged (or destroyed) items should also be reported by default as proposed by Corbane et al. (2015). For a first economic loss estimate, the number of damaged or destroyed items could be combined with standard repair costs per item. Further, damage indicators should be clearly defined and agreed upon so that the loss documentation of different states and events can be better compared.
3.2.2 Expenses for disaster response and emergency services
With the 2013 flood situation, distinctive needs arose for disaster response and appropriate support by personnel and technical resources in the affected federal states. While Baden-Württemberg and Bavaria managed the flood situation predominantly with their own teams and resources, as well as via bilateral cooperation, states like Saxony, Thuringia and Saxony-Anhalt used the coordination service offered by
the German Federal Joint Information and Situation Centre (GMLZ). Further support was provided by federal states that were not affected by the flood and, in addition, the worst af-fected states mutually supported each other (BMI, 2013).
The assistance requests of individual federal states had al-ready been brought to the attention of the GMLZ on 2 June 2013. In total, the GMLZ processed 43 assistance requests from five affected states. Subsequently, around 5.15 million sandbags, 5700 emergency rescue personnel and transport services for 1000 t of material were arranged in the course of the flood situation by 15 June 2013 (GMLZ, 2014). Mate-rial shortages occurred in the number of available sandbags. To meet the demand of the affected areas, the GMLZ ar-ranged for 5 million sandbags from other federal states and Germany’s European neighbours (BMI, 2013).
In total, 1.7 million voluntary workers are organised in (volunteer) fire brigades, relief and aid organisations, as well as the German Agency for Technical Relief (THW). They form the cornerstone of Germany’s disaster response. By 5 July 2013, the deployment of local fire brigades and aid or-ganisations added up to around 871 000 person days (GMLZ, 2014; Table 1). Additionally, the federal government sup-ported affected municipalities and states with its own re-sources. In the process, the Ministry of the Interior (BMI) coordinated the support staff of the federal police and the THW, while the Ministry of Defence coordinated the fed-eral armed forces staff. From the outset of deployment, the federal government provided help in the form of around 216 000 person days (GMLZ, 2014; Table 1). Through this, the federal government incurred additional costs to the tune of EUR 59.9 million (BMF, 2013).
In general, the costs for emergency services and response are included in the overall loss estimates shown in Ta-ble 2. Three federal states explicitly reported their response costs, which amount to EUR 8.89 million in Bavaria (by 25 June 2014), EUR 1.70 million in Schleswig-Holstein and EUR 0.99 million in Thuringia. Related to the total amount of the other direct damages as of July 2015, the response costs of these federal states amount to 1.2, 12.1 and 0.5 % of the direct damage respectively, which differs consider-ably from the 2 % of the direct damage that is often used to estimate response costs ex-ante (see Penning-Rowsell and Wilson, 2006; Pfurtscheller and Thieken, 2013). Since pub-licly accessible data in this domain are scarce despite well-established costing and reporting procedures, it is recom-mended to explicitly report costs for emergency services and disaster response in loss documentations.
transportation of goods and people. Therefore, traffic dis-ruptions during the flood in June 2013 are analysed in this section although, in the guidelines on loss documentation (Corbane et al., 2015), damage to the transportation sys-tem is only considered in terms of physical damage (see Sect. 3.2). Traffic disruption includes complete interruption of operations due to route closures as well as restrictions to normal operations on damaged routes; for example on dual track/carriage routes only one track/lane is usable, low-speed routes or diverted routes are implemented, or the transporta-tion system is replaced by another mode of transport (e.g. railways are replaced by buses).
In the longer term, disruption of a particular mode of trans-port might lead to a loss of customers or a decline in customer satisfaction, for example with railway services. Such effects of flood events are, however, difficult to separate from other influencing factors. Therefore, the analysis focusses on traf-fic disruptions and interferences.
3.3.1 Disruption of navigation
If rivers are used as waterways, river reaches will be closed for navigation when a specified water level, i.e. the highest navigable water level (NavWL), is exceeded at the respective reference gauge. As depicted in Fig. 1, such water levels were observed in June 2013 at several gauges on different federal waterways and lasted for 15 consecutive days at maximum. The internationally important waterway at the Lower Rhine was, however, not affected by this flood (BfG, 2014).
Disruption of the shipping traffic might last longer than the durations given in Fig. 1, since the Federal Waterways and Shipping Administration first has to screen for new obstacles in the navigation channels before these can be regularly nav-igated again.
So far, no monetary assessments of the disruption of wa-terways have been undertaken (BfG, 2014). Related costs are therefore not included in the figures of Table 2.
3.3.2 Disruption of road traffic
The flood event of 2013 led to flooding, dangerous situations and closures of streets in city centres, closures of regional roads and even of a federal motorway (Autobahn). In total, 700 km of roads and 150 bridges were damaged in Germany (BMF, 2013). These impacts resulted in interferences of road traffic across almost all of Germany.
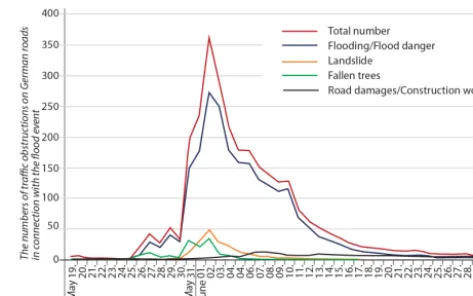
The chronological sequence of traffic obstructions on Ger-man roads is illustrated in Fig. 6 and reflects the general de-velopment of the flood as described by Schröter (2015; see also Sect. 1). Isolated reports of flood-related traffic obstruc-tions emerged as early as 19 May 2013. As of 26 May, the flooding of the rivers Weser and Leine, particularly in the administrative districts of Braunschweig and in the Hanover region in Lower Saxony, was the presumed reason behind road closures. As of 31 May, numerous traffic obstructions
Figure 6.Chronological sequence of the number of traffic obstruc-tions on German roads related to the flood event in the period from 19 May to 1 July 2013, subdivided into causes and as a total number.
occurred in almost all of the federal states, especially in the most affected, i.e. Bavaria, Saxony and Saxony-Anhalt. On 2 June 2013, traffic obstructions had reached a maximum nationwide (Fig. 6). Due to the flood developing over sev-eral days, it was only as of 6 June 2013 that traffic obstruc-tions from the flood occurred at the lower reaches of the Elbe River.
More than 75 % of reported traffic obstructions can be traced back to the actual flooding of streets or to flood danger (Fig. 6). In addition to these, landslides especially in Baden-Württemberg (Keller and Atzl, 2014) together with numer-ous uprooted trees contributed to approximately 20 % of ob-structions in road traffic. In more than 60 % of the events, the roads had to be closed completely in both directions. Of the traffic obstructions, 10 % occurred in city centres and on other urban roads. The federal trans-regional road network was affected by more than 50 % of the traffic obstructions.
Figure 7 illustrates the spatial distribution and duration of the traffic obstructions on an administrative district level. With traffic obstructions lasting more than 14 500 hours in total, traffic in Saxony was the most curtailed. The Saxon administrative districts of Meissen and Leipzig, the city of Dresden, Saxon Switzerland East Ore Mountain district and central Saxony were equally affected by a very high inci-dence of traffic obstructions, as was the Hanover administra-tive region in Lower Saxony. However, it took only days to remove most of these after the flood had been cleared. In the administrative districts of Traunstein (Bavaria) and Tübingen (Baden-Württemberg) extensive construction work to dam-aged roads had to be conducted, which to some extent still affected regional traffic months afterwards.
Figure 7.Overall duration of the obstructions in road traffic induced by the flood event shown in terms of administrative districts.
3.3.3 Disruption of railway operations
One company that has been considerably affected by the flood event of 2013 is theDeutsche Bahn AG. In June 2013, mudslides as well as the submergence or under-washing of tracks led to a variety of interferences of the normal rail traf-fic (Fig. 8). Thus the morning of 3 June 2013 saw 60 route closures and interferences, of which approximately 25 were in Bavaria and approximately 30 in Thuringia and Saxony. In the afternoon, further restrictions were reported on up to 15 routes. These could be lifted to some extent in the sub-sequent days. From 8 June 2013, when the flood attained the middle reaches of the Elbe, this number increased to 17 routes.
In the medium term, primarily long-distance traffic had to bear the brunt of the flood after the dyke breach at Fis-chbeck on 10 June 2013 (Fig. 1a) resulted in the flooding of an approximately 5 km long stretch at the town of Stendal. This meant that the high-speed rail line between Berlin and Hanover had to be interrupted until 4 November 2013, i.e. for almost 5 months (Deutsche Bahn, 2013). For this reason, important connections between Berlin and the Ruhr district, Cologne and Bonn, as well as between Berlin and Frank-furt (am Main) were affected. A replacement timetable with diversions was deployed but led to travel time extensions of 30–60 min (Deutsche Bahn, 2013). As a result,
approx-Figure 8.Number of train routes with disruptions or interferences caused by extreme weather conditions (low-speed routes, platform or route closures; information source: GermanDeutsche Bahn AG
survey maps detailing interferences caused by extreme weather, in part updated several times a day).
imately 10 000 passenger trains and more than 3000 goods trains had to be diverted (Deutsche Bahn, 2014). Due to the travel time extension, a third of passengers took a flight to or from Berlin or continued their journey by car or intercity coach (Deutsche Bahn, 2014). The financial impacts of this disruption on the railway company itself and on further eco-nomic activities are difficult to evaluate and are hence not included in the numbers presented in Table 2.
3.4 Impacts on economic activities at the asset scale: with a focus on business interruption of individual companies
Although the European Floods Directive (2007/60/EC) ex-plicitly addresses the effects flooding has on economic AC-TIVITIES, current loss guidelines and reporting emphasise adverse effects on ASSETS. In order to further complement the nationwide data that were presented in Sect. 3.2 and fo-cused on losses to assets, this section looks at the diverse impacts floods can have on individual companies. The data from the survey described in Sect. 2.3.2 were used as the ba-sis for the analyba-sis.
Figure 9.Share of surveyed companies that reported on the different flood impacts.
by suppliers are most frequently reported by the manufac-turing sector, while sales restrictions are most frequently re-ported by the commercial sector (Fig. 9). Nevertheless, all sectors except for agriculture heavily suffered from dam-age to buildings as well as from business interruption. Thus losses caused by business interruption might be equally im-portant than direct asset losses. Except for the amount on in-sured losses, they are, however, not included in the overall losses given in Table 2 since they are more difficult to assess than repair costs.
In general, different methods are available for the estima-tion of business interrupestima-tion costs. The most prevalent ap-proaches are (1) to apply a sector-specific reference value per unit affected or per day of interruption to estimate the loss of added value, (2) to compare production output be-tween hazard and non-hazard years and (3) to calculate pro-duction losses as a fixed share of the direct damage (Meyer et al., 2013). Since the first approach is the most reliable, the companies surveyed about the 2013 flood were further asked about the period of interruption of operations in their company, as well as how long it took for normal operations without any restrictions to resume afterwards (period of re-stricted operations). The median value of downtime, through complete interruption of operations or restriction of opera-tions, amounted to 2 to 8 weeks respectively. In the case of the 2013 flood, there were, however, a number of com-panies that experienced far longer downtimes through inter-ruption or restrictions of operations: the 75 % percentile of downtime through the interruption of operations due to the 2013 flood amounts to 60 days, the duration with restric-tions of operarestric-tions to 150 days. The average loss caused by business interruption (including restrictions) amounted to EUR 137 287 (n=358; median: EUR 15 000). They were
Table 3.Financial losses of companies affected by the flood in June 2013.
Loss type Number of Mean Median of
surveyed financial the financial
companies (n) loss (EUR) losses (EUR)
Business interruption 358 137 287 15 000
Damaged equipment 327 287 126 20 000
Damaged buildings 310 524 292 80 000
Damage to goods, 238 46 897 8000
products and stocks
Damaged vehicles 26 26 765 16 500
only exceeded by the losses of damaged equipment or build-ings (see Table 3). Significant differences might, however, occur between different economic sectors, both in terms of downtimes through interruption of operations and in terms of loss share as was shown for the 2002 flood by Kreibich et al. (2007).
3.5 Impacts on cultural heritage
category is treated differently in the European guidance for recording disaster losses: not necessarily as financial losses, but lists of damaged cultural, historical and UNESCO world heritage assets are proposed as indicators for loss databases (Corbane et al., 2015); no minimum requirements apply.
Despite the difficulties of the monetisation of damages to cultural heritage, financial losses related to cultural as-sets are given in the report of the German government to the European Union Solidarity Fund. The initial overall amount of EUR 56 million (BMF, 2013) accounts for only 1 % of the overall financial losses listed in Table 2. Saxony-Anhalt, Thuringia and Saxony each reported losses to cul-tural assets of more than EUR 10 million, Bavaria more than EUR 6 million, Baden-Württemberg around EUR 1 million and Schleswig-Holstein EUR 350 000. A detailed list of af-fected cultural, historic or heritage assets is, however, miss-ing. Thuringia explicitly mentioned several damages to parks and gardens, for example the historic Greizer Landscape Park, a cultural place of national importance (Annex 16 in BMF, 2013). Schleswig-Holstein mentioned inundation of the historic centre of the city of Lauenburg on the Elbe that is under a preservation order. Furthermore, it is known that the (historic) city centres of Passau (Bavaria) as well as Grimma and Meißen (Saxony) were flooded. In contrast to 2002, the Garden Kingdom in Dessau-Wörlitz (Saxony-Anhalt) was rarely inundated despite higher water levels due to the mean-time upgrading of the flood protection. Nevertheless, rising groundwater damaged one castle of this UNESCO world her-itage site so that the restoration of the Garden Kingdom is with more than EUR 22 million one of the most expensive projects funded by the governmental disaster relief (Federal Parliament, 2015). This demonstrates the significant impor-tance that cultural heritage has in individual cases.
3.6 Environmental impacts
Similar to the impacts on cultural heritage, it is difficult to quantify flood impacts on the environment (see Meyer et al., 2013). In fact, some impacts that are adverse at first sight might be ambiguous due to the fact that floods are nat-ural phenomena and ecosystems in floodplains are adapted to flooding. Nevertheless, the environment can be damaged, especially by harmful inorganic and organic substances that have dissolved or are transported with sediments and flood-water and enter freshflood-water systems. With regard to contami-nants that are deposited in meadows, pastures and agricultur-ally used lands there is the risk of organisms absorbing them so that the contamination may sustain in food chains. There-fore, pollution must be regarded as the main indicator of adverse environmental flood impacts. Submerged protected ecosystem habitats and formation of new water bodies are further items that are considered by the European guidance for recording disaster losses (Corbane et al., 2015). However, no minimum requirements for loss documentation were sug-gested.
Adverse environmental effects might also occur if plains or flood retention areas have not been used in a flood-adapted manner. For example, in August 2002, the inten-tional flooding of theHavelpolderat the confluence of the rivers Elbe and Havel caused widespread fish deaths. The flooding submerged the agriculturally used areas and caused the sensitive plants, i.e. maize, to die off. The ensuing decay processes lowered the oxygen content in the water to such an extent that fish could no longer survive (DKKV, 2003). In June 2013, 430 000 ha of agricultural land was flooded (BMF, 2013), but according to the State Office of Nature Conservation and Landscape Management in the Free State of Saxony no fish deaths were noticed (LFULG, 2013).
In the framework of river monitoring programmes, sedi-ment load and water quality are frequently measured. Mea-surements are augmented during and after (extreme) flood-ing, particularly along the middle reach of the Elbe due to past mining and industrial activities in the catchment of the river Mulde (Böhme et al., 2005; BfG, 2014). The measure-ment programme along the middle reach of the Elbe provides a wealth of data on the quality of sediments, suspended mat-ter and floodwamat-ter (BfG, 2014).
In June 2013, an increased sediment load was observed in all main rivers, i.e. Rhine, Danube, Elbe and Weser (BfG, 2014). In the rivers Rhine and Weser, the total load during the flood each amounted to about 20 % of the average annual load. At many gauges on the rivers Elbe and Danube, even higher loads were measured with a maximum of two-thirds of the average annual load at the Danube River and even 80 % of the average annual load at a spot on the Elbe (BfG, 2014). In a few samples of water and suspended matter, increased concentrations of heavy metals and arsenic were detected, most probably originating from the Ore Mountains (Erzge-birge). The loads of heavy metals amounted occasionally to more than 100 % of the annual load in 2012, reaching a max-imum at the Magdeburg gauge. The loads were, however, comparable to those during former flood events, i.e. in 2002 and 2006 (BfG, 2014).
In the suspended matter, greatly enhanced amounts of organic pollutants such as hexachlorocyclohexane (HCH) and derivatives of DDT (1,1,1-trichloro-2,2-bis-(p-chlorophenyl)ethane), i.e. DDD and DDE, were measured here and there (BfG, 2014). These pesticides had been pro-duced in chemical plants in Bitterfeld-Wolfen until 1973 (DDT) and 1982 (HCH) and process wastes had been dumped nearby in abandoned open pit mines, causing se-vere pollution of soil and groundwater (e.g. Thieken, 2001; Böhme et al., 2005).
from damaged tanks has repeatedly been observed during flood events in Germany and had already been identified as a major source of environmental damage during the Whitsun Flood of 1999 in Bavaria. As a consequence, one-off manda-tory testing was introduced at that time for heating oil storage facilities with storage volumes of 1000 to 10 000 L located in flood-prone areas, a measure which came into effect on 1 January 2001 (LfU, 2014).
It is noteworthy that oil leakage and contamination not only harms the environment but also aggravates damage of flooded buildings considerably (see Kreibich et al., 2005; Thieken et al., 2005). In the administrative district of Deggendorf, up to 150 buildings have to be destroyed and newly erected because of oil contamination (Bavarian Parlia-ment, 2014). Since cost-effective and efficient technical fail-safe systems exist that counteract the floating of oil tanks (e.g. Kreibich et al., 2011), homeowners should be better in-formed about them. Since 2005, the Federal Water Act states that homeowners are obliged to mitigate damage according to their means. Additionally, the implementation of fail-safe measures ought to be monitored more consistently by public authorities (LfU, 2014).
4 Discussion and recommendations
In this paper, impacts of the flood of June 2013 in Germany were described with regard to the domains that are addressed by the European Floods Directive (2007/60/EC), i.e. human health, economic activities (and assets), cultural heritage and the environment. The investigation was further guided by the loss indicators proposed by Corbane et al. (2015) and IRDR (2015) for a consistent loss documentation and was comple-mented by analyses of traffic disruptions and further impacts perceived as important by affected residents and companies. It is noteworthy that guidelines on disaster losses such as Corbane et al. (2015) and IRDR (2015) are expected to become more important in the future when it comes to the implementation and monitoring of the Sendai Framework for Disaster Risk Reduction 2015–2030 (SFDRR) that was agreed upon in Sendai, Japan, in March 2015 by the United Nations (UN). In the SFDRR, seven targets to be achieved by 2030 are listed, which include, among others, a substantial reduction of (1) (global) disaster mortality, (2) the number of affected people, (3) direct economic losses and (4) damage to critical infrastructure and disruption of basic services such as health and educational facilities (UN-ISDR, 2015). Apart from these targets, four priority areas for action are defined, in which systematically recorded, evaluated, shared and pub-licly accessible loss data play a vital role in understanding and consequently mitigating the impacts of such events (UN-ISDR, 2015).
In case of the flood event in June 2013, data and infor-mation on the flood impacts could be presented for all four domains considered as relevant by the European Floods
Di-rective (2007/60/EC) and the SFDRR (Table 4). Table 4 fur-ther reveals that the data and information recorded for the 2013 flood do, however, often not meet the requirements of loss documentation as proposed by Corbane et al. (2015) or IRDR (2015). Therefore, the official reports were augmented by further data. The range of impacts portrayed in this pa-per (from direct to indirect damage caused by opa-perational and traffic interruptions through to health and environmental effects) does convey an impression of the diversity of the im-pacts that flood events can have at different scales. The used datasets have, however, some strengths and weaknesses. It should be noted that the availability of survey data and traffic disruptions is an exception rather than a rule and does require more effort and resources for data collection and data pro-cessing than may be available for many events. Such data do, however, provide detailed insights into impacts on the prop-erty scale, their perception etc. The analysis shows that af-fected residents perceive psychological stress, reinstatement works and supply problems more seriously than damage to buildings or household contents. With regard to economic activities, traffic and business disruption is more widespread than damage to economic assets or infrastructure elements. The costs attached to these impacts are, however, currently not assessed and hence not included in the overall damage figures. Therefore, more efforts are needed to include such impacts in loss documentation – by indicators or in mone-tary terms.
In contrast, rough data and information from governmental reports, media articles, etc. are generally available for many events. For the flood of 2013, there is a clear emphasis of the national and regional reports on the cost assessment of dam-aged assets for an application to the European Union Soli-darity Fund and for the creation of a national reconstruction fund. With regard to human losses, common loss indicators such as the number of dead, missing, injured and directly af-fected (or exposed) people are only entirely reported at the federal level (Table 1). In the reports of the affected states to the Federal Ministry of Finance (BMF, 2013) many specifi-cations are lacking. It is obvious that human losses are not the focus of an application to the European Union Solidar-ity Fund. This lack of information is, however, contrasted by the importance that this damage type is given in European and international agreements and that affected residents at-tribute to physical and particularly mental health problems caused by the flooding. A more comprehensive documenta-tion of human losses together with informadocumenta-tion on their con-texts would be helpful to prevent such losses in future. This was partly undertaken by GMLZ (2014). Most of this infor-mation is, however, not publicly accessible as requested by the SFDRR.
re-Table 4.Financial losses of companies affected by the flood in June 2013.
Domain Minimum loss indicators proposed Primary loss indicators Reported for the flood in 2013
by Corbane et al. (2015) proposed by IRDR (2015) by federal and state authorities
for a specific event
General items Reporting on NUTS levels 2 or 3 No further Reporting only on NUTS levels 0 or 1;
Hazard classification specifications NO data on NUTS levels 2 or 3
Time of the event No uncertainty assessment
Uncertainty assessment
Human health Deaths Deaths Deaths
Missing Missing Injured
Directly affected Injured Affected
Exposed Evacuated
Number of helpers
Complete reporting only on the federal level
Economic Total number of Economic loss as Direct damage (repair costs) in different sectors;
activities houses destroyed, cumulative estimate of in-/exclusion of insured losses and expenses for
and assets houses damaged, the amount of damage emergency response and indirect costs (e.g. caused
education centres to property, crops and by business interruption) is often unclear
(damaged or destroyed) and livestock and to the flow
health facilities of goods and services Almost no reporting of physical damage
(damaged or destroyed) expressed in monetary
terms (no distinction
Total economic (direct) loss between direct and
of all sectors, owners and indirect impacts)
loss bearers
Cultural heritage No minimum requirements Not considered Lump sum of repair costs
Environment No minimum requirements Not considered Extended monitoring of water quality
but no integrated assessment
ports of the affected states to the federal government differ in length, content and comprehensiveness. Some of the differ-ences can be explained by the different relevance the flood had for the respective state and some by previously experi-enced flooding or a lack of experience with event documenta-tion. In the future, economic indicators should by default be accompanied by information on the number of damaged or destroyed items (physical damage indicators), such as dam-aged buildings, enterprises, schools and health facilities as proposed by Corbane et al. (2015; see Table 4). On the one hand, such information will reveal further impacts on the af-fected population (e.g. supply problems, access to health fa-cilities). On the other hand, it will allow a better comparison and evaluation of the quality of the financial loss estimates reported by the states. The reasonability of first estimates could roughly be appraised by multiplying the numbers of damaged or destroyed item by an average loss per item or a rough damage estimation that is currently discussed for the monitoring of the SFDRR. Reasonable average losses could be derived from the survey data used in this paper. In ad-dition, such an approach could help to balance different ex-periences with event documentation between states. It is, of course, not applicable to cases with complex structural dam-age.
Furthermore, economic sectors should be clearly defined and agreed upon so that the loss documentation of differ-ent states and for differdiffer-ent evdiffer-ents can be better compared. Finally, costs for emergency services and disaster response should be explicitly reported since costing and reporting pro-cedures have been well established in civil protection. The loss reports on the 2013 floods suggest that this potential has not been fully exploited. Only some federal states ex-plicitly provided costs of emergency services of the flood of 2013, while others included them to infrastructure losses. This practise should be avoided since in the scientific litera-ture these costs are sometimes regarded as indirect costs (e.g. van der Veen et al., 2003).