POSITRON IMPACT IONISATION PHENOMENA
A thesis submitted to the U n i v e r s i t y of London for the degr e e of Doctor of Philosophy
J .Moxom
D e p artment of Physics and A s t r o n o m y U n i v e r s i t y College London
ProQuest Number: 10046091
All rights reserved
INFORMATION TO ALL USERS
The quality of this reproduction is dependent upon the quality of the copy submitted.
In the unlikely event that the author did not send a complete manuscript and there are missing pages, these will be noted. Also, if material had to be removed,
a note will indicate the deletion.
uest.
ProQuest 10046091
Published by ProQuest LLC(2016). Copyright of the Dissertation is held by the Author.
All rights reserved.
This work is protected against unauthorized copying under Title 17, United States Code. Microform Edition © ProQuest LLC.
ProQuest LLC
789 East Eisenhower Parkway P.O. Box 1346
Abstract
A m agnetically guided beam of n e a r l y - m o n o e n e r g e t i c slow positrons has been used to study p o s i t r o n impact ionisation phenomena in gases. A novel h e m i s p herical s c a ttering cell incorporating an efficient ion e x traction and d e tection system has been developed and has been u t i l i s e d throughout this work.
The energy spectra for the electrons ejected around 0° relative to the incident beam, following p o s i t r o n impact
ionisation of Ar, have been m e a s u r e d by a t i m e-of-flight m e thod and a retarding electric field analyzer. The angular
acceptance of the electron d etection system has been
estimated and used to compare the m e a s u r e d spectra w ith the double differential cross-sections c a l culated by M a ndai et al (1986) , Sil et al (1991) and Schultz and R einhold (1990) . The importance of the e l e c t r o n - c a p t u r e - t o - t h e - c o n t i n u u m process is discussed in this context and found to be m inor at small forward angles, in contrast to the case of heavy p o s itively charged projectiles.
The apparatus was modif i e d to produce a pulsed beam of slow positrons and u tilised to m e a sure in detail the total ionisation cross-section (Qt^) for a v a r iety of atomic and m olecular targets. For Ar, He and H2, Qt^ w h i c h includes contributions from Ps formation, has been subtracted from corresponding total cross-sections, in order to deduce the behaviour of the elastic scattering c r oss-section (Q^,) in the v icinity of the Ps formation t hreshold (EpJ . Here a small change in the gradient of Q^i has been found.
The energy dependencies of the for He, Ne and Ar, close to Eps have been interpreted in terms of t h reshold theory. In the case of A r the o utgoing Ps appears to be pr edominantly s-wave in character. For He and Ne the analysis suggests that the Ps contains significant c o ntributions from a number of partial waves.
Contents
page
Abstract 2
Contents 4
Figure Captions 7
Table Captions 15
A cknowledgements 16
Chapter 1. Introduction
1.1 Historical Background 17
1.2 Basic Properties of Positrons and Ps 19
1.3 Experimental Techniques 24
1.3.1 Two-Photon Angular Corr e l a t i o n
Measurements 25
1.3.2 The Doppler Broadening T e c h n i q u e 27
1.3.3 The Lifetime Technique 28
1.4 The Development of Slow P o s i t r o n Beams 31
1.5 Positron-Atom(Molecule) C r o ss-Sections 40
1.5.1 Total Cross-Sections 41
1.5.2 Excitation Cross-Sections 46
1.5.3 Elastic Scattering Cross-Se c t i o n s 48
1.5.4 Ionisation 53
1.6 The Aims and M o t ivation for the Present Work 54
Chapter 2. The Experimental Apparatus
2.1 The General Layout of the Appar a t u s 56
2.2 The Source and Mode r a t o r 57
2.3 The B e a m Transport and V a c u u m Syst e m 62
2.4 The Scattering Cell and Ion E x tractor 65
2.5.1 A Computer Simulation of the Ion
T r a j e ctories 6 8
2.5.2 The Ion Extraction Efficiency 70
2.5.3 The Ion Flight Times and their
Lifetimes in the Scattering Cell 72
2.6 Summary 77
Chapter 3. Ejected Electron Energy Spectra in Low
Energy Positron-Atom Collisions
3.1 Introduction 78
3.1.1 ECC in Ionisation by Protons and
Positive ions 79
3.1.2 ECC in Ionisation by Positrons 82
3.1.3 Experimental Evidence of ECC in P o s i t r o n - A t o m Collisions and the
Present Work 84
3.2 Experimental Details 87
3.2.1 The Tran s m i s s i o n Probability Function 89
3.3 The Beam Tagger 92
3.4 The Electronics 95
3.5 Data R e s t o r a t i o n 100
3.5.1 R e s t o r a t i o n of TOF Spectra 100
3.5.2 R e s t o r a t i o n of R e tarding Field Spectra 102
3.6 Systematic Effects 102
3.7 Results and Discussion 104
3.8 Summary 110
Chapter 4. Total Ionisation Cross-Sections in Positron-Gas Collisions
4.1 Introduction 111
4.1.1 Ps Formation Cross-Sections 111
4.1.2 Single Ionisation Cross-Sections 118
4.1.3 Total Ionisation Cross-Sections and
4.2 Experimental Details 125
4.3 Beam Char a c t e r i s a t i o n 129
4.4 The Electronics 133
4.5 Data Colle c t i o n and R e s t o r a t i o n 138
4.5.1 Electron lon-Yields 140
4.5.2 Posit r o n lon-Yields (2-300eV) 142
4.5.3 L o w Energy Positron lon-Yields 142
4.6 Results and Discussion 143
4.6.1 E lectron Results 143
4.6.2 Posi t r o n Results (2-300eV) 146
4.6.3 L o w Energy Positron Results 149
4.7 Summary 153
Chapter 5 . Threshold Effects and Channel Coupling in Positron Collision
Cross-Sections
5.1 I ntroduction 154
5.2 The E n ergy Dependence of Q^,, Close to Ep, 159 5.3 The E n ergy Dependence of Qp^ Close to
T h r e s h o l d 166
5.4 Thres h o l d Effects in Posit r o n - A r Scattering 170 5.5 Near T h r e s h o l d Effects in P o s i t r o n O2
Scatt e r i n g 173
5.6 Summary 175
Chapter 6. Conclusions
177
Figure Captions
Figure
Caption
Page
1.1 F e y n m a n d i a g r a m s f o r p o s i t r o n 20 an n i h ilation into 1-4 photons.
1.2 The 3 - 7 energy distr i b u t i o n from the 21 decay of o-Ps m e a s u r e d by Chang Tian-Bao
et al (1985) compared w i t h theory (see t e x t ) .
1.3 A schematic d i a g r a m of the n = 1 and n = 2 3 2 states of H and Ps.
1.4 A schematic d i a g r a m of a typical A G A R 26 a p p a r a t u s .
1.5 2-D A G A R spectra of positrons 27
a n n i h ilating in a) single crystal quartz (Manuel 1981) and b) Gu (Haghgooie et al 1978) .
1.6 A typical arrangement for m e a s u r i n g 28
Doppler b r o a d e n i n g spectra.
1.7 a) The apparatus used by Coleman et al 3 0
(1975) to m e a s u r e p o s i t r o n lifetimes in
gases and b) a lifetime spectrum for
positrons a n n i h i l a t i n g in Ar (Coleman et al 1975).
1.8 Comparison of the slow p o s i t r o n yield 31
from a W(IOO) m o d e r a t o r w i t h the 0+ spectrum from a ^Co source.
1.9 The poten t i a l s seen by a p o s i t r o n and an 34 electron n ear the surface of a metal.
1.10 The slow p o s i t r o n y ield from a Cu surface 37 as a f unction of cf>+ (Murray and Mills
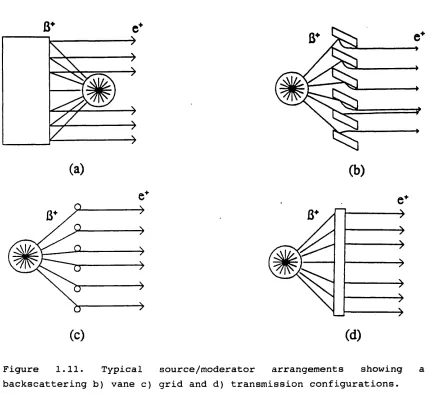
1.11 Typical source/moderator arrangements 38 showing a) back s c a t t e r i n g b) vane c) grid
and d) t r a n s m i s s i o n configurations.
1.12 Qt for p o s i t r o n - H e scattering: Stein et 42 al (1978), O; M izogawa et al (1985), •;
Canter et al (1972) , v; sinapius et al
(1980), V ; Coleman et al (1979), □;
Amusia et al (1976), dashed line; Wadhera et al (1981), solid line line ; M c E a c h r a n et al (1977) dotted line.
1.13 Q, in He for positrons (Stein et al 1978, 44
K auppila et al 1981) and electrons
(Kauppila et al 1981).
1.14 Qgx for p o s i t r o n - H e scattering: Sueoka 47
(1989), o; Coleman et al (1982), +;
Parcell et ai (1983,1987) (1S-2S and IS-2 P ) , d a s h e d line.
1.15 dOd/dn for p o s i tron-Ar scattering. 49
Experiment: Coleman and McNu t t (1979), O # . Theory: Schrader (1979), solid line; M cEac h r a n et al (1979), dashed line (see t e x t ) .
1.16 A schematic d i a g r a m of the apparatus used 49 by Hyder et al (1986) to m e a sure da^/dn.
1.17 d(7ç|/dn f o r p o s i t r o n / e l e c t r o n - A r 50
scattering: Hyder et al (1986), #0;
Srivastava et al (1981), •; M c E a c h r a n and Stauffer (1986), solid line; J oachain and Potvliege (1987), dashed line; N ahar and Wadhera (1987), dotted line.
1.18 dcTd/dn for p o s i t r o n - A r scattering, a) 51 30eV. Experiment: Floeder et al (1988) ,□;
1.19 dCgj/dn for Ar at 90°, p l o t t e d as a 52 function of impact energy (Dou et al
1992) .
1.20 for positrons, electrons, protons and 54
anti-protons. (Charlton at al 1988, 1989, Andersen at al 1987).
2.1 The decay schemes and b r anching ratios of 57
^^Na and C o .
2.2 A cutaway diagram of the chamber h o u sing 59
the source and m oderator assembly.
2.3 A schematic d i a gram of the source and 60
m o derator holder showing a) the ^^Na source and b) the ^Co source (not drawn to s c a l e ) .
2.4 A schematic diagram of the posit r o n beam 63 transport and vacuum system (not drawn to
s c a l e ) . The solid black areas represent coil windings.
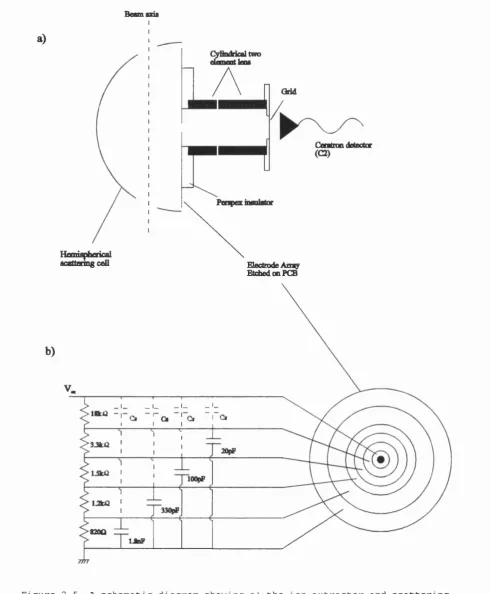
2.5 A schematic diagram showing a) the ion 6 6
extractor and scattering cell and b) the
network used to derive suitable
p otentials for the ion extractor
e l e c t r o d e s .
2.6 A computer simulation of ion t rajectories 69
through the ion extractor.
2.7 The variation of the ion-yield w i t h gas 71
pressure in the scattering cell.
2.8 A schematic d i a gram of the circuit used 73
to measure ion lifetimes in the
scattering cell and flight times to the detector.
2.9 D istribution of ion-flight-times for a) 75
Ar and b) Hj.
2.10 Distributions of ion lifetimes in the 76
3.1 Cross section for electrons ejected from 80 He at 0°by 300keV protons (Macek 1970),
dash-dot line; 1.4° M a c e k (1970), dotted line; 0° (Crooks and Rudd 1970) , dashed line.
3.2 d^u/dEdn for electron emission from H by 82
lOOeV positrons. Solid line, Sil et al (1991); dashed line, Schultz and R einhold
(1990); dash-dot line. Mandai et al
(1986) xO.l.
3.3 Triple differential cross - s e c t i o n for 83
electron emission from H, at 0°, by IkeV positrons (Brauner and Briggs 1986).
3.4 Electron count rate versus r etarding 8 6
potential (Coleman 1986).
3.5 Results of Brauner and Briggs (1986) 8 6
integrated and normalised, □; Results of Charlton et al (1987) for 200eV p ositron impact on Ne, •.
3.6 A schematic d i a gram of the apparatus used 8 8
to measure ejected electron energy
spectra (not drawn to s c a l e ) .
3.7 The estimated tran s m i s s i o n p r o b a b i l i t y 91 function, T(E,#), of the apparatus.
3.8 A schematic diagram of the beam tagger 93
(not drawn to scale) showing M2 and CEMA.
3.9 A schematic d i a gram of the circuit used 94
to measure the perf o r m a n c e of the beam t a g g e r .
3.10 A schematic d i a gram of the circuit u sed 97 to measure TOF spectra.
3.11 A schematic diagram of the circuit used 99
3.12 Ejected electron energy spectra o btained 105 a) from a retarding potential spect r u m at
an impact energy of 106eV, and b) from a
TOF spectrum at an impact energy of
lOOeV.
3.13 The results of Sil et al (1991) dashed 107
line, and Schultz and R e i n h o l d (1990) solid line, both convoluted w i t h T ( E , # ) .
3.14 Ejected electron energy spectra obta i n e d 108 from TOF spectra at impact energies of a)
150 and b) 50eV.
4.1 A schematic diagram of the a p paratus used 113
by Fromme et al (1986,1988) to m e a s u r e Qp^
and .
4.2 Qps in He. Experiment: Charlton et al 114
(1983),•; Fornari et al (1 9 8 3),O; Fromme et al (1986),a; Diana et al (1986) ,□. Theory: Khan et al (1985), solid line; Mandai et al (1979), dash - d o t line; Roy et al (1984) dashed line.
4.3 Qpj in Hj. Experiment: G r i f f i t h et al 114 (1983),#; Fornari et al (1 9 8 3),O; Diana
et al (1986) ,□; Fromme et al (1988),a. Theory: Ray et al (1980), d a s h e d line; Sural and Mukherjee (1970), solid line; Bussard et al (1979), d ash-dot line.
4.4 A schematic diagram of the apparatus used 117
by Sperber et al (1992) to m e a s u r e Qp^ in H.
4.5 Qps in H (Sperber et al 1992). 117
4.6 for p o s i t r o n - H e s c a t t e r i n g . 119 Experiment: Fromme et al (1986),#; Diana
et al (1985),v; Sueoka (1989),+. Theory: Campeanu et al (1987b), d a s h e d line; G olden and M c G uire (1976), d o t t e d line; Peach and McDowell (1983) , d a s h - d o t line; Basu et al (1985), d a s h - d o t - d o t line. Q: for He (Montague et al 1984), solid line.
4.7 A schematic diagram of the a p paratus used 121
4.8 Qj'*’ for positron-He scattering (Knudsen at 121 al 1990).
4.9 for H. Experiment: Spicher et al 123
(1990),o; Jones et al (1993),#. Theory: Ghosh et al (1985) M u k h e r j e e et al (1989),▼; Ohsaki et al (1985),v; Wetmore and Olson (1986),
10
;
Ac a c i a et al(1993),A.
4.10 A schematic diagram of the apparatus u sed 126
to measure ion-yields (not drawn to
s c a l e ) .
4.11 A schematic diagram of the potential 130
divider used to derive V^. All resistors are 1.8M0.
4.12 The circuit used to m e a sure b e a m energy 13 0 p r o f i l e s .
4.13 Energy distributions of beams of a) 131
electrons and b) positrons w ith a
moderator potential (V^) of m a gnitude lOV.
4.14 A schematic diagram of the circuit used 134
to measure ion-yields.
4.15 A schematic representation of the pulses 137
applied to the ion extractor and the Wien filter.
4.16 The curcuit used to m e a s u r e the beam 139 intensty as a function of time.
4.17 The beam intensity as a funtion of time. 139
4.18 o, the present values of Q{ for a) He, b) 144 Ar and c) H2. Solid lines r e present Q,'
obtained from literature.
4.19 Small circles represent the present 147
4.20 a) He: present values of 150 (Qps+Qi'*') (Fromme et al 1986),o; Qp^ (Khan
and Ghosh 1983,Khan et al 1985), dashed line; Qp, (Mandai et al 1970) , solid line
b) H2: present values of ,
(Qps+Qj^) (Fromme et al 1988) ,0 .
4.21 a) Ar: present values of ; Q^(Fornari
et al 1983) + (Knudsen et al 1990),O.
b) Ne: present values of Q / ,#; QpJDiana 1 5 1 et al 1985) + Q / ( K n u d s e n et al 1990),0 .
5.1 The results of Brown and H u m b e r s t o n 156 (1985) showing A, Q^,; B, Q^i+Qp*; C, a
linear extrapolation of Q^i from b elow Ep^.
5.2 Cusp feature in Q^, for p o s i t r o n - H e 157 scattering, as obtained by C ampeanu et al
(1987) .
5.3 •, (Qci+Qcx+Qi"^) from Coleman et al (1992); 159 solid line, from Stein et al (1978) ;
dashed line, Qd+Qcx from C ampeanu et al (1987) .
5.4 The present values of for p o s i t r o n - H e 161
scattering, •; (Mizogawa et al 1985),
▼ ; Qt (Stein et al 1978) , v; Q,(Mizogawa et al 1985)-Q/, ■; Q X S t e i n et al 1978)-Q,\n.
5.5 The present values of Q^"^ for p o s i t r o n - A r 161 scattering, •; Qj (Charlton et al 1984),
t ; Qt (Kauppila et al 1976), □ ;
Qt(Charlton et al 1 9 8 4 ) -Q/, ■; Qt (Kauppila et al 1976)-Q/, v.
5.6 The present values of Qt"^ for positron-Hj 162 scattering, #; Qt (Hoffman et al 1982),
□; Qt (Charlton et al 1983) , v ; Qt(Hoffman et al 1982)-Q/\ a ; Qt(Charlton et al
1983)-Q^, ■.
5.7 For positron-He scattering: Qt (Mizogawa 163
5.8 For positron-Ar scattering: Q^ (Charlton 163 et al 1984), •; (Kauppila et al 1976),
v; Qt(Charlton et al 1 984)-Q/, t ;
Qt (Kauppila et al 1976)-Q/\ □. The solid lines are least squares fits to the data.
5.9 For posi t r o n - H2 scattering: Qt (Hoffman et 164 al 1982), v; Qt (Charlton et al 1983), •;
Qt (Hoffman et al 1982)-Q/, □; Q, (Charlton et al 1983)-Q^, v . The solid lines are least squares fits to the data.
5.10 The present values of Q^^ for posit r o n - H e 166 scattering, o; Q^^ (Sueoka 1989), •; Q,*
(Coleman et al 1982), v; Q^^ (Hewitt et al 1992) , a ; Qçx (Ficocelli-Varracchio and
Parcell 1992), solid line.
5.11 Present values of Qt"^ for He, v; Ne, O and 169 Ar, #. The solid lines are least squares
fits to the data.
5.12 Qt values from Kauppila et al (1976) o, 172
Coleman et al (1980) • and Charlton et al (1984) X . Dashed curve is Qq, solid
curves are Q^, and Qt derived u sing 6^ from McEachran et al (1979) and dotted curves are Q^i and Qt derived using 6^ 4-2.
5.13 Present values of Q,'*' for p o s i t r o n-02 175 scattering a and Qsr from Katay a m a et al
Table Captions
Table
Caption
Page
4.1 A table showing the v a r i a t i o n in 13 3
intensity and FWHM of beams of
p o s i t r o n s and electrons, as V, is v a r i e d w ith respect to V^.
5.1 A t able showing the partial cross- 160
s ections that contribute to Qj, and QrQi^, for an atomic target.
5.2 A table showing the values of AQ^ and 165
Acknowledgements
Acknowledgements are due to;
G. Laricchia for supervision and encouragement;
M. Charlton, W. E. Meyerhof and members of the experimental p ositron group at UCL for useful d i s c u s s i o n and practical help;
CHAPTER 1
INTRODUCTION
1.1 Historical Background
The existence of anti-matter was first p r e d i c t e d by Dirac (1930a), following his formulation of the relat i v i s t i c a l l y invariant Schrodinger equation for free electrons in an
electromagnetic field. Solutions w ere obtained which
corresponded to states of the p articles w ith negative energies. These arise as a direct cons e q u e n c e of Einstein's equation for the total energy (E) of a p a r t i c l e of rest mass
(mo) and m omentum (p)
E^=IT1qC ^ + P ^ C ^
(
1.
1)
where c is the speed of light, in vacuum.
Dirac proposed that the vacu u m should be considered to consist of an infinite and uniform sea of electrons occupying
all the negative energy states below -mgC^, the Pauli
exclusion principle forbidding the t r a n s i t i o n of free
electrons from positive energy states to the occupied
negative states. An electron may, however, be excited from a negative to a positive energy level, leaving behind a " h o l e " . This hole, in an otherwise filled sea of electrons, would appear to possess the properties of a p a r t i c l e w i t h positive mass and charge.
to a new particle with the same mass as an elect r o n and this particle (or anti-electron) was named the positron.
Positrons were first observed by A n d e r s o n (1932) in a cloud chamber study of cosmic rays. The tracks p r o d u c e d by these particles were initially a t t r i b u t e d to protons. However, Blackett and Occhialini (193 3), u sing a similar experimental technique, showed that the o bserved particles had the same mass as an electron. The existence of the posit r o n was thus confirmed.
It was suggested by Moho r o v i c i c (1934) that a q u a s i stable hydrogenic bound state of a p o s i t r o n and elect r o n may exist. This bound state was named p o s i t r o n i u m (Ps) by Ruark (194 5) and soon received considerable theoretical attention (e.g. Wheeler 1946 and Fulton and M a r t i n 1954). Its existence was experimentally v erified by Deutch (1951) w h ilst m e a s u r i n g p ositron lifetimes in gases.
The positron is intrinsically of g r eat interest as a r eadily available example of anti-matter. Positrons can be obtained from the decay of certain r a d i o n uclides and have become powerful probes of a wide range of p hysical phenomena. The possibility of annihilation of a p o s i t r o n w i t h its a n t i particle, the electron, has made p o s s i b l e the investigation of such phenomena by a number of experimental techniques wh i c h rely on the detection of the annih i l a t i o n photons. These are discussed in § 1.3.
Positrons may be formed into nearly m o n o - e n e r g e t i c beams and these have been used, among other things, to study the interaction of positrons w ith single atoms(molecules) at well de f ined energies. This has p r o v i d e d u n i q u e information of a
co mplementary nature to that a v ailable from electron
scattering. The complementarity arises because, as a
p r ojectile the positron has the same m ass but opposite charge sign to an electron. Thus, a c o m parison of c o llision cross-sections for positron and electron proj e c t i l e s m a y high l i g h t the effects of the projectile charge sign, c o r r elation and exchange on collision processes. A channel unique to p o s i t r o n
positron-atom(molecule) collisions, r e s u l t i n g in target ionisation have been investigated d u r i n g the course of the wo r k pres e n t e d in this thesis.
In this chapter a discussion of the physical p r o perties of positrons and Ps is followed by a brief r e view of some of the experimental techniques used in p o s i t r o n physics. This is followed by a summary of some of the available data for p o s i t r o n collision cross-sections, w i t h emphasis on those w h i c h are p a r t icularly relevant to the p r e s e n t work.
1.2 Basic Properties of Positrons and Ps
The a n n i h ilation of a low energy p o s i t r o n with an electron will almost always result in the emis s i o n of a number of 7 -ray photons. If the two particles a n n i h i l a t e from rest, the total energy of the photons will be equal to the sum of the rest mass energies of the a n n i hilating pair, 2moC^. This is a p proximately 1.022MeV. The number of photons emitted is dictated by the conservation of charge p a r i t y ( P J . A single photon has P^ = -1, so for a system of n photons
(-1 )" (1 .2 )
Yang (1950) showed that the selection rule for posit r o n a n n i hilation into n photons is
(-1)"= (-1)^"^ (1.3)
w here L and S are the total angular m o m e n t u m and spin of the p o s i t r o n - e l e c t r o n system.
Y Y
Figure 1.1. Feynman diagrams for positron annihilation into 1-4 photons.
photons. One and three photon e mission both h ave m = 3, however single photon annihilation is less likely by a factor of around a^, since it requires the p r e s e n c e of a t hird body to conserve momentum. A n n i h ilation into four photons is the least probable annihilation mode shown, but has r e c e n t l y been observed by Adachi et ai (1990) who m e a s u r e d the b r anching ratio for 4 7 to 2y decay as (1.3 0 ± 0 .31) xlO'^ in accord w ith t heory (e.g. McCoyd 1965,Billoire at al 1978) . R a d i a t ionless annihilation is also possible and is an A u g e r - l i k e process, in w hich a positron annihilates w ith a bound electron, the excess energy causing an inner-shell e l e c t r o n to be ejected from the atom. This process was first p r e d i c t e d by Brunings (1934). Its branching ratio was calcu l a t e d by M a s s e y and Burhop (1938) and more recently by M i k h a i l o v and Porsev (1992), who estimated a cross-section for this process of the order of lO'^^cm^.
zero and hence m = 0. The ratio of the cross sections for o-Ps to p-o-Ps formation therefore are 3:1. A c c o r d i n g to the
above arguments and equation 1.3, o-Ps will decay
predominantly into three photons and p-Ps into two. In the latter case, the two photons, as v i e w e d from the c e n t r e of mass (c.m.) frame, are emitted at 180° to e ach other and have equal energies («SllkeV). Meas u r e m e n t s of the p h o t o n energy and deviation from co-linearity in the lab-frame, m a y be used to obtain information about the m o m e n t u m of the annih i l a t i n g pair, as discussed in section 1.3. The t h ree photons from the decay of o-Ps are emitted c o - p l a n a r l y w i t h an energy distribution which was calculated by Ore and Powell (1949) and has been measured by Chang T i a n - B a o et al (1985) . Both sets of results are shown in figure 1.2.
Dashed C u rve: Ore-Powell phose-spoce prediction
Lineor spectrum: Adkins phose-spoce prediction
Reol curve :
QEO spectrum with 0 ( a ) correction
ÿ
Our experimental points
^
0.2 oCO
L_l
od
100
200
300
400
PHOTON ENERGY( k e V )
500
Figure 1.2. The 3-y energy distribution from the decay of o-Ps measured
Dirac (1930b) calculated the cross section for two phot o n
annihilation of a non-relativistic, free
electron-p o s i t r o n electron-pair as
% c
(e-) = ° (1.4)
V
wh ere v is the relative velocity of the p o s i t r o n and electron and ro=e^/(47T€oinoC^) is the classical e lectron radius.
For positrons in a gas this equation has been m o d i f i e d (e.g. Heyland et al 1982) to
^ nr^cz^,,(v) (1.5)
V
w h ere Zgff(v) is an empirical q uantity r e p r e s e n t i n g the e ffective number of electrons per atom seen by a p o s i t r o n w i t h velocity v. It may be significantly greater than the
atomic number due to long range interactions. At the
collision velocities typically encountered in p o s i t r o n beam experiments, is of the order of lO'^W for Z^ff = 1. Since the 3 - 7 decay mode is around 376 times less likely (from the spin averaged decay rate r a t i o ) , direct annih i l a t i o n has a negligible cross-section in comparison w i t h most other atomic collision processes, at these energies.
Hydrogen
Lyman-a
10.2eV
1215A
2P,
2S,
1057Mhz Lam b shift
2P,
IS,
SINGLETS TRIPLETS LIFETIMES
Positronium s, ii4^jec
8 6 2 0 (5 ) GHZ (3 y DECAY)
3.18 n»ec (L Y M A N -a EMISSION)
1233600(1) GHZ tO O n se c ( 2 y DECAY)
141.8(1) nsec ( 3 y DECAY)
/2 0 3 .3 8 9 ( 1 ) GHZ
H.
The vacuum annihilation rate of p-Ps ( X p ) has been c a l culated to be 7.9852ns‘^ by Harris and Brown (1957) and the m o s t recently calculated value of the decay rate for o-Ps (\J is (7.0 3 8 3 0 ± 0 .00007) jLts'^ (Adkins 1983). Xp has been me a s u r e d by Gidley et al (1982) who employed a m a g n e t i c field to m i x p-Ps with the m = 0 sub-state of o-Ps. A value for Xp of (7. 9 9 4 ± 0 . Oil) ns'^ was obtained, in a g reement with theory.
However, discrepancies exist between t h eory and
experiment in the case of X^. Here, the most recent
m e a s u r e m e n t is (7.0 4 8 2 ± 0 .0016) ns'^ (Nico et al 1991) and is around 6 . 2 of its standard deviations above the t h e o retical value. Nico and co-workers have c o nsidered care f u l l y the p o s s i b i l i t y that this discrepancy might be due to systematic effects, but having attempted to eliminate p o s s i b l e sources
of error, have suggested that higher order terms are
n ecessary in the calculation.
1.3 Experimental Techniques
Positrons with a broad d istribution of v e l ocities may be obtained from the decay of radionuclides. Two c ommonly used sources are ^^Na and ^®Co, the decay schemes and bran c h i n g ratios of which are shown in figure 2.1. In the early swarm-type experiments, these positrons were injected d i r e c t l y into the sample under investigation and information about their interactions with the m e d i u m was obtained by o b s e r v a t i o n of
the annihilation 7-rays. Over the years, much useful
information has been gained from these types of experiments and among their major achievements are the o b s e r v a t i o n of Ps and the m easurement of its lifetimes.
w a v e l e n g t h of a thermalised posit r o n and result in the localisation of the positron w a v e - f u n c t i o n at the defect site. W hen a p ositron becomes trapped at a vacancy defect, the overlap of its w a v e - f unction w i t h that of the more energetic core electrons decreases, relat i v e to the less tightly bound conduction electrons. For reasons explained below, this may lead to an observable reduction in the d eviation from co-linearity and Dopp l e r - s h i f t of the annihilation 7-rays. There is also a r e duction in the e lectron density at a vacancy site r e s u l t i n g in an increase in the m ean posit r o n lifetime. These effects may be u s e d to estimate the defect concentration in the sample as well as the type of defects present. The abil i t y of ther m a l l y activated vacancies to trap positrons in this way was first demonstrated by M a cKenzie at al (1967) and has subsequently been extensively studied (e.g. see r e v i e w by Schultz and Lynn 1988) .
1.3.1 Two-Photon Angular Correlation Measurements
The technique involving the m e a s u r e m e n t of the angular correlation of annihilation radiation (AGAR) has been w i d e l y used to study the annihilation of positrons in solids, liquids and gases. If a p ositron annihilates via the two photon decay mode then, in the c.m. frame, the two photons will be emitted co-linearly, as already mentioned. In the lab-frame a deviation of the photons from co-li n e a r i t y (6) ma y be used to deduce the c.m. m o m e n t u m of the p o sitron-electron pair at the moment of annihilation. In A G A R experiments it is this angular devia t i o n that is measured.
significantly higher energy because of the effect that the Pauli exclusion principle has on the sea of electrons in the sample. The range of values of
6
is therefore almost entirely due to the momentum distribution of the electrons. Figure 1.4 shows a schematic diagram of a typical ACAR apparatus. A positron source (e.g ^^Na) is placed directly adjacent, or immersed in, the sample so as to maximise the fraction of implanted particles. In most solids the positrons achievenear thermal equilibrium in a few ps and eventually
annihilate with an electron with lifetimes typically of the order of lO'^^s. In ACAR experiments the annihilation radiation is monitored by two detectors placed a few metres away. One of the detectors is rotated about the sample, in order to measure the coincidence rate between the two detectors as a function of
6
. In this way an ACAR spectrum is acquired. The angular resolution of such an apparatus is mainly determined by geometric factors such as the angular acceptance of the detectors and the dimensions of the source and sample. Figure 1.5a) shows the two dimensional (2D) ACAR spectra for p-Ps annihilating in quartz. The very low momentum of the annihilating pair is reflected in the sharp peak, unlike the 2D-ACAR distribution for single crystal Cu shown in figure 1.5b). Here the distribution is much broader, due to the fact that the positrons annihilate with more energetic electrons.- S Œ t r ■
N a l and c I
photomultiplier detector sam ple L e a Le*d shielding
N(P.P)
[OlO] r mcild^
Figure 1.5. 2-D ACA R spectra of positrons annihilating in a) single crystal quartz (Manuel 1981) and b) Cu (Haghgooie et ai 1978).
1.3.2 The Doppler Broadening Technique
The Doppler broadening technique may also yield information about the momentum distribution of electrons in a solid. It relies on the measurement of the Doppler shift of the energy of the annihilation photons, caused by the motion of the
annihilating pair. The c.m. kinetic energy of the
annihilating pair (E,^) in the lab frame is related to the shift hAi^ by
The Doppler shift of the t w o- 7 a n n i h i l a t i o n r a diation may cause the c o r r e s ponding photo-peak in the energy spectrum to become broadened. The degree of b r o a d e n i n g may then be related to the m o m e n t u m d istribution of the electrons.
The energy of the annihilation radia t i o n is usually monitored u s ing high resolution detectors [e.g. G e ( L i ) ] with a set-up of the type shown in figure 1.6.
Source
and
sample
Multi-
channel-anaiyser
Amplifier
Baised
amplifier
High
resolution
detector
Figure 1.6. A typical arrangement for measuring Doppler broadening
spectra.
As well as studying the annihilation of posit r o n s in solids, the technique has been used to m o n i t o r the in flight annihilation of p-Ps and to observe the formation of Ps,
(Mills 1981) the bound state of a posi t r o n and two electrons, the existence of w h ich was p r edicted by W h e e l e r (1946). The technique has also been used to m o n i t o r the formation of a p proximately m o n o - e n e r g e t i c Ps in charge exchange reactions of positrons w i t h He (Brown 1986).
1.3.3 The Lifetime Technique
since been applied to study interactions of p o sitrons with liquids and solids. Altho u g h the assoc i a t e d instrumentation has improved, the basic principle of lifetime m e a s u r e m e n t s has remained the same. A typical apparatus used to measure p o s i t r o n lifetimes in gases is that of C o l eman et al (1975), shown in figure 1.70a). A 1.28MeV 7-ray follows the emission of a positron from the ^^Na source w i t h i n around lO'^^s and is d etected by a fast plastic scintillator, optically coupled to a photo-multiplier tube. This is used to gene r a t e a start pulse for the timing system. A second d etector is u s e d to generate stop pulses from the anni h i l a t i o n 7-rays of positrons diffusing through the gas. A lifetime spect r u m is built up from a large number of such events. A lifetime spectrum obtained in this way by Coleman et al (1975) for Ar gas at 297K and a gas pres s u r e of 6.3 amagats is shown in figure 1.7b).
After background subtraction the s p e c t r u m can be divided into three regions. The prompt peak at the left h and side of the spectrum is caused by the decay of p-Ps and anni h i l a t i o n of positrons in the source and chamber walls. This is followed by a shoulder region w h i c h is due to the annihilation of free positrons before thermalisation. The remainder of the spectrum is the sum of two exponential decay curves, corresponding to the a n n i hilation of t h e r malised positrons and o-Ps. The two components are s e parated by fitting an exponential to the slower o-Ps component and subtracting this from the spectrum to obtain the free p o s i t r o n component. This spectrum is typical of those obtained for most gases although, in general, m o l e c u l a r gases have no resolvable shoulder region. This is due to the rapid thermalisation of the free positrons caused by the e x istence of vibrational and excitational energy levels exte n d i n g down to thermal energies. This type of analysis has r e s u l t e d in the extraction of information about the slowing down of
positrons, their lifetimes in the media, the formation
a) S T A I N L E S S S TE E L - G A S I N L E T
S C I N T I L L A T O R S C I N T I L L A T O R
PTFE WASHERS
G O L D P I N
S O U R C E GO L D P L A T I N G
C O PP ER C H A M B E R
1 A T T E N 1 S C A L E R I
A T T E N STOP U A T O R
1 1 N , l U A T O R
1 1 Z.C.D.
1 --- 1 i
T A C 1
h
Z .C. D. — M O N O S T A B L E «■
g a t e|j-l
j
i
M C A .
S C A L E R ( N j l
(b)
A R G O N at 6-3 A m a g a t s
( d )
( a )
( a ) - r a w d a t a
; ( b) - r e s t o r e d s i g n a l 1( c) - f r e e p os i t r on c o m p o n e n t
• ( d ) - f i t t e d o r t h o - p o s i t r o n i u m
90 110 130 150
C h a n n e l N u m b e r
Figure 1.7. a) The apparatus used by Coleman et al (1975) to measure
positron lifetimes in gases and b) a lifetime spectrum for positrons
information complementary to that obtained using ACAR and Doppler-broadening technigues.
1.4 The Development of Slow Positron Beams
The techniques mentioned above are constrained by the broad energy and angular distribution of the incident positrons. A significant advance in the field of experimental positron physics came with the development of tunable, nearly mono-energetic beams of low energy positrons. Such beams are produced by slowing down particles, from a radioactive source or pair production by bremsstrahlung radiation, to near thermal energies using a solid state moderator. Figure 1.8 shows the differential yield of re-emitted positrons from W(llO) in comparison with the normalised spectrum from ^^Co (from Schultz and Lynn 1988). This demonstrates that at low energies, moderation is several orders of magnitude more efficient than energy selection as a method for obtaining slow positrons.
M ODERATED
10'\
10' \
E M IT T E D P O SITR O N SPEC TRU M FOR C o -5 8
10'":
TTttr
ln [E (e V )]
Figure 1.8. Comparison of the slow positron yield from a W(IOO) moderator
The p o s s i b i l i t y that positrons with near thermal energies could be o b t a i n e d by implanting part i c l e s from a r a d i oactive source into a solid was first s u ggested by Ma d a n s k y and Rasetti (1950). They e s timated that the e f f iciency of such a m o derator w o u l d be deter m i n e d by the ratio between the positron d i f f u s i o n length and the m e a n implantation d e p t h of the incident (3'^ particles. This they calculated to be of the order of 1 0^ for the samples used in their experiment. Here, a ^ C u p o s i t r o n source w i t h an a ctivity of (10-3 0)mCi was used to irradiate various samples including Pt, g l ass and mica. The slow posit r o n s w ere to be confined by a m a g n e t i c field and detected by o b serving 7-rays from their a n n i h i l a t i o n on an Al foil, arou n d 80cm from the sample. Unfortunately, M a d a n s k y and Rasetti (1950) were unable to d e tect any low energy positrons, prob a b l y due to the low s e n s itivity of their apparatus and defective samples. They did however, attribute the zero y i e l d to p o s i t r o n trapping in the samples and Ps formation; two processes that have s ubsequently been shown to be of great importance.
The first observation of slow p o s i t r o n emission from a metal surface was made by Cherry (1958) . Positrons were found to be emitted w i t h energies of less than lOeV from Cr plat e d mica when irradiated with 13'^ p articles from a ^Na source. The ratio between the number of slow positrons to fast 0+ particles was found to be around 1 0*.
time of flight technique and were found to p e a k between 0.75 and 2.90eV. It was proposed for the first time that this energy was due to a negative p ositron w o r k function of the surface. Costello et al (1972a) went on to use this flux of slow positrons to make the first p o s i t r o n - a t o m total scattering cross section measurements. This w o r k is d iscu s s e d in § 1.5.
A positron work function (#+) m a y be defined, in an analogous way to the electron work funct i o n (0.) as the m i n i m u m energy required to move a p o s i t r o n from a p oint well inside the surface to a point well outside. If 0+ is negative, positrons are ejected from the surface w ith kinetic energies approximately equal to 0+.
Lang and Kohn (1971) defined 0. as
<|)_ = A(p - \ i _ (1.7)
wh ere jii. is the bulk chemical p o tential of the electrons, relative to the mean electrostatic p o t e n t i a l in the metal interior and Acp is the rise in mean e l e c t r o s t a t i c potential across the surface. The surface dipole, A<p, is caused by the electron gas from the metal interior, spill i n g out beyo n d the last atomic layer and into the vacuum. This is shown in figure 1.9. Here the ion-core potential is r e p r e s e n t e d by a u n i f o r m background, equal to the a v e rage interstitial potential, according to the jellium model. The combined effect of this and the electron gas, w h i c h as already mentioned, spills out of the surface, creates a dipole m o ment across the surface and tends to bind elec t r o n s to the solid.
Tong (1972) p roposed that the surface dipole
c o ntribution to 0+ should have an equal m a g n i t u d e but opposite sign to A<p and hence
4)+ = -Acp - (1.8)
surface. It is the cancellation between and A<p that causes 0+ to be close to zero, or negative in many cases. The potentials a p ositron or electron sees close to a metal surface are repr e s e n t e d in figure 1.9. This shows that for a p o s i t r o n there is an attractive poten t i a l well just outside the surface. This is due to the image p o tential seen by the posi t r o n at large distances and the c o r r elation w ith the electron gas spilling out of the metal surface at small distances.
Tong (1972) predicted negative values of 0+ of a few electron-Volts for Al, Mg, Cu and Au. The w o r k function of Au has since been experimentally m e a s u r e d to be positive
(Nieminen and Hodges 1976, Lynn 1980 [unpublished]). The
e
Jellium b ackground
z
electrons
vacuum
e -e n e rg y
vacuum Level
L<p
e *e n e rg y
vacuum Level
Figure 1.9. The potentials seen by a positron and an electron near the
results of Costello et al (1972) may t h e r e f o r e be ascr i b e d to epithermal p ositron emission or sample impurities causing (f>+ to become negative.
A 300-fold improvement in m o d e r a t i o n e f f i c i e n c y was achieved by Canter et al (1972) from an Au m o d e r a t o r c o nsisting of vanes arranged in the form of a V e n e t i a n blind coated with MgO. This was bombarded w i t h fast posit r o n s from ^^Na to obtain a flux of slow positrons. The e n ergy spread of the slow positrons was around 3eV and the m o d e r a t i o n e f f iciency was approximately 3x10^. This was u s e d to meas u r e the total cross-section of He as d i s c u s s e d in § 1.5.
An alternative method of slow p o s i t r o n beam produ c t i o n was developed by Stein at al (1974) . A B t a rget was b o mbarded w i t h 4.75MeV protons from a Van de Graff g e n e r a t o r to produce positrons from the decay of "c, p r o d u c e d by the reaction ^^B(p,n)'*C. The B target also acted as the m o d e r a t o r and
positrons emitted from the surface w e r e extracted
electrostatically, with an energy spread of around O.leV. The efficiency of this type of moderator was e s t i m a t e d to be around 10^. These slow positrons were u s e d to m a k e the first observation of a R a msauer-Townsend m i n i m u m in p ositron elastic scattering cross-sections, as d i s c u s s e d in § 1.5.
Further study of the moderation p r o p e r t i e s of various p oly- c r y s t a l l i n e moderators was carried out by P endyala et al (1976). An increase in slow posit r o n y i elds after heat treatment was reported, with the h i g hest y i e l d o btained from Cu after baking at 4 50K for several hours.
me a s u r e d by detection of the a n n i h ilation 7-rays and the energy spectrum of the slow positrons was d e t e r m i n e d by recording the annihilation rate as a function of a negative potential applied to the target. The energy d i s t r i butions were measu r e d for different target tempe r a t u r e s up to 500°C. Mills et al (1978) p roposed the following m e c h a n i s m for the thermalisation, diffusion and emission of p o sitrons from m e t a l s .
A f t e r implantation in a m o derator material, p a rticles with energies less than a few MeV m a y initially lose kinetic energy to electrons in the bulk of the solid by inelastic processes such as core excitation, p l a s m o n emission and electron-hole pair creation. Niem i n e n and Oliva (1980) e stimated that such positrons w ould have reac h e d energies of
a few eV after around lO'^s. After this, near-thermal
equilibrium with the lattice is achieved, p r e d o m i n a n t l y by p honon scattering in around 10‘^^s (Perkins and Carbotte 1970) . A typical non-thermal p ositron will diffuse about 30Â in this
time. Therefore, positrons impacting the surface w ith
energies in the keV range, will t h e rmalise before r eaching the surface, since the mean implantation depth will be of the order of 100Â (Mills et al 1978) . At the surface the surviving positrons may form Ps, become t r a p p e d in a surface state, be reflected or, if the surface has a n egative be ejected into the vacuum.
M u r r a y and Mills (1980) m e a s u r e d the m o d e r a t i o n efficiency of Cu and Al as a function of 0 + by v a r y i n g the crystal orientation and the amount of S on the surface. The result for Cu is shown in figure 1.10, showing an increase in efficiency as 0+ is m a d e more negative.
2 0.4
1.2
0 0.4 0.6
p *(e V )
e. A, ■ Experimental
----, --- Theoretical
Figure 1.10. The slow positron yield from a Cu surface as a function of
<p+ (Murray and Mills 1980) .
annealing increases the degree of atomic order in the moderator. This causes there to be fewer defects w hich may act as positron traps (as ment i o n e d in § 1.3).
Using a clean, single crystal W sample, V e h a n e n at al (1983) obtained a m o d e r a t i o n effi c i e n c y of around 3x10^, which is around 75% the m a x imum p o s s i b l e efficiency, as calculated by V e h a n e n and M a k i n e n (1985).
e*
—
>
\ / \ /\
X / .
_
/\/
— />(a)
(b)
e*
(c)
(d)
Figure 1.11. Typical source/moderator arrangements showing a)
backscattering b) vane c) grid and d) transmission configurations.
of the flux. Figure l.lld) shows the trans m i s s i o n m ode g e o m e t r y in w h ich positrons diffuse t h r o u g h moder a t o r s of thickness of a few thousand Â. This confi g u r a t i o n results in na r r o w energy and angular distributions and simplifies e lec t r o n optics since the input and output may be e lectrically screened.
All the m o deration techniques descr i b e d above use
negative work function materials. However, new high
e f f iciency moderators have been deve l o p e d based on mater i a l s p o s s e s s i n g positive values of these are the solid rare gas (RGS) and field assisted (FA) RGS moderators.
Mills and Gullikson (1986) c o ndensed Ne, Ar, Kr and Xe onto a cup type m oderator and m e a s u r e d the y i eld of slow positrons. Ne was found to be the m ost efficient m o d e r a t o r at around 7x10^. In this case, the energy distr i b u t i o n of the r e - emitted positrons was around O.SSeV FWHM. The high e f f iciency is attributed to the wide band gap, in terms of the "hot positron" model. Here an implanted posit r o n may lose k inetic energy by inelastic processes, until r eaching the band gap. Then the only means of energy loss is via p h onon excitation. Since the m a x imum energy for phonon e x citation is small (e.g. 83xl0^eV for Ar, Schwentner et al 1975) the d i ffusion length before t h e r malisation is increased. Hence, a significant number may reach the surface w ith energies in excess of 0+ and be re-emitted into the vacuum.
M err i s o n et al (1992) increased the e f f iciency of solid Ar and Kr moderators by a factor of around 3, by covering the RGS w ith a thin layer of O2 and charging the surface by low e ner g y electron bombardment. The enhanced yield was ascribed to the effect of the electric field on bulk d i f f u s i o n and surface properties.
B{E) = ---- = constant (1.9)
Esin^Q
w h ere B(E) is the brightness per unit energy and E, I, d and 6 are the energy, intensity, diameter and angular divergence of the beam respectively. Hence, for a constant beam energy and intensity, d may only be reduced by increasing 6 and vice-versa. M i l l s (1980) pointed out that the constraints of equation 1.9 do not apply to the m o d e r a t i o n process since it is n o n - c o n s e r v a t i v e and that by focusing a beam onto smaller areas in succe s s i v e stages of re-moderation, B(E) m a y be increased several orders of magnitude, with relatively small loss in intensity.
The first b r ightness enhanced b eam was constructed by
Frieze et al (1985) who succeeded in increasing the
brightness of a p o s i t r o n beam by around 3 0 times, with a loss
in intensity of around 80%. A more recent apparatus
implemented by Brandes at al (1988) has increased B(E) by a factor of 500 and was used to produce a scanning positron micro-beam. This beam was focused to d i mensions of around (10 X 50)jLtm and was scanned across a test grid while moni t o r i n g the intensity of annihilation radiation. This intensity, meas u r e d as a funct i o n of beam position, was used to generate a 1-D image of the grid.
1.5 Positron-Atom(Molecule) Cross-Sections
W i t h the advent of tunable beams of low energy positrons it soon became p o s s i b l e to investigate positron-atom(molecule) interactions u n d e r single collision regimes and at specified energies. T oday t h ese studies include partial cross-sections
for a number of scattering channels, some differential
investigations of elastic scattering and ionisation
1.5.1 Total Cross-Sections
The first positron-atom(molecule) c r o s s - s e c t i o n s to be m easured were total cross-sections (QJ . Experiments to measure Qt usually involve measu r i n g the a t t e n u a t i o n of a beam of particles of well defined energies, p a s s i n g through a region containing the target gas. Under ideal conditions, Q, can be obtained from the Beer-Lambert expre s s i o n
= (1-10)
where I and Iq are the transmitted (unscattered) and incident beam fluxes r e s p e ctively and n is the n u mber dens i t y of the gas along an interaction region of length 1.
The most significant systematic errors are usua l l y those involved in determining n, 1 and I, since n depends on the target gas temperature and pressure and m a y v a r y along the interaction region, 1 may be difficult to d e termine due to spiralling and end effects and I m a y be difficult to determine because of positrons elast i c a l l y scattered through small angles. In most m easurements w i t h positrons, the attenuation (I/Iq) is either measu r e d d i r e c t l y or inferred from time of flight (TOF) measurements.
The first positron Q* m e a s urement was m a d e for He by Costello et al (1972a) using a TOF technique. W i t h improved beam fluxes, values of Qt have now been m e a s u r e d w ith higher precision, for a wide range of atomic and m o l e c u l a r gases. The first to be studied were the noble gases, since these exist in atomic form at r oom temperature. T h e s e targets have been extensively studied over a w ide range of impact energies and the level of agreement between the v a r i o u s experiments is in general, reaso n a b l y good.