https://doi.org/10.5194/npg-25-67-2018
© Author(s) 2018. This work is distributed under the Creative Commons Attribution 4.0 License.
A correlation study regarding the AE index and ACE solar
wind data for Alfvénic intervals using wavelet decomposition
and reconstruction
Fernando L. Guarnieri1, Bruce T. Tsurutani2, Luis E. A. Vieira1, Rajkumar Hajra3, Ezequiel Echer1, Anthony J. Mannucci2, and Walter D. Gonzalez1
1Instituto Nacional de Pesquisas Espaciais – INPE, São José dos Campos, SP, Brazil 2Jet Propulsion Laboratory, California Institute of Technology, Pasadena, CA, USA
3Laboratoire de Physique et Chimie de l’Environement et de l’Espace, CNRS, Orléans, France
Correspondence:Fernando L. Guarnieri ([email protected]) Received: 18 July 2017 – Discussion started: 4 August 2017
Revised: 8 November 2017 – Accepted: 9 November 2017 – Published: 31 January 2018
Abstract. The purpose of this study is to present a wavelet interactive filtering and reconstruction technique and apply this to the solar wind magnetic field components detected at the L1 Lagrange point ∼0.01 AU upstream of the Earth. These filtered interplanetary magnetic field (IMF) data are fed into a model to calculate a time series which we call AE∗. This model was adjusted assuming that magnetic reconnec-tion associated with southward-directed IMFBzis the main mechanism transferring energy into the magnetosphere. The calculated AE∗ was compared to the observed AE (auroral
electrojet) index using cross-correlation analysis. The results show correlations as high as 0.90. Empirical removal of the high-frequency, short-wavelength Alfvénic component in the IMF by wavelet decomposition is shown to dramatically im-prove the correlation between AE∗and the observed AE in-dex. It is envisioned that this AE∗can be used as the main in-put for a model to forecast relativistic electrons in the Earth’s outer radiation belts, which are delayed by∼1 to 2 days from intense AE events.
1 Introduction
Around solar maximum the major causes of geomagnetic storms and space weather disturbances on Earth are inter-planetary coronal mass ejections (ICMEs), especially mag-netic clouds (MCs), and their sheath or shocked fields (Gon-zalez et al., 2007; Echer et al., 2011). However, during the de-scending and minimum solar cycle phases, high-speed solar
wind streams (HSSs) become the dominant interplanetary– heliospheric structure, causing geomagnetic activity on Earth (Sheeley et al., 1976; Tsurutani and Gonzalez, 1987; Tsu-rutani et al., 1995, 2006; Guarnieri, 2006; Guarnieri et al., 2006; Kozyra et al., 2006; Turner et al., 2006; Gonzalez et al., 2007; Echer et al., 2011; Hajra et al., 2013). The fea-tures within the HSS causing geomagnetic activity are large-amplitude Alfvén waves (Belcher and Davis, 1971; Tsurutani et al., 1982, 1990, 2011a, b; Echer et al., 2011; Hajra et al., 2013), the southward component of which leads to intermit-tent magnetic reconnection between the wave magnetic fields and the magnetopause fields, allowing the transfer of energy and momentum from the solar wind to the magnetosphere (Dungey, 1961).
The Alfvén waves causing the geomagnetic (AE index) activity have short wavelengths, ranging from ∼2×10⁵to 2×10⁶km (∼10 min to ∼2 h in duration convected in a 400 km s−1solar wind), much smaller than ICME and MC scales. The direct use of the IMFBzat the L1 libration point during such structures results in poor correlation against the AE on Earth (Tsurutani et al., 1990, 1995, Guarnieri, 2005). It is thought that part of the problem is that Alfvén waves are propagating in the solar wind, and what is detected at the L1 point is not what hits the Earth’s magnetosphere. Another possibility is that the high-frequency wave power does not contribute to the solar wind energy transfer process.
A second incentive for better understanding the relation between interplanetary structures and the AE indices is that intense AE activity events called HILDCAAs (Tsurutani and Gonzalez, 1987) have been shown to be indirectly re-lated to the production of relativistic electrons in the Earth’s magnetosphere (Hajra et al., 2014, 2015a, b). In particular Hajra (2015a) showed that HILDCAA onsets precede rel-ativistic ∼0.6 MeV electron acceleration by ∼1 day and
∼4.0 MeV electron acceleration by∼2 days. These HILD-CAA events are well correlated with the presence of Alfvén waves within HSS (Tsurutani and Gonzalez, 1987; Gonza-lez et al., 1994), and the intensity of the geomagnetic event depends on the amplitude of the negativeBz component of the magnetic field of these waves (Guarnieri, 2005, 2006; Guarnieri et al., 2006).
The overall picture of relativistic electron acceleration in the magnetosphere is the following: reconnection be-tween the southward component of the Alfvén waves and the Earth’s dayside magnetopause field (Dungey, 1961; Gonza-lez and Mozer, 1974; Tsurutani et al., 1995) leads to sub-storms and convection events and injections of energetic electrons into the nightside region of the outer magneto-sphere (DeForest and McIlwain, 1971; Horne and Thorne, 1998). The energetic electron component creates electromag-netic chorus waves through the loss cone instability (Tsuru-tani and Smith, 1977; Meredith et al., 2001; Tsuru(Tsuru-tani et al., 2013). Then the chorus accelerates the high-energy electrons to relativistic energies by resonant interactions (Inan et al., 1978; Horne and Thorne, 1998; Thorne et al., 2005, 2013; Summers et al., 2007; Reeves et al., 2013; Boyd et al., 2014; Hajra et al., 2015a).
The acceleration of relativistic electrons within the Earth’s outer radiation belt (Paulikas and Blake, 1979; Baker et al., 1986) is an important physical phenomenon in space weather. These electrons are also known as “killer electrons” for their hazardous effects to orbiting spacecraft (Wrenn, 1995; Horne, 2003). Recent studies by Hajra et al. (2013, 2014, 2015a, b) indicate the probability that magnetospheric relativistic electron acceleration may be predicted more than 1 day in advance using ground-based observations of auroral activities during HSS.
This paper describes a correlation analysis using a tech-nique of wavelet decomposition and selective reconstruction
applied in both IMF solar wind data and AE index. The re-sults of this technique may allow us, in the future, to develop a more complete model to forecast the occurrence of rela-tivistic electrons during periods with Alfvénic fluctuations in the interplanetary solar wind.
2 Methodology
Interplanetary magnetic field and solar wind parameters ob-tained from the ACE (Advanced Composition Explorer) spacecraft (Stone et al., 1998) were used in this work. This data set has∼1 min resolution, and we have used the level 2 processed data. IMF vector data used in this work are in the GSM coordinate system. The ACE spacecraft is located at the L1 libration point,∼1.5 million km from the Earth, or-biting a region around the Sun–Earth line. The data are avail-able online at http://www.srl.caltech.edu/ace.
The geomagnetic activity was observed through the AE indices (Sugiura and Davis, 1966) and Dst index (Rostoker, 1972). These indices are available through the World Data Center for Geomagnetism, Kyoto (http://wdc.kugi.kyoto-u. ac.jp). The AE and Dst indices have 1 min and 1 h time res-olutions, respectively. The AE index was used to identify the periods of enhanced auroral electrojet activity, while the Dst index was used only to ensure that the analysed inter-vals were not occurring during the main phases of magnetic storms.
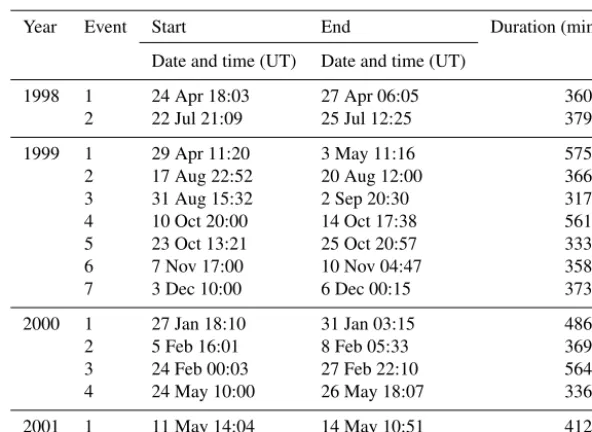
For this study, we used a set of 14 geoeffective interplane-tary HSS events, previously identified by Guarnieri (2005) as the longest-lasting elevated AE index events spanning 1998– 2001. Table 1 shows a listing of these events with the year, event start date and time, event end date and time, and event duration (in minutes). The Alfvénicity of the solar wind for these intervals was verified using the classical technique pro-posed by Belcher and Davis (1971) (i.e. these elevated AE intervals are associated with high-speed stream solar wind origin).
A filtering process adapted from the Meyer wavelet de-composition and reconstruction was employed in this tech-nique. This procedure allows a decomposition of the signal into bands with periods in multiples of 2n of the data ca-dence (1 min), withn=1, 2, 3, . . . Each decomposed band is called a “detail” and represented by Dn, wheren repre-sents the decomposition level. Table 2 shows each decompo-sition level Dn, the leveln, the associated period (2n), and the period range in minutes. More details about this technique can be found in Meyer (1993) and Kumar and Foufoula-Georgiou (1997).
de-Table 1.Long-lasting AE events occurred between years 1998 and 2001 (Guarnieri, 2005).
Year Event Start End Duration (min)
Date and time (UT) Date and time (UT)
1998 1 24 Apr 18:03 27 Apr 06:05 3603 2 22 Jul 21:09 25 Jul 12:25 3797
1999 1 29 Apr 11:20 3 May 11:16 5757 2 17 Aug 22:52 20 Aug 12:00 3669 3 31 Aug 15:32 2 Sep 20:30 3179 4 10 Oct 20:00 14 Oct 17:38 5619 5 23 Oct 13:21 25 Oct 20:57 3337 6 7 Nov 17:00 10 Nov 04:47 3588 7 3 Dec 10:00 6 Dec 00:15 3736
2000 1 27 Jan 18:10 31 Jan 03:15 4866 2 5 Feb 16:01 8 Feb 05:33 3693 3 24 Feb 00:03 27 Feb 22:10 5648 4 24 May 10:00 26 May 18:07 3368
2001 1 11 May 14:04 14 May 10:51 4128
Table 2.Decomposition levels and the corresponding periods range for each level used in the wavelet decomposition technique.
Level n Range (minutes)
D1 1 < 2
D2 2 2–4
D3 3 4–8
D4 4 8–16
D5 5 16–32 D6 6 32–64 D7 7 64–128 D8 8 128–256 D9 9 256–512 D10 10 512–1024 A10 – > 1024
tails of higher orders are so smoothed that they are not useful for the AE evaluation.
If two or more details are taken and added the time se-ries, this will result in an “approximation”, which can be considered as a band pass filter. Taking the A10 level and adding it to D10 will result in approximation A9, and so on (An−1=An+Dn). In this way, the A0 level will be exactly the same as the original signal, since it contains all the de-composition levels. The reconstruction is an interactive pro-cess that can be started and stopped at any decomposition level.
A computer routine was developed to adjust the param-eters of the empirical equations for the calculated AE. Af-ter the adjustments, the model was fed with the filAf-tered IMF and solar wind data time series. The calculated AE for each
event was compared to the real geomagnetic index observed to check the correlation among them.
3 Results and discussion
Preliminary tests were performed using the cross-correlation analyses between the AE index and several interplanetary pa-rameters, such as|B|,Bx,By,Bz,Vsw, andNp, as was done previously by Guarnieri (2005). TheBzmagnetic field com-ponent was found to be the parameter most related to the au-roral activity. For this reason, the attempts to adjust a func-tion describing the AE index were mostly focused on this IMF component.
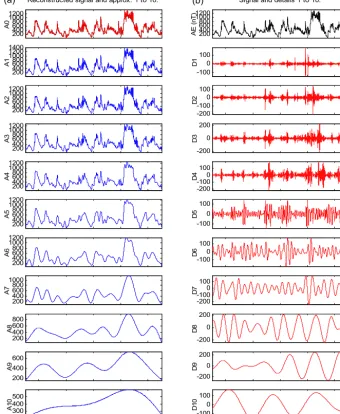
The wavelet decomposition technique was applied in both the AE index and the IMFBzcomponent. Figure 1 shows an example of wavelet decomposition and reconstruction for the AE index. The top right panel shows the AE time series. The panels in the right side are the “details”, identified by D1 to D10 (see Table 2 for the corresponding range of each detail). Periods longer than 1024 min plus the average value of the data series are in the A10 level, shown in the bottom panel, left side. The panels in the left side are the “approximations”, which can be viewed as a cumulative sum of details.
Since the high-speed solar wind events are characterized by enhanced AE activity, the higher approximation levels (such as A8, A9, and A10) present increasingly averaged val-ues.
115 115.5 116 116.5 117 300 400 500 A 10
115 115.5 116 116.5 117 -100 0 100 D 10 200 400 600 800 1000 1200 A E ( nT )
Signal and details 1 to 10.
200 400 600 800 1000 1200 A 0
Reconstructed signal and approx. 1 to 10.
200 400 600 800 1000 1200 1400 A 1 -100 0 100 D 1 200 400 600 800 1000 1200 A 2 -200 -100 0 100 D 2 200 400 600 800 1000 1200 A 3 -200 0 200 D 3 200 400 600 800 1000 1200 A 4 -200 -1000 100 D 4 200 400 600 800 1000 1200 A 5 -100 0 100 D 5 200 400 600 800 1000 1200 A 6 -1000 100 D 6 200 400 600 800 1000 A 7 -200 -1000 100 D 7 200 400 600 800 A 8 -200 0 200 D 8 200 400 600 A 9 -200 0 200 D 9 (a) (b)
Figure 1.Wavelet decomposition of the AE index for event 1_1998. The right side shows the “details” (bands) and the left side shows the “approximations” (reconstructions).
Guarnieri (2005), through the calculation of average values ofBzduring HSS intervals.
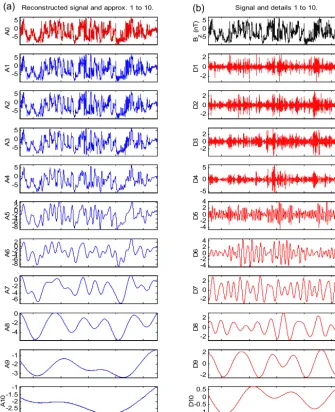
Comparing Figs. 1 and 2, an anti-correlation in level A10 is clearly observable. This same behaviour is also present in other approximation levels. This anti-correlation shows that AE activity is driven by the −Bz on these long timescales during the Alfvénic intervals.
Previous work (Guarnieri, 2005) had observed that high frequencies in the signal could hide or decrease the corre-lation between solar wind parameters and geomagnetic in-dices, because of the presence of noisy, turbulent activity. So, an approximation level has to be chosen in order to avoid these high frequencies and, at the same time, be able to repre-sent the particularities of the signal. With a computer routine,
115 115.5 116 116.5 117 -2.5-2 -1.5 -1 A 10
115 115.5 116 116.5 117 -1 -0.5 0 0.5 D 10 -5 0 5 Bz ( nT )
Signal and details 1 to 10.
-5 0 5
A
0
Reconstructed signal and approx. 1 to 10.
-5 0 5 A 1 -2 0 2 D 1 -5 0 5 A 2 -2 0 2 D 2 -5 0 5 A 3 -20 2 D 3 -5 0 5 A 4 -5 0 5 D 4 -8 -6 -4 -20 2 4 A 5 -4 -20 2 4 D 5 -8 -6 -4 -20 2 A 6 -4 -20 2 4 D 6 -6 -4 -20 A 7 -2 0 2 D 7 -4 -2 0 A 8 -2 0 2 D 8 -3 -2 -1 A 9 -2 0 2 D 9 (a) (b)
Figure 2.Wavelet decomposition on the interplanetary magnetic fieldBz component for event 1_1998. The right panels show the details (bands) and the left panels show the approximations (reconstructions).
performed in both ACE and IMP-8 data. There was no clear correlation employing unfiltered data and even the lag be-tween the two time series showed inconclusive results. Pro-gressively removing the high frequencies lead to correlation increases and the lag between time series becomes more con-sistent. The values obtained for correlation were in the range from∼0.5 to∼0.8. The lowest values were related to events with the presence of “patches” of different periodicities in Bz. This behaviour exposes a limitation of the classical cor-relation techniques in dealing with time-located periodicities. Once we verified the good correlation betweenBzand AE, an empirical model was developed to estimate a time series (here called AE∗) based on interplanetaryBzand compare it against the observed AE index.
The first assumption for this empirical model is that re-connection is the main physical process transporting energy from the solar wind into the magnetosphere (and later to the auroral region). In this way, whenBzis negative we would have energization of the auroral electrojets. PositiveBz inter-vals implies that there is no energy input from the solar wind to the magnetosphere, and thus for these intervals a decay function is used to estimate the auroral current decay.
The calculation and modelling process starts with the in-terplanetaryBz measured at L1 (Bz_interp), shifted in time to take into account the interplanetary structure travel time from the L1 libration point to the Earth, using the solar wind velocity as a proxy.Bzis the shifted time series andδ is the delay applied:
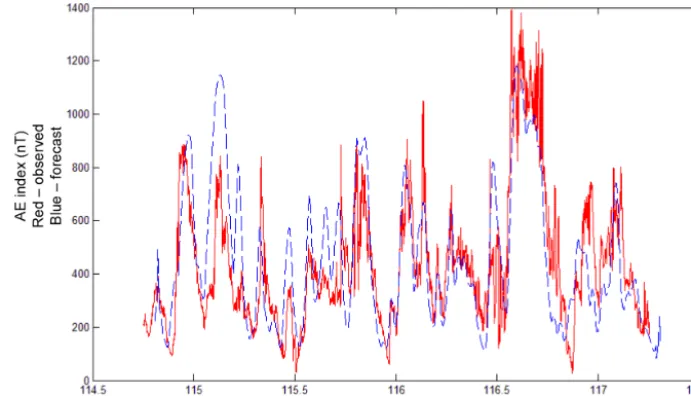
Figure 3.Comparison between the calculated AE∗(dashed blue line) and the real AE index (solid red line) for event 1_1998.
Bzis then decomposed and reconstructed up to the approx-imation level desired to eliminate high frequencies, creating theBz∗time series (approximation for the shiftedBz).
The field change is calculated as follows:
1Bz∗(t )=Bz∗(t )−Bz∗(t−1). (2) The first item of ae∗is assumed to be−Bz∗(where ae∗ rep-resents the calculated index before scale and baseline adjust-ments).
If Bz∗
(t )≤B
∗
z(t−1), then the Bz is getting smaller or more
negative, leading to energization:
ae∗(t )=ae∗(t−1)+ε·1Bz∗(t ). (3) IfBz∗
(t )>B ∗
z(t−1), then the following is true:
ae∗(t )=ae∗(t−1)exp(−γ Bz∗(t )). (4) Finally, the scale and baseline are adjusted in the calculated series:
AE∗=α+(β·ae∗), (5)
where AE∗ is the approximation for the AE index time se-ries. A computational routine was developed to adjust the parameters α,β,ε, and γ. The best results were achieved withα=70 nT,β=150,ε= −0.3333, andγ=1. The de-lay δ(in Eq. 1) depends on the solar wind velocity and the shifting method employed. It is in the range of 30–70 min.
Figure 3 shows a comparison between this calculated AE∗ (blue line) and the observed AE index (red line). The recon-structions were created up to the level A4, meaning that only periods longer than 8 min are present.
There is a good correlation between the two series (calcu-lated and observed), although there are still some scale prob-lems. However, some particularities of the real signal were
represented very well by the calculated signal. This event was chosen due to the presence of unambiguous features, such as those occurring at day∼116 and the big peak just after day 116.5. These features were used to test the accuracy of the model under unusual conditions.
A comparison among all the events and calculated time se-ries using different approximation levels is shown in Table 3. The data shown in this table are correlation coefficients be-tween the calculated AE∗and the observed AE index.
Considering the A3 approximation level, all the events have correlation coefficients higher than 0.7. With the ex-clusion of events ev1_2000 and ev3_2000, all of the remain-ing 12 events have correlation coefficients higher than 0.85. Event 3_1999 has correlation coefficients larger than 0.958 for all the approximation levels.
Regarding events ev1_2000 and ev3_2000, the low corre-lation coefficients observed led us to reanalyse the data plots to understand what would be the main difference between these events and the remaining ones. TheBz data for these two events are basically high-frequency oscillations around a∼0 nT value, without the longer-period excursions to neg-ative Bz values typically associated with AE energization. These high frequencies are exactly those mostly removed by the wavelets filtering technique we employed here, leading to a weak correlation against the AE index. Similar results were found by Guarnieri (2005) when analysing these exact two events, but using different techniques, and reaching the same conclusion.
Table 3.Correlation coefficients between the calculated (AE∗) and the observed (AE index) series for each event and in each wavelet decomposition approximation level.
Event A3 A4 A5 A6 A7 A8 A9
ev1_1998 0.943 0.947 0.948 0.944 0.926 0.928 0.977 ev2_1998 0.913 0.908 0.903 0.907 0.936 0.892 0.894 ev1_1999 0.920 0.920 0.926 0.924 0.931 0.920 0.946 ev2_1999 0.876 0.875 0.865 0.884 0.860 0.853 0.879 ev3_1999 0.958 0.962 0.964 0.965 0.982 0.990 0.995 ev4_1999 0.893 0.889 0.875 0.845 0.844 0.855 0.941 ev5_1999 0.918 0.922 0.915 0.904 0.912 0.901 0.943 ev6_1999 0.921 0.919 0.918 0.902 0.910 0.847 0.863 ev7_1999 0.892 0.887 0.880 0.863 0.857 0.873 0.867 ev1_2000 0.708 0.735 0.866 0.917 0.528 0.542 0.555 ev2_2000 0.856 0.859 0.872 0.891 0.900 0.878 0.890 ev3_2000 0.790 0.597 0.589 0.541 0.443 0.407 0.436 ev4_2000 0.936 0.937 0.936 0.867 0.878 0.906 0.956 ev1_2001 0.908 0.909 0.905 0.906 0.893 0.899 0.925
have poor predictive value, thus obtaining higher correlation values.
These observations lead to several possible scenarios, as shown in Fig. 4. Correlated activity between interplanetary structures and geomagnetic indices are usually related to large interplanetary structures, such as interplanetary coronal mass ejections or long-period Alfvén waves. These structures appear in interplanetary data as low-frequency waves. Due to the sizes of these structures, the Earth’s magnetosphere may react as a whole, and so the geomagnetic indices give us a good idea of the global magnetosphere energization.
However, there are events with uncorrelated activity, usu-ally those with high frequencies present in the interplanetary data, which are related to medium- and short-period Alfvén waves, that may miss impingement on the magnetosphere. There are also long-period waves that can be uncorrelated due to internal chaotic processes inside the magnetosphere. When these high-frequency events are removed by filtering IMFBzand AE index data, we are able to reach high corre-lation values such as those shown on Table 3.
Future work can implement a forecasting model for the AE index for such periods with high-amplitude Alfvénic fluctu-ations. One has to use the real-time data from a spacecraft around L1 and verify the Alfvénicity through the technique employed by Belcher and Davis (1971). Once the Alfvénicity is verified, the data series would be fed in through the wavelet filtering and the AE∗evaluation equations. This would give us a forecasted AE with a delay of only a few minutes, or al-most a “nowcast”. However, the main result would be the rel-ativistic electron forecasting. Since Hajra et al. (2013, 2014, 2015a, b) have shown the probability that magnetospheric relativistic electron acceleration may be predicted by more than 1 day in advance using ground-based observations of auroral activities during high-speed solar wind streams, the ability to obtain an equivalent auroral index may lead to a
Figure 4.Schematic showing the possible causes for correlated and uncorrelated events between interplanetary parameters and geomag-netic indices.
4 Conclusions
A method to calculate an AE∗ time series based on IMF data measured at L1 in the presence of interplanetary Alfvén waves was developed. This method employs an Alfvénicity check and a wavelet decomposition technique, which is ap-plied to the interplanetary magnetic fieldBzcomponent. This calculated AE∗was shown to be highly correlated with the observed AE index. The correlation coefficients between the calculated and observed series can reach values over 0.90, depending on the resolution and the level of details assumed. Future works can use data from the any other spacecraft located around L1 to feed the model and obtain the AE∗, and this AE∗ feeds a routine to predict the occurrence of rela-tivistic electrons, giving advanced notice by more than a day. This work will hopefully be completed within the next few years.
5 Final comments
Although correlations between AE∗and AE as high as 0.90 have been indicated in this paper, the causes for the lack of a high correlation in some intervals are still in question. One possibility is that there is high-frequency turbulence in the solar wind which is not geoeffective, a point mentioned pre-viously. However there is another, recently discussed possi-bility: local generation of Alfvén waves in the interplanetary medium (Tsurutani et al., 2018). If Alfvén waves are gener-ated between ACE and the Earth, this would naturally reduce the correlation between AE∗and AE. This may account for intervals where AE∗and AE are not well correlated. Both of these explanations are possible. In the future we will probe which of these two (or other possibilities) are factors, and which are the dominant ones.
Data availability. ACE spacecraft data is available at http://www. srl.caltech.edu/ace (ACE, 2007). Geomagnetic data (AE and Dst indices are available at http://wdc.kugi.kyoto-u.ac.jp/ (World Data Center for Geomagnetism, 2007).
Competing interests. The authors declare that they have no conflict of interest.
Special issue statement. This article is part of the special issue “Nonlinear Waves and Chaos”. It is a result of the 10th International Nonlinear Wave and Chaos Workshop (NWCW17), San Diego, United States, 20–24 March 2017.
Acknowledgements. The author Fernando L. Guarnieri would like to thank FAPESP (Brazil) projects 04/14784-4 and 2007/01449-4. Ezequiel Echer would like to thank the Brazilian CNPq PQ
302583/2015-7 agency for financial support. The work of Rajku-mar Hajra was supported by ANR under the financial agreement ANR-15-CE31-0009-01 at LPC2E/CNRS. The authors would also like to acknowledge the ACE team for providing the data used in this work (http://www.srl.caltech.edu/ace), and the World Data Center for Geomagnetism, Kyoto, for the geomagnetic indices. Portions of this research were performed at the Jet Propulsion Laboratory, California Institute of Technology under contract with NASA. Sponsorship of the Heliophysics Division of NASA’s Science Mission Directorate is gratefully acknowledged.
Edited by: Annick Pouquet
Reviewed by: Francesca Di Mare and one anonymous referee
References
ACE (Advanced Composition Explorer): MAG/SWEPAM Data: available at: http://www.srl.caltech.edu/ace (last access: 20 De-cember 2017), 2007.
Baker, D. N., Blake, J. B., Klebesadel, R. W., and Higbie, P. R.: Highly relativistic electrons in the Earth’s outer magnetosphere: 1. Life-times and temporal history 1979–1984, J. Geophys. Res., 91, 4265–4276, https://doi.org/10.1029/JA091iA04p04265, 1986.
Belcher, J. W. and Davis Jr., L.: Large Amplitude Alfvén waves in the interplanetary medium, J. Geophys. Res., 76, 3534, https://doi.org/10.1029/JA076i016p03534, 1971.
Boyd, A. J., Spence, H. E., Claudepierre, S. G., Fennell, J. F., Blake, J. B., Baker, D. N., Reeves, G. D., and Turner, D. L.: Quanti-fying the radiation belt seed population in the March 17, 2013 electron acceleration event, Geophys. Res. Lett., 41, 2275–2281, https://doi.org/10.1002/2014GL059626, 2014.
DeForest, S. E. and McIlwain, C. E.: Plasma clouds in the magnetosphere, J. Geophys. Res., 76, 3587–3611, https://doi.org/10.1029/JA076i016p03587, 1971.
Dungey, J. W.: Interplanetary magnetic field and the auroral zones, Phys. Rev. Lett., 6, 47–48, https://doi.org/10.1103/PhysRevLett.6.47, 1961.
Echer, E., Tsurutani, B. T., Gonzalez, W. D., and Kozyra, J. U.: High speed stream properties and related geomagnetic activity during the whole heliosphere interval (WHI): 20 March to April 2008, Solar Phys., 274, 303–320, https://doi.org/10.1007/s11207-011-9739-0, 2011.
Gonzalez, W. D. and Mozer F. S.: A quantitative model for the potential resulting from reconnection with an arbitrary inter-planetary magnetic field, J. Geophys. Res., 79, 4186–4194, https://doi.org/10.1029/JA079i028p04186, 1974.
Gonzalez, W. D., Joselyn, J. A., Kamide, Y., Kroehl, H. W., Ros-toker, G., Tsurutani, B. T., and Vasyliunas, V. M.: What is a geo-magnetic storm? J. Geophys. Res., 99, 5771–5792, 1994. Gonzalez, W. D., Tsurutani, B. T., and Clúa de Gonzalez, A. L.:
Interplanetary origin of geomagnetic storms, Space Sci. Rev., 88, 529–562, 1999.
Guarnieri, F. L.: Study of the solar and interplanetary origin of long-duration and continuous auroral activity events, PhD thesis, INPE – S.J. dos Campos, SP, Brazil, February, 2005.
Guarnieri, F. L.: The nature of auroras during high-intensity long-duration continuous AE activity (HILDCAA) events: 1998– 2001, in: Recurrent Magnetic Storms: Corotating Solar Wind Streams, Geophys. Monogr. Ser., vol. 167, edited by: Tsurutani, B. T., McPherron, R., Gonzalez, W. D., Lu, G., Sobral, J. H. A., and Gopalswamy, N., 235–243, AGU, Washington, DC, 2006. Guarnieri, F. L., Tsurutani, B. T., Gonzalez, W. D., Echer, E.,
Gon-zalez, A. L. C., Grande, M., and Soraas, F.: ICME and CIR storms with particular emphasis on HILDCAA events, Proceed-ings of ILWS Workshop 2006, Goa, 2006.
Hajra, R., Echer, E., Tsurutani, B. T., and Gonzalez, W. D.: Solar cycle dependence of High-Intensity Long-Duration Continuous AE Activity (HILDCAA) events, relativistic electron predictors?, J. Geophys. Res., 118, 5626–5638, https://doi.org/10.1002/jgra.50530, 2013.
Hajra, R., Tsurutani, B. T., Echer, E., and Gonzalez, W. D.: Relativistic electron acceleration during high-intensity, long-duration, continuous AE activity (HILDCAA) events: solar cy-cle phase dependences, Geophys. Res. Lett., 41, 1876–1881, https://doi.org/10.1002/2014GL059383, 2014.
Hajra, R., Tsurutani, B. T., Echer, E., Gonzalez, W. D., and Santo-lik, O.: Relativistic (E > 0.6, > 2.0, and > 4.0 MeV) electron ac-celeration at geosynchronous orbit during high-intensity, long-duration, continuous AE activity (HILDCAA) events, Astrophys. J., 799, 39–46, 2015a.
Hajra, R., Tsurutani B. T., Echer, E., Gonzalez, W. D., Brum, C. G. M., Vieira, L. E. A., and Santolik, O.: Relativistic electron acceleration during HILDCAA events: are precursor CIR magnetic storms important? Earth Planets Space, 67, 109, https://doi.org/10.1186/s40623-015-0280-5, 2015b.
Horne, R. B.: Rationale and requirements for a European space weather programme, in Proceedings of ESA Workshop, ESTEC, Noordwijk, the Netherlands, 2003.
Horne, R. B. and Thorne, R. M.: Potential waves for rel-ativistic electron scattering and stochastic acceleration dur-ing magnetic storms, Geophys. Res. Lett., 25, 3011–3014, https://doi.org/10.1029/98GL01002, 1998.
Inan, U. S., Bell, T. F., and Helliwell, R. A.: Nonlinear pitch angle scattering of energetic electrons by coherent VLF waves in the magnetosphere, J. Geophys. Res., 83, 3235–3253, 1978. Kozyra, J. U., Crowley, G., Emery, B. A., Fang, X., Maris, G.,
Mlynczak, M. G., Niciejewski, R. J., Palo, S. E., Paxton, L. J., and Randall, C. E.: Response of the Upper/Middle Atmosphere to Coronal Holes and Powerful High-Speed Solar Wind Streams in 2003, in: Recurrent Magnetic Storms: Corotating Solar Wind Streams, Geophys. Monogr., vol. 167, edited by: Tsurutani, B. T., McPherron, R. L., Gonzalez, W. D., Lu, G., Sobral, J. H. A., and Gopalswamy, N., p. 319, Am. Geophys. Univ. Press, Washington DC, 2006.
Kumar, P. and Foufoula-Georgiou, E.: Wavelet analysis for geo-physical applications, Reviews in Geophysics, 35, 385–412, 1997.
Meredith, N. P., Horne, R. B., and Anderson, R. R.: Substorm de-pendence of chorus amplitudes: implications for the accelera-tion of electrons to relativistic energies, J. Geophys. Res., 106, 13165–13178, 2001.
Meyer, Y.: Wavelets and Operators, Cambridge Univ. Press, New York, 1993.
Paulikas, G. and Blake, J. B.: Effects of the solar wind on mag-netospheric dynamics: Energetic electrons at the synchronous orbit, in: Quantitative Modeling of Magnetospheric Processes, Geophys. Monogr. Ser., vol. 21, edited by: Olsen, W., 180–202, AGU, Washington, DC, 1979.
Reeves, G. D., Spence, H. E., Henderson, M. G., Morley, S. K., Friedel, R. H. W., Funsten, H. O., Baker, D. N., Kanekal, S. G., Blake, J. B., Fennell, J. F., Claudepierre, S. G., Thorne, R. M., Turner, D. L., Kletzing, C. A., Kurth, W. S., Larsen, B. A., and Niehof, J. T.: Electron acceleration in the heart of the Van Allen radiation belts, Science, 341, 991–994, https://doi.org/10.1126/science.1237743, 2013.
Rostoker, G.: Geomagnetic indices, Rev. Geophys., 10, 935–950, https://doi.org/10.1029/RG010i004p00935, 1972.
Sheeley, N. R., Harvey, J. W., and Feldman, W. C.: Coronal holes, solar wind streams and recurrent geomagnetic disturbances: 1973–1976, Sol. Phys., 49, 271–278, 1976.
Stone, E. C., Frandsen, A. M., Mewaldt, R. A., Chistian, E. R., Mar-golies, D., Ormes, J. F., and Snow, F.: The Advance Composition Explorer, Space Sci. Rev. , 86, 1–22, 1998.
Sugiura, M. and Davis, T. N.: Auroral electrojet activity index AE and its universal time variations, J. Geophys. Res., 71, 785–801, 1966.
Summers, D., Ni, B., and Meredith, N. P.: Timescale for radiation belt electron acceleration and loss due to resonant wave-particle interactions: 2. Evaluation for VLF chorus, ELF hiss, and elec-tromagnetic ion cyclotron waves, J. Geophys. Res., 112, A04207, https://doi.org/10.1029/2006JA011993, 2007.
Thorne, R. M., O’Brien, T. P., Shprits, Y. Y., Summers, D., and Horne, R. B.: Timescale for MeV electron microburst loss during geomagnetic storms, J. Geophys. Res., 110, A09202, https://doi.org/10.1029/2004JA010882, 2005.
Thorne, R. M., Li, W., Ni, B., Ma, Q., Bortnik, J., Chen, L., Baker, D. N., Spence, H. E., Reeves, G. D., Henderson, M. G., Kletzing, C. A., Kurth, W. S., Hospodarsky, G. B., Blake, J. B., Fennell, J. F., Claudepierre, S. G., and Kanekal, S. G.: Rapid local accel-eration of relativistic radiation-belt electrons by magnetospheric chorus, Nature, 504, 411–414, 2013.
Tsurutani, B. T. and Gonzalez, W. D.: The cause of high-intensity long-duration continuous AE activity (HILDCAAs): Interplane-tary Alfvén wave trains, Planet. Space Sci., 35, 405–412, 1987. Tsurutani, B. T. and Smith, E. J.: Two types of magnetospheric ELF
chorus and their substorm dependences, J. Geophys. Res., 82, 5112–5128, https://doi.org/10.1029/JA082i032p05112, 1977. Tsurutani, B. T., Smith, E. J., Anderson, R. R., Ogilvie, K. W.,
Scud-der, J. D., Baker, D. N., and Bame, S. J.: Lion Roars and non-oscillatory drift mirror waves in the magnetosheath, J. Geophys. Res., 87, 6060–6072, 1982.
Tsurutani, B. T., Gould, T., Goldstein, B. E., Gonzalez, W. D., and Sugiura, M.: Interplanetary Alfvén waves and auroral (substorm) activity: IMP-8, J. Geophys. Res., 95, 2241–2252, 1990. Tsurutani, B. T., Ho, C. M., Arballo, J. K., Goldstein, B. E., and
Balogh, A.: Large-amplitude IMF fluctuations in corotating in-teraction regions: Ulysses at midlatitudes, Geophys. Res. Lett., 22, 3397–3400, 1995.
corotating solar wind streams, in: Recurrent Magnetic Storms: Corotating Solar Wind Streams, Geophys. Monogr. Ser., vol. 167, edited by: Tsurutani, B. T., McPherron, R., Gonzalez, W. D., Lu, G., Sobral, J. H. A., and Gopalswamy, N., 1–17, AGU, Washington, DC, 2006.
Tsurutani, B. T., Echer, E., Guarnieri, F. L., and Gonzalez, W. D.: The properties of two solar wind high speed streams and related geomagnetic activity during the declining phase of solar cycle 23, J. Atmos. Sol. Terr. Phys., 73, 164–177, 2011a.
Tsurutani, B. T., Echer, E., and Gonzalez, W. D.: The solar and interplanetary causes of the recent minimum in geomag-netic activity (MGA23): a combination of midlatitude small coronal holes, low IMF BZ variances, low solar wind speeds and low solar magnetic fields, Ann. Geophys., 29, 839–849, https://doi.org/10.5194/angeo-29-839-2011, 2011b.
Tsurutani, B. T., Lakhina, G. S., and Verkhoglyadova, O. P.: Energetic electron (> 10 keV) microburst precipitation, ∼5– 15 s X-ray pulsations, chorus, and wave-particle interac-tions: A review, J. Geophys. Res.-Space, 118, 2296–2312, https://doi.org/10.1002/jgra.50264, 2013.
Tsurutani, B. T., Lakhina, G. S., Sen, A., Hellinger, P., Glassmeier, K.-H., and Mannucci, A. J.: A Review of Alfvénic Turbulence in High-Speed Solar Wind Streams: Hints from Cometary Plasma Turbulence, J. Geophys. Res., in press, 2018.
Turner, N. E., Mitchell, E. J., Knipp, D. J., and Emery, B. A.: Energetics of magnetic storms driven by corotating interaction regions: a study of geoeffectiveness, in: Recurrent Magnetic Storms, Corotating Solar Wind Streams, edited by: Tsurutani, B. T., McPherron, R., Gonzalez, W., Lu, G., Sobral, J. H. A., and Gopalswamy, N., Geophys. Monogr., 167, AGU, Washing-ton, 113–124, 2006.
World Data Center for Geomagnetism: Kyoto, AE and Dst Indices, available at: http://wdc.kugi.kyoto-u.ac.jp/ (last access: 20 De-cember 2017), 2007.