IJSRR, 7(4) Oct. – Dec., 2018 Page 787
Research article Available online www.ijsrr.org
ISSN: 2279–0543
International Journal of Scientific Research and Reviews
Implementation of Oppositional Gravitational Search Algorithm on
Arduino Through Simulink
S.M.K. Chaitanya* and P. Rajesh Kumar
*Assistant Professor in the Dept. of ECE, G.V.P. College of Engineering (Autonomous), Visakhapatnam, Andhra Pradesh 530048, India, e-mail: [email protected]. Professor in the Dept. of ECE, Andhra University College of Engineering (Autonomous),
Visakhapatnam, Andhra Pradesh 530003, India.
ABSTRACT
Ultrasound (US) imaging has been broadly utilized as part of kidney diagnosis because of its ability to show structural abnormalities like cysts, stones, and infections as well as information about kidney function. Here, the normal and abnormal kidney images are effectively classified through ultrasound imaging based on the selection of relevant features. In this study, abnormal kidney images were classified through gray-scale conversion, region-of-interest generation, multi-scale wavelet-based Gabor feature extraction, probabilistic principal component analysis-wavelet-based feature selection and adaptive artificial neural network technique. The anticipated method is executed in the working platform of MAT LAB, and is implemented on an Arduino board through Simulink. Results show that the proposed approach had 94% accuracy and 100% specificity. In addition, its false-acceptance rate is 0%, whereas that of existing methods is not <27%. This shows the precise prediction level of the proposed approach, compared with that of existing methods.
KEYWORDS:
Probabilistic Principal Component Analysis (PPCA), Oppositional Gravitational Search Algorithm (OGSA), Artificial Neural Network (ANN), K-Nearest Neighbors (KNN), Genetic Algorithm-based ANN (GA-ANN).*Corresponding author
S.M.K. Chaitanya
Assistant Professor in the Dept. of ECE,
G.V.P. College of Engineering (Autonomous),
Visakhapatnam, Andhra Pradesh 530048, India,
IJSRR, 7(4) Oct. – Dec., 2018 Page 788
INTRODUCTION
In medical imaging, any error can cause a threat to proper diagnosis; hence, accurate
identification of medical image is a difficult task. To ensure the statistical significance of studies,
sufficient amount of data from clinical trials and medical examinations has to be collected.
Collection of clinical analyses and laboratory results from electronic databases is useful for research,
medical investigations, epidemiological studies, quality control and so on 1,2. To solve complex
geometric problems arising in medical image processing, the classification method of segmentation,
shape extraction, three-dimensional (3D) modeling and registration of medical data efficient
algorithms are required.
Medical image segmentation is the basis of medical image analysis and understanding. It
plays an important role in pathology analysis and treatment and clinical diagnosis. In the imaging
process, the formation of medical image is susceptible to some factors such as noise and effect of
bias field. These factors lead to intense homogeneity in the image. In image segmentation, the
disadvantage of open-source software is that they do not support parallel image processing.
Large-scale processing leads to long computational times and high computational power requirements.
LITERATURE REVIEW
Huang et al.4 have explained the segmentation of US kidney images. Using trained prior
shapes, they employ a parametric super-ellipse as a global prior shape for a human kidney. The
Fisher–Tippett distribution was employed to describe the gray-level statistics. By combining the
gray-level statistics with a global character of a kidney shape, they used an active contour model to
segment the US kidney images. It involves two sub-problems: one was the optimization of the
parameters of a super-ellipse and the other was the segmentation of a US kidney image. An
alternating minimization scheme was used to simultaneously optimize the parameters of a
super-ellipse and segment an image.
Gunasundari et al. 5 have explained the computer-aided diagnostic system, which plays an
important role in the detection of cancer. Feature selection was an important preprocessing step in
the classification phase of the diagnostic system. The feature selection was an NP-hard challenging
problem that provides many applications in the area relevant to expert and intelligent system.
Odeh et al. 6 have proposed the use of early imaging markers to predict future renal
deterioration in infants with posterior urethral valves. Using National Institutes of Health-sponsored
image-processing software, they analyzed a series of initial postnatal US images of the serial
IJSRR, 7(4) Oct. – Dec., 2018 Page 789
parenchyma quantity and quality measured on initial postnatal US carry prognostic value by
determining future risk of stage 5 chronic kidney disease in patients with posterior urethral valves.
Subramanya et al.3 have explained a computer-aided classification system for three kidney
classes, viz. normal, medical renal disease (MRD) and cyst using mode US images. Thirty-five
B-mode kidney US images consisting of 11 normal, eight MRD and 16 cyst images have been used. A
one-against-one multi-classM support vector machine classifier has been used, which was based on
overall classification accuracy (OCA), and features from the ROIs of original images were
concatenated with the features from the ROIs of preprocessed images. Based on OCA, few feature
sets were considered for feature selection.
EXPERIMENTAL SECTION
The Oppositional Gravitational Search Algorithm (OGSA) is implemented on an Arduino
board by interfacing it through Simulink. In this work, the simulink model of the OGSA algorithm is
built by creating the target block. The output of the block gives the values of accuracy, sensitivity
and specificity after simulation. Then the values are given to the serial transmit block of the Arduino
(UNO). The output can be visualized in a digital oscilloscope.
RESULTS AND DISCUSSION
The waveforms for accuracy, sensitivity and specificity are presented below for Oppositional
Gravitational Search Algorithm (OGSA).
i.
ACCURACY:
IJSRR, 7(4) Oct. – Dec., 2018 Page 790
The value of Accuracy is 0.9375. This has to be converted into binary form whose value is
(1111)2 . This value is shown in the figure1
ii.
SENSITIVITY:
Figure2: Sensitivity Waveform Of Ogsa
The value of Sensitivity is 0.66667. This has to be converted into binary form whose value is
(1010101010101010)2 . This value is shown in the figure2.
iii.
SPECIFICITY:
IJSRR, 7(4) Oct. – Dec., 2018 Page 791
The value of Specificity is 1. So, its binary value is also 1. This value is shown in the figure3.
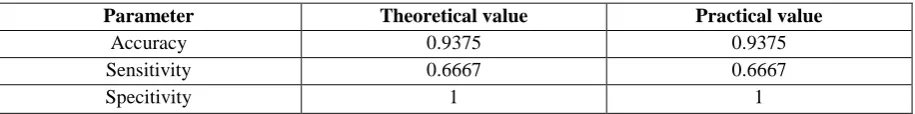
The comparison table of theoretical (Simulated using MAT lab) and practical values is shown
in below table.
Table No 1 : comparison table of theoretical (Simulated using MAT lab) and practical values
Parameter Theoretical value Practical value
Accuracy 0.9375 0.9375
Sensitivity 0.6667 0.6667
Specitivity 1 1
REFERENCES
1. A. Eklund, P. Dufort, D. Forsberg and S. M. La Conte. Medical image processing on the
GPU – past, present and future. Med. Image Anal: 2013; 17(8); 1073–1094.
2. O. Reiche, K. Häublein, M. Reichenbach, M. Schmid, F. Hannig, J. Teich and D. Fey.
Synthesis and optimization of image processing accelerators using domain knowledge. J.
Syst. Architect: 2015; 61(10); 646–658.
3. M. B. Subramanya, V. Kumar, S. Mukherjee and M. Saini. SVM-based CAC system for
B-mode kidney ultrasound images. J. Digit Imaging: 2015; 28(4); 448–458.
4. J. Huang, X. Yang, Y. Chen and L. Tang. Ultrasound kidney segmentation with a global prior
shape. J. Vis. Commun. Image Represent: 2013; 24(7); 937–943.
5. S. Gunasundari, S. Janakiraman and S. Meenambal. Velocity bounded Boolean particle
swarm optimization for improved feature selection in liver and kidney disease diagnosis. Exp.
Syst. Appl: 2016; 56; 28–47.
6. R. Odeh, D. Noone, P. Bowlin, L. H. P. Braga and A. J. Lorenzo. Predicting risk of chronic
kidney disease in infants and young children at diagnosis of posterior urethral valves: initial
ultrasound kidney characteristics and validation of parenchymal area as forecasters of renal