39
Volume LX 5 Number 1, 2012
OPERATING TESTS ANALYSIS OF LIQUID
BIOLOGICALLY DEGRADABLE WASTE
PROCESSING BY ANAEROBIC FERMENTATION
J. Fryč, T. Vítěz, T. Lošák
Recieved: December 2, 2011
Abstract
FRYČ, J., VÍTĚZ, T., LOŠÁK, T.: Operating tests analysis of liquid biologically degradable waste processing by anaerobic fermentation. Acta univ. agric. et silvic. Mendel. Brun., 2012, LX, No. 1, pp. 39–44
This study concerns the analysis of operating anaerobic fermentation systems of agricultural biogas station and implementing a suitable system enabling the use of liquid biowaste. Based on the comparison of the technological solutions and operating parameters of specifi c equipment a system enabling the utilisation of biowaste has been designed. The tests made use of liquid substrates commercially off ered to biogas station operators. The study evaluates practical measurements at an agricultural biogas station in order to evaluate the biogas production from these substrates and the effi ciency of transforming input material to usable energy. The use of such treated substrates for the anaerobic fermentation technology may have a substantial infl uence on the volume of dosed energy crops. The mixture of input substrates consisting of liquid cattle excrements, silage corn, liquid food-processing waste, animal waste and glycerine water was experimentally validated. This mixture was compared with the operation using liquid cattle excrements and silage corn. It was concluded that the proposed composition of input raw materials makes it possible to increase the production of biogas and el. power. On the other hand, it was identifi ed that the energy content of the input raw materials is not optimally transformed into usable energy. Therefore, the proposed mixture of input materials with biowaste is not recommended for use.
biogas, anaerobic fermentation, biologically degradable waste,biogas station
Input raw material for biogas stations is biomass. Energy contained in it originates from the transformation of solar energy by means of photosynthesis. In our climatic conditions, the amount of incident solar energy for the growing season is 3 000–3 600 MJ m−2. Energy effi ciency of this transformation is very low, yet the biomass represents a great potential for use as fuel (KARAS et al., 2007)
The sources of raw materials for the anaerobic fermentation technologie may be divided into two main groups in terms of their origin– waste and intentionally grown biomass (SCHULZ et al., 2004).
The intentionally grown biomass for biogas generation is represented by energy crops- mainly corn. Waste biomass is formed mainly by plant residues from agricultural production and
landscape maintenance, waste from livestock production, biologically degradable municipal waste and organic waste from industrial and food-processing plants. It is usually designated as biologically degradable waste (BDW) or biowaste.
The use of waste substrates as suitable input components results in reducing the volume of intentionally grown biomass entering the process, which also enables more effi cient operation of the anaerobic fermentation systems.
residues…) can result in the biogas yield of approx. 0.20 m3 kg−1 (LUSK, 1997).
The generated fermentation residues may be utilised as a suitable fertiliser and replace industrial fertilisers which o en have adverse characteristics (VEZIROGLU, 1991).
The objective of this study was to provide information concerning the operating use of anaerobic fermentation technologies in relation to the processing of biowaste as a suitable raw material replacing target-grown biomass. This study is a follow-up to the article (HNILICA et al., 2010) focusing on monitoring el. power generation while using various input substrates. This study therefore concentrates on comparing the quality indicators of the input material transformation to biogas or el. power.
MATERIAL AND METHODS
The validation was based on biogas production equipment designed to process liquid cattle excrements and corn silage adjusted to the biowaste use. The planned weigh ratio was 60 % liquid cattle excrements and corn silage and 40 % biowaste. In the beginning, the biogas station was operated only at 100 % substrate composition using liquid cattle excrements and corn silage. The cogeneration unit with a generator has a nominal electric output of 1 063 kW and the plant was put into service in January 2009.
The system is equipped with reinforced concrete tanks, fermentors with a capacity of 2 × 2 200 m3. All input raw materials are mixed in a stainless steel mixing tank with a capacity of 8 m3 before being fed to the fermentor. The technology also includes two stainless steel tanks receiving liquid biowaste and a glycerine storage tank.
Corn silage is dosed to the input storage tank with a volume of 80 m3. liquid cattle excrements are dosed from a collection pit with a volume of 200 m3. Substrates requiring hygienic treatment pass through the hygienisation unit installed in the operations building and are then pumped into the mixing tank. The fermentor is equipped with an integrated gas holder with a capacity of 800 m3. Mixing inside the fermentor is ensured by four propeller mixers. Desulphurisation is ensured by driving a small volume of air to the gas holder. The originated biogas is converted to electricity using a cogeneration unit generator. The emitted waste heat is used to heat up the fermentor, and agricultural and farm buildings.
The plant makes it possible to measure and record the volumes of specifi c input materials, electricity production and heat production for internal and external use, volume, temperature and pressure of originating biogas.
Two basic input materials – corn silage and liquid cattle excrements – were used for the operation and subsequent measurements. What was validated was the eff ect of adding the mixture of three diff erent
liquid input substrates Biofrit, glycerine water and animal waste (animal stomach contents). Before being fed, the input materials were mixed with the recirculation substrate. The substrate was extracted from the fermentor and fed back together with the input material. Its volume ranged from 30 %–40 % of the total volume of input substrates.
Corn silage had an average dry solids content of 32% and organic dry solids contents of 98 %. The expected biogas yield totalled 0.20 m3 kg−1.
Liquid cattle excrements had an average dry solids content of 10% and organic dry solids content of 67%. The expected biogas yield was 0.03 m3 kg−1.
Biofrit has a dry solids content of 20–25 % and organic dry solids content over 88 %. The indicated biogas yield is 0.16–0.18 m3 kg−1. This is a product coming from a specialised plant collecting waste from the food-processing industry, such as industrial kitchens, bakeries, canneries, milk-processing plants. The specifi c types of waste are stored separately and are treated, sorted or unpacked during processing resulting in a new type of waste guaranteeing a good biogas yield. The resulting product is in a liquid stage and is transportable by cisterns. On site, it is stored in stainless steel storage pits and undergoes sanitary treatment.
Glycerine water has a dry solids content of 90– 98% and the organic dry solids content exceeds 90%. The indicated biogas yield is 0.55–0.65 m3 kg−1. Glycerine water (G-stage) is a by-product of bio fuel production. It is formed by esterifi cation, when methanol and catalyst, being potassium or sodium hydroxide, are mixed with preheated rape oil. The reaction results in two phases: rape oil methylester phase and G – phase. The repeated settling in the sedimentation tank results in the separation of the two phases, which are pumped into the storage tanks and dispatched from them.
The stomach contents have the dry solids content 15–20 % and the organic dry solids content exceeds 90 %. The indicated biogas yield is 0.40–0.80 m3 kg−1. The stomach contents come from slaughterhouses and butcheries. It is a mixture of excrements, blood and parts of tissues. The transport takes place in closed boxes and storage on site is provided in a covered tank.
The selected anaerobic fermentation operation was fi rst analysed and evaluated using input raw materials without the use of biowaste. The monitoring period was selected as 26 days. Operating data was evaluated, el. power generation was recorded.
The calculation of organic dry solids load is determined as follows:
–1 –3
kg d m
100
f
c
X
m
V
, (1)where
X ...organic dry solids load [kg d−1 m−3]
m ...dry solids weight of substrate doses per unit of time [kg d−1]
c...organic dry solids content [%] Vf ...fermentor volume [m
3].
The calculation of substrate retention time is determined as follows:
d f subV T
V
, (2)
where
T ...retention time [d]
Vsub..volume of dosed substrate per unit of time [m3 d−1]
Vf ...fermentor volume [m 3].
The calculation of theoretical biogas production is determined as follows:
3 –1
1
m d
nT i i
i
Q
m q
, (3)where
QT ...theoretical biogas production [m 3 d−1] mi ....dosed substrate weight per unit of time [kg d
−1] qi ...lower limit of the indicated biogas yield [m3
kg−1].
Biogas yield utilisation coeffi cient calculation is defi ned as follows:
–
S VT
Q
k
Q
, (4)where
kv ...biogas yield utilisation coeffi cient [–] QS ....actual biogas production [m
3 d−1] QT ...theoretical biogas production [m3 d−1].
RESULTS
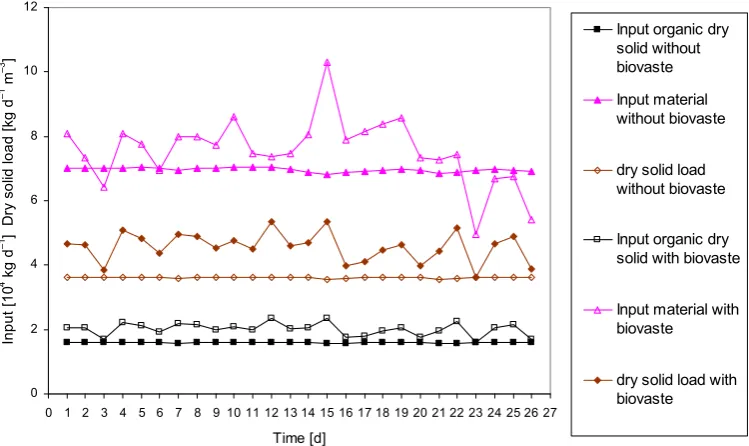
During the fi rst monitored period, substrates without adding biowaste were fed to the system. The total volume of input material, share of organic dry solids content and the dry solid load during the monitoring are shown in the chart in Fig. 1.
The average value of total volume fed into the plant was 69 595 kg d−1. The average volume of input organic dry solids content totalled 15 890 kg d−1 and the average organic solids load totalled 3.61 kg d−1 m−3. The theoretical and actual biogas production values along with el. power generated from 1 m3 of biogas are shown in the chart in Fig. 2. The average daily el. power generation amounted to 23 578 kWh. Average biogas production totalled 10 462 m3 d−1. The average value of theoretical biogas production totalled 9 827 m3 d−1. The biogas yield utilisation coeffi cient over the monitored period was 1.06. The average value of generated el. power per 1 m3 of biogas totalled 2.25 kWh and the average retention time was 55 days.
During the second monitored period, substrates with the addition of biowaste were fed to the system. The input substrate volumes are presented in Tab. I. The total volume of input material, share of organic dry solids content and the dry solid load during the monitoring are shown in the diagram in Fig. 1.
The average value of total volume fed into the plant was 75 582 kg d−1. The average volume of input organic dry solids content totalled 20 111 kg d−1 and the average organic solids load amounted to 4.94 kg d−1 m−3. The theoretical and actual biogas production values along with el. power generated from 1 m3 of biogas are shown in the diagram in Fig. 2. The average daily el. power generation amounted to 24 816 kWh. Average biogas production totalled 10 462 m3 d−1. The average value of theoretical biogas production totalled 11 761 m3 d−1. The biogas yield utilisation coeffi cient over the monitored period was 0.73. The average value of generated el. power per 1 m3 of biogas totalled 2.11 kWh m−3 and the average retention time was 52 days.
The conducted statistical analysis by t-test concluded that all measured parameters showed diff erences between the data sets without the use of biowaste compared to the use of biowaste, which were statistically signifi cant or statistically highly signifi cant.
I: Input substrate specifi cation
Substrate Daily volume without biowaste Ratio Daily volume with biowaste Ratio
kg·d−1 % kg·d−1 %
Liquid excrements 24.1·103 35 7.1·103 9
Corn silage 45.5·103 65 23.3·103 31
Biofrit 0 0 30.1·103 40
Glycerine 0 0 3.2·103 4
Animal waste 0 0 11.8·103 16
DISCUSSION
It has to be pointed out that the measurement was carried out in a commercial biogas station and certain changes occurred in the volume and composition of input materials during the monitoring. Therefore, the measurement was executed over a longer period of time and such time sequences were selected when there were minimal changed, not only over the monitoring period but also during a period preceding the measurement. When operating with the mixture of liquid excrements and silage corn, the input volume and component ratio were almost constant. When operating with added biowaste,
this could not be fully ensured and there were fl uctuations in the volume and component ratio as indicated in the diagrams presented in Fig. 1 and Fig. 2. Given the large fermentor volume (4 400 m3), small fl uctuations in the feed rate have no major impacts, which was confi rmed by minimum changes in the biogas production over the monitored period. The fi rst measurement carried out in the biogas station utilising biowaste turned clearly positive (HNILICA et al., 2010). Biogas production rose by 12.4 % and el. power generation rose by 5.4 % compared to the operation with the mixture of liquid excrements and silage corn only. However, the fermentor received a substantially larger 0
2 4 6 8 10 12
0 1 2 3 4 5 6 7 8 9 10 11 12 13 14 15 16 17 18 19 20 21 22 23 24 25 26 27 Time [d]
In
p
u
t [1
0
4 kg
d
–1 ]
Dr
y s
o
lid
lo
a
d
[
kg
d
–1 m –3 ]
Input organic dry solid without biovaste
Input material without biovaste
dry solid load without biovaste
Input organic dry solid with biovaste
Input material with biovaste
dry solid load with biovaste
1: The total volume of input material, share of organic dry solids content and the dry solid load during the monitoring
0 0,5 1 1,5 2 2,5 3
0 1 2 3 4 5 6 7 8 9 10 11 12 13 14 15 16 17 18 19 20 21 22 23 24 25 26 27
Time [d]
B
io
ga
s pr
od
uc
tion
[1
0
4 m 3 d –1 ]
E
l. p
ow
er
[k
Wh
m
–3 ]
theoret. biogas prod. with biovaste
actual biogas prod. with biovaste
el. power generated from 1 m3 of biogas with biovaste
theoret. biogas prod. without biovaste
actual biogas prod. without biovaste
el. power generated from 1 m3 of biogas without biovaste
material volume by 8.6 % more and a larger volume of organic dry solids content by 26.6 % more. This resulted in an increased average value of organic dry solids load from 3.61 kg d−1 m−3 to 4.94 kg d−1 m−3, which is a value that is still lower than as presented by some authors in professional publications (WEILAND, 1992). Likewise, the substrate retention time in the fermentor can be in both cases assessed as adequate. In the fi rst case it totalled 55 days and in the second case it totalled 52 days. The input material composition analysis and the calculation of theoretical production concluded that the biogas yield utilisation coeffi cient totalled 1.06 with the mixture of liquid excrements and silage corn. Thus, the actual biogas production value was by 6% higher than the theoretical calculated value. However, in the second case with the use of biowaste, this coeffi cient dropped to a value of 0.73. This means that the biogas production was by 28% lower than would correspond to the optimum use of input raw materials. Similar results were achieved when assessing the energy transformation of the produced biogas. While the operation using a mixture of liquid excrements and silage corn yielded on average 2.25 kWh of electric power from 1 m3 of biogas, the addition of biowaste resulted in
the decrease of this value to 2.11 kWh from 1 m3 of biogas. Therefore, it must be stated that the relevant input material mixture is not optimal and will have to be modifi ed for further operation.
CONCLUSION
The resulting energy content of individual raw materials obtained in laboratory conditions does not have to be fully utilized in actual operation. Therefore, the subject of the study was to compare the operation of a real agricultural biogas station using a mixture of liquid excrements and silage corn with the operation using biowaste. For the biogas station we designed a system enabling biowaste co-fermentation, which may be applied in most standard agricultural biogas stations. The use of biowaste resulted in the increased biogas and el. power generation. On the other hand, it was found out that the energy content of the input materials is not optimally transformed to usable energy. Therefore, the proposed mixture of input materials with biowaste is not recommended for practical use. For further operation, we propose changes in the input material composition and making an eff ort for fi nding an optimal combination of input materials.
SUMMARY
The objective is to analyse anaerobic fermentation that is not carried out under laboratory conditions but directly in an agricultural biogas station. Use was made of equipment with a hygienisation unit enabling the use of liquid biowaste. Liquid substrates commercially available to the biogas station operators were used for the tests. The biogas station was designed and operated with a mixture of 35 % liquid cattle excrements and 65 % silage corn. The mixture of input substrates was validated experimentally, consisting of 9 % liquid cattle excrements, 31 % silage corn, 40 % food-processing liquid waste, 16 % animal waste and 4 % glycerine water. The input materials were mixed with the recirculation substrate before entering the process. The substrate was extracted from a fermentor and returned together with the input material. The values of the total volume of input materials, incoming organic solids volume, theoretical and actual biogas production, biogas yield utilisation coeffi cient, el. power generation from 1 m3 of biogas, organic solids load and substrate retention time in the fermentor were compared.
If the input substrates with biowaste were used, the biogas production rose by 12.4 % and el. power generation rose by 5.4 % compared to the operation with the mixture of liquid cattle excrements and silage corn only. However, the fermentor received a substantially higher volume of material – by 8.6 % and a larger volume of organic dry solids content- by 26.6 %. This resulted in a higher average organic solids load value rising from 3.61 kg d−1 m−3 to 4.94 kg d−1 m−3. By increasing the volume of the input substrates, the substrate retention time in the fermentor dropped from 55 days to 52 days. The analysis of the input material composition and the calculation of theoretical production determined that the biogas production was 28% lower than corresponding to optima use of the input raw materials. Similar results were achieved when assessing the energy transformation of the generated biogas. While the operation using a mixture of liquid cattle excrements and silage corn resulted on average in 2.25 kWh el. power from 1 m3 of biogas, when using input substrates with biowaste this value dropped to 2.11 kWh from 1 m3 of biogas. Therefore, it must be concluded that the relevant raw material mixture is not quite optimal and must be modifi ed for further use.
Acknowledgements
REFERENCES
HNILICA, L., FRYČ, J., GRODA, B., 2010: Analýza složení a tvorby bioplynu vznikajícího při zpracování bioodpadů technologií anaerobní digesce Acta univ. agric. et silvic. Mendel. Brun., 2010, LVIII, No. 5, pp. 171–178. ISSN 1211-8516. KARAS, I., GÁLIK, R., ŠVENKOVÁ, J., 2007:
Biomasa – najväčší potenciál obnoviteľných zdrojov energie na Slovensku. In: Biomasa. Zborník príspevkov z medzinárodnej odbornej konferencie. Nitra: SPU, 2007, s. 71–75. ISBN 978-80-8069-892-8. LUSK, P., 1997: Methane Recovery from Animal Manures
A Current Opportunities Casebook. Washington:
National Renewable Energy Laboratory, p. 150, NREL/SR-580-25145, NSN 7540-01-280-5500. SCHULZ, H., EDER, B., 2004: Bioplyn v praxi. Ostrava:
Hel, p. 167. ISBN 80-86167-21-6.
VEZIROGLU, T. N., 1991: Energy and Environmental Progress I – Volume B: Solar energy Applications, bioconversation and synfuel. New York, USA, 1991, Nova Science Publishers. p. 596, ISBN 1560720018, 9781560720010.
WEILAND, P., 1992: One- and two-step anaerobic digestion of solid agroindustrial residues. In: Proc. Int. Symp. on Anaerobic Digestion of Solid Waste, Venice 14.–17. April 1992, pp. 193–199. Int. Assoc. on Wat. Poll. Res. and Control ISBN 1-900252-14-0.
Address