Neuropsychiatric Disease and Treatment 2016:12 2181–2187
Neuropsychiatric Disease and Treatment
Dove
press
submit your manuscript | www.dovepress.com 2181
O r i g i N a l r e s e a r c h
open access to scientific and medical research
Open access Full Text article
Diffusion tensor imaging in the characterization
of multiple system atrophy
aaron Michael rulseh1–3
Jiri Keller1,4
Jan rusz5,6
Michael syka1
hana Brozova6
robert rusina6,7
Petra havrankova6
Katerina Zarubova8
hana Malikova1
robert Jech6
Josef Vymazal1
1Department of radiology, Na
homolce hospital, Prague, czech republic; 2Department of radiology,
1st Faculty of Medicine, general University hospital, charles University in Prague, Prague, czech republic; 3National institute of
Mental health, Klecany, czech republic; 43rd Faculty of Medicine,
charles University in Prague, Prague, czech republic; 5Department of
circuit Theory, Faculty of electrical engineering, czech Technical University in Prague, Prague, czech republic; 6Department of Neurology
and centre of clinical Neuroscience, First Faculty of Medicine, charles University in Prague, Prague, czech republic; 7Thomayer hospital, Prague,
czech republic; 8Department of
Neurology, 2nd Faculty of Medicine, charles University in Prague, Prague, czech republic
Purpose: Multiple system atrophy (MSA) is a rare neurodegenerative disease that remains poorly understood, and the diagnosis of MSA continues to be challenging. We endeavored to improve the diagnostic process and understanding of in vivo characteristics of MSA by diffu-sion tensor imaging (DTI).
Materials and methods: Twenty MSA subjects, ten parkinsonian dominant (MSA-P), ten cerebellar dominant (MSA-C), and 20 healthy volunteer subjects were recruited. Fractional anisotropy, mean diffusivity, radial diffusivity, and axial diffusivity maps were processed using tract-based spatial statistics. Diffusion data were additionally evaluated in the basal ganglia. A support vector machine was used to assess diagnostic utility, leave-one-out cross-validation in the evaluation of classification schemes, and receiver operating characteristic analyses to determine cutoff values.
Results: We detected widespread changes in the brain white matter of MSA subjects; how-ever, no group-wise differences were found between MSA-C and MSA-P subgroups. Altered DTI metrics in the putamen and middle cerebellar peduncles were associated with a positive parkinsonian and cerebellar phenotype, respectively. Concerning clinical applicability, we achieved high classification performance on mean diffusivity data in the combined bilateral putamen and middle cerebellar peduncle (accuracy 90.3%±9%, sensitivity 86.5%±11%, and specificity 99.3%±4%).
Conclusion: DTI in the middle cerebellar peduncle and putamen may be used in the diagnosis of MSA with a high degree of accuracy.
Keywords: multiple system atrophy, diffusion tensor imaging, magnetic resonance imaging, neuroimaging, diagnostic imaging
Introduction
Multiple system atrophy (MSA) is a sporadic, progressive neurodegenerative disease characterized by autonomic dysfunction with varying degrees of parkinsonian, and/or cerebellar features. The onset of MSA is defined by the manifestation of motor dysfunc-tion occurring on average at 55 years of age and has a mean survival of 9 years.1 Two
forms of MSA are currently recognized: a parkinsonian form (MSA-P, formerly stria-tonigral degeneration) characterized by parkinsonian features poorly responsive to l-3, 4-dihydroxyphenylalanine and a cerebellar form (MSA-C, formerly olivopontocerebellar atrophy) with predominant cerebellar ataxia. Overlap between these two divisions may be evident, both clinically and histopathologically, with designation to one group determined by the predominant features at evaluation. A purely autonomic form of MSA (MSA-A, or Shy–Drager syndrome) was once considered as a possible separate entity but is not included in the current consensus criteria.1 MSA-A likely represents MSA-P/MSA-C at
an early stage of development as autonomic dysfunction is common to both.
correspondence: aaron Michael rulseh Department of radiology, Na homolce hospital, roentgenova 2, 15030 Prague, czech republic
Tel +420 257 273 200 Fax +420 257 272 604 email [email protected]
Journal name: Neuropsychiatric Disease and Treatment Article Designation: Original Research
Year: 2016 Volume: 12
Running head verso: Rulseh et al
Running head recto: Diffusion imaging in multiple system atrophy DOI: http://dx.doi.org/10.2147/NDT.S109094
Neuropsychiatric Disease and Treatment downloaded from https://www.dovepress.com/ by 118.70.13.36 on 25-Aug-2020
For personal use only.
Number of times this article has been viewed
This article was published in the following Dove Press journal: Neuropsychiatric Disease and Treatment
Dovepress rulseh et al
MSA is considered an α-synucleinopathy, and the pres-ence of glial cytoplasmic inclusions containing α-synuclein fibrils and other proteins is currently a primary requirement for definite diagnosis. Early and widespread oligodendrocyte involvement characterized by glial cytoplasmic inclusion accumulation and demyelination has been documented.2,3
As these events correlate topographically and temporally with neuronal degeneration, it has been postulated that MSA is a primary oligodendrogliopathy.4 Recently, it has been shown
that α-synuclein prions may play a role in the development of MSA.5 However, the pathogenesis remains incompletely
understood, and the diagnosis of MSA continues to be challenging.
Qualitative radiological signs may be appreciable on standard magnetic resonance imaging sequences and are routinely used in the workup of MSA patients. Signal changes occurring in a cruciate pattern in the pons (“hot cross bun” sign) and signal changes in the lateral putamen are commonly sought.6 The hot cross bun sign is associated with the
selec-tive depletion of pontine neurons and myelinated transverse pontocerebellar fibers,7,8 while signal changes in the lateral
putamen are associated with the accumulation of iron and gliosis.9,10 However, it has been shown that these changes
are not particularly sensitive nor specific in establishing the diagnosis of MSA-C11–13 or MSA-P.7,14–16 Indeed, establishing
a diagnosis of MSA in vivo is challenging, and currently only “possible” and “probable” levels of certainty are achievable without neuropathological evaluation.
Diffusion tensor imaging (DTI) has the potential to greatly enhance the radiological evaluation of MSA, con-sidering that DTI is sensitive to changes in the white matter that may not be appreciable on standard imaging sequences. Furthermore, as MSA has been postulated to be a primary oligodendropathy, changes in radial diffusivity (RD) and axial diffusivity (AD) may be especially useful in elucidating the origin of white matter changes in the disease process.17–19
Previous DTI studies in MSA have primarily used region of interest (ROI),20,21 tractography,22–24 and voxel-based
morphometry25–27 approaches. Tract-based spatial statistics
(TBSS) is a method that is better suited to examine global DTI characteristics in brain white matter. We therefore endeavored to perform an exploratory TBSS analysis in MSA, additionally applying ROIs in the basal ganglia to improve further characterize pathological changes and improve clinical applicability.
Materials and methods
Twenty MSA subjects were recruited for the present study (nine male, eleven female, 60.9 years±7 standard deviation [SD]),
including ten MSA-P subjects (four male, six female, mean age 62.0 years ±9 SD) and ten MSA-C subjects (five male, five female, mean age 59.9 years ±4 SD). The clinical diag-nosis of probable MSA was made according to established criteria.1 Demographic characteristics of the MSA group are
presented in Table 1. Twenty healthy, age- and sex-matched subjects (nine male, eleven female, mean age 61.3 years ±7 SD) were additionally included as controls. The study was approved by the ethics committee of Na Homolce Hospital, Prague, Czech Republic and all participants provided written informed consent.
Imaging was performed on a Siemens Avanto 1.5T scan-ner (Siemens Healthcare, Erlangen, Germany). Structural magnetic resonance images acquired using standard proton density-weighted, T1-weighted, T2-weighted, fluid-attenuated inversion recovery, and T2*-weighted sequences were used to exclude pathology in control subjects and to evaluate the pres-ence or abspres-ence of radiological signs typically associated with MSA; signal changes in the lateral putamen (Figure 1A), and signal changes occurring in a cruciate pattern in the pons (“hot cross bun” sign; Figure 1B). Diffusion-weighted data were
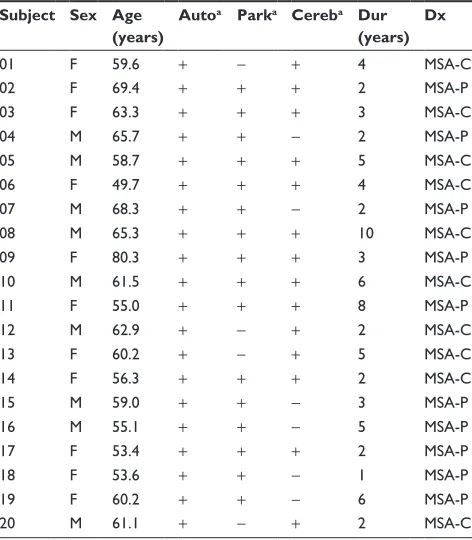
Table 1 Demographic characteristics of all Msa patient participants
Subject Sex Age (years)
Autoa Parka Cereba Dur (years)
Dx
01 F 59.6 + − + 4 Msa-c
02 F 69.4 + + + 2 Msa-P
03 F 63.3 + + + 3 Msa-c
04 M 65.7 + + − 2 Msa-P
05 M 58.7 + + + 5 Msa-c
06 F 49.7 + + + 4 Msa-c
07 M 68.3 + + − 2 Msa-P
08 M 65.3 + + + 10 Msa-c
09 F 80.3 + + + 3 Msa-P
10 M 61.5 + + + 6 Msa-c
11 F 55.0 + + + 8 Msa-P
12 M 62.9 + − + 2 Msa-c
13 F 60.2 + − + 5 Msa-c
14 F 56.3 + + + 2 Msa-c
15 M 59.0 + + − 3 Msa-P
16 M 55.1 + + − 5 Msa-P
17 F 53.4 + + + 2 Msa-P
18 F 53.6 + + − 1 Msa-P
19 F 60.2 + + − 6 Msa-P
20 M 61.1 + − + 2 Msa-c
Notes: Parkinsonism was considered positive in the presence of bradykinesia and rigidity, while cerebellar signs were documented as positive in the presence of gait ataxia, cerebellar dysarthria, limb ataxia, or cerebellar oculomotor dysfunction.
aAs defined by current consensus criteria in the diagnosis of MSA.1
Abbreviations: auto, autonomic manifestations; Park, parkinsonian manifestations; cereb, cerebellar manifestations; Dur, duration; Dx, diagnosis; F, female; M, male; Msa-c, multiple system atrophy, cerebellar subtype; Msa-P, multiple system atrophy, parkinsonian subtype; Park, parkinsonian manifestations.
Neuropsychiatric Disease and Treatment downloaded from https://www.dovepress.com/ by 118.70.13.36 on 25-Aug-2020
Dovepress Diffusion imaging in multiple system atrophy
acquired in 12 noncollinear gradient directions (b=1,100; rep-etition time [TR]=8,839 ms, echo time [TE]=95 ms; number of excitations [NEX]=2; 2.2 mm isotropic voxel). Diffusion data were processed offline in FSL v5 (FMRIB Software Library, Oxford, UK)28 and subjected to eddy current and motion
cor-rection, followed by brain extraction.29 Dtifit was then used to
generate fractional anisotropy (FA), mean diffusivity (MD), RD, and AD maps (Table 2). Voxel-wise statistical analyses of the diffusion-weighted data were carried out using TBSS.30
A study-specific mean FA template was created and used in transforming all subjects to standard 1×1×1 mm3 MNI152
space. The white matter skeleton was thresholded at FA .0.4, and statistical tests were performed using 10,000 permutations. The results were thresholded using threshold-free cluster enhancement at the P,0.05 level of significance.
Automated ROI analyses were performed in template space in the basal ganglia (caudate nucleus, putamen, and globus pallidus). The ROIs were created by separating the stated masks from the Harvard-Oxford subcortical structural atlas, transforming them to study space, and finally twice eroding to minimize partial volume effects. The ROIs were then projected against the diffusion tensor data. The ROI data were further processed in R.31 A one-way analysis of variance
test was used to test for group differences, followed by the Tukey–Kramer procedure in those regions and metrics that reached significance. An ROI covering the bilateral middle cerebellar peduncles (MCPs) was additionally extracted from the Johns Hopkins University white matter labels,32
transformed to study space, and then skeletonized against the mean-FA skeleton. The pROC package33 was used for
receiver operating characteristic analyses of ROI data and leave-one-out cross-validation was performed with the boot package.34 A linear model was used to assess correlation
between DTI metrics and age as well as disease duration in MSA patients. The Bonferroni correction for multiple comparisons was applied to maintain an alpha-level of 0.05 (all significant P-values reported are corrected).
To further evaluate clinical applicability, ROI data were analyzed using a support vector machine in the Matlab v7.13 environment (MathWorks, Natick, MA, USA). To find the best combination of DTI metrics for group classification, we first constructed a feature vector consisting of all measure-ments for all participants (20 MSA subjects and 20 controls), and subsequently performed an exhaustive search across all possible combinations. A classifier with a Gaussian radial basis kernel was chosen as it enables a smooth, curved decision boundary. The choice of optimal parameters was determined by a grid search over a range of values,35 and
were found to be C=2, ρ=2. To validate the reproducibility of the method, a cross-validation scheme was used. The original data across 40 subjects were randomly separated into two subsets: a training subset composed of 60% of the data (24 subjects) and a testing subset composed of 40% of the data (16 subjects). This process was repeated 20 times for each combination. The final performance of the model was calculated as the average percentage of subjects correctly classified (MSA vs control) over all 20 cycles.
Results
Two radiologists experienced in the routine clinical evalua-tion of MSA and other neurodegenerative diseases (JK, MS)
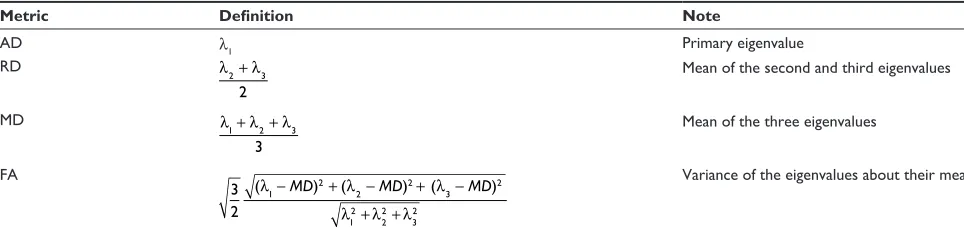
Table 2 Definition of diffusion metrics used
Metric Definition Note
aD λ1 Primary eigenvalue
rD λ2 λ3
2
+ Mean of the second and third eigenvalues
MD λ λ λ
1 2 3
3
+ + Mean of the three eigenvalues
Fa
3 2
1 2
2 2
3 2 12 22 32
( ) ( ) ( )
λ λ λ
λ λ λ
− + − + −
+ +
MD MD MD Variance of the eigenvalues about their mean
Abbreviations: aD, axial diffusivity; Fa, fractional anisotropy; MD, mean diffusivity; rD, radial diffusivity. Figure 1 Qualitative radiological signs typically associated with Msa.
Notes: (A) signal changes visible on T2*-weighted sequence in the lateral putamen. The patient was diagnosed as Msa-c. (B) signal changes occurring in a cruciate pattern in the pons (“hot cross bun” sign) seen on proton density-weighted sequence. The patient was diagnosed as Msa-P.
Abbreviations: Msa, multiple system atrophy; Msa-c, multiple system atrophy, cerebellar subtype; Msa-P, multiple system atrophy, parkinsonian subtype.
Neuropsychiatric Disease and Treatment downloaded from https://www.dovepress.com/ by 118.70.13.36 on 25-Aug-2020
Dovepress rulseh et al
blindly evaluated the qualitative MSA and control images in the present study. The raters achieved a mean sensitivity of 67.5% and mean specificity of 92.5%. The interrater reliabil-ity for the two raters was moderate (Cohen’s kappa =0.68,
P,0.001).
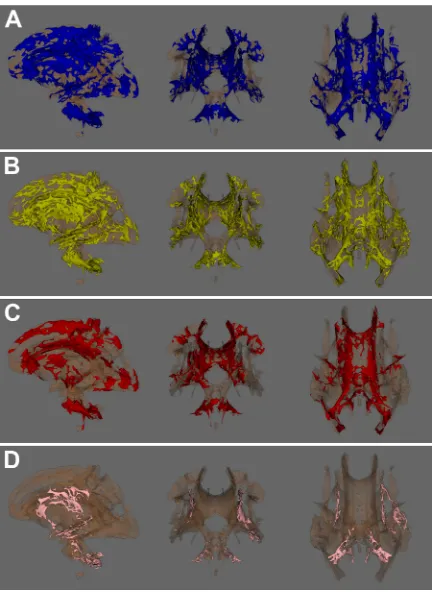
In examining differences between all MSA and control subjects reported by TBSS, we observed widespread differ-ences in RD and MD, with similar patterns in FA and AD but in fewer voxels (Figure 2). RD and MD were increased and FA reduced in the superior, middle, and inferior cer-ebellar peduncles bilaterally (Figure 2A–C), with a smaller volume of increased AD in the bilateral middle and inferior cerebellar peduncles (Figure 2D). No differences in AD between patients and controls were observed in the superior cerebellar peduncles. Changes in RD and MD were also more widespread supratentorially, being increased throughout the corona radiata and commissural fibers bilaterally, in the body and genu of the corpus callosum in the midline, and in many subcortical areas, primarily frontal (Figure 2A and B). RD and MD were also increased in the internal and external capsules bilaterally, including parts of the bilateral corticospinal tract.
Supratentorially, reduced FA followed a similar pattern but was observed in fewer voxels (Figure 2C). Increased AD was primarily observed in a small number of voxels in the more central portions of the corona radiata and in the left external capsule (Figure 2D). These voxels generally demonstrated increased RD and MD, but no changes in FA.
We further explored differences between controls and the MSA-P and MSA-C diagnostic subgroups by TBSS. In MSA-P, only supratentorial differences were observed in comparison with controls, which followed a pattern similar to all MSA patients versus controls but in fewer voxels. In MSA-C, differences were also similar to those detected between all MSA subjects and controls, with robust changes detected infratentorially and a similar pattern supratentorially but in fewer voxels. No differences were detected between the MSA-C and MSA-P diagnostic subgroups.
Considering that no differences between the MSA-C and MSA-P diagnostic subgroups were detected by TBSS, we elected to additionally evaluate DTI metrics in the basal ganglia (caudate nucleus, putamen, and globus pallidus) of MSA and control subjects. As no differences in laterality were detected in the basal ganglia, we used the mean of right and left measurements in all further analyses. We then explored group differences between MSA-C, MSA-P, and controls by analysis of variance, followed by the Tukey– Kramer procedure in those regions and metrics that reached significance. We detected that MSA-P significantly differed from other groups (MSA-C, controls) in the putamen only, in AD, MD, and RD. No differences in FA in the putamen were detected (Table 3). No correlation between DTI metrics and age or disease duration was observed in the putamen or the MCP of MSA patients (Table 4).
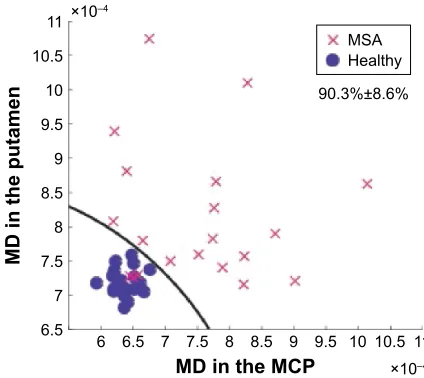
Support vector machine analysis of MD data from ROIs covering the bilateral putamen and MCP reached a classifi-cation performance of 90.3%±9% (sensitivity 86.5%±11%, specificity 99.3%±4%) in discriminating MSA patients from healthy participants (Figure 3). Considering MD in the
Figure 2 Tract-based spatial statistics results: voxels demonstrating significant
(P,0.05) differences between all patients and controls.
Notes: (A) radial diffusivity (patients . controls), (B) mean diffusivity (patients . controls), (C) fractional anisotropy (patients , controls), and (D) axial diffusivity (patients . controls).
Table 3 DTi results in bilateral putamen
Metric F-value P-value
aD F(2,37)=16.649 ,0.001
MD F(2,37)=15.028 ,0.001
rD F(2,37)=13.4 ,0.001
Fa F(2,37)=3.5505 0.19
Notes: results of aNOVa analyses of rOi data in the bilateral putamen in subjects with Msa-c, Msa-P, and controls.
Abbreviations: aD, axial diffusivity; aNOVa, analysis of variance; Fa, fractional anisotropy; DTi, diffusion tensor imaging; MD, mean diffusivity; rD, radial diffusivity; Msa-c, multiple system atrophy, cerebellar subtype; Msa-P, multiple system atrophy, parkinsonian subtype; rOi, region of interest.
Neuropsychiatric Disease and Treatment downloaded from https://www.dovepress.com/ by 118.70.13.36 on 25-Aug-2020
Dovepress Diffusion imaging in multiple system atrophy
regions separately, we achieved an accuracy of 79.7%±9% (sensitivity 72.5%±9%, specificity 99.3%±3%) in the MCP and an accuracy of 78.4%±10% (sensitivity 74.6%±11%, specificity 89.6%±12%) in the bilateral putamen.
Leave-one-out cross-validation was additionally per-formed in the bilateral putamen on MD data to evaluate different classifications: between all MSA subjects and con-trols, between MSA-P and non-MSA-P, and a phenotypical classification between parkinsonian-positive subjects and parkinsonian-negative subjects. The data were reclassified in an attempt to improve diagnostic utility, as we expected that subjects with parkinsonian manifestations would likely have detectable changes in MD in the putamen, while those without parkinsonian manifestations would likely not. We observed a prediction error of 15.2% in classifying subjects as patient or control, 13% as MSA-P or non-MSA-P, and
11.6% in classifying subjects as parkinsonian positive or parkinsonian negative. A similar classification experiment was performed in the MCP, resulting in a prediction error of 15.5% in classifying subjects as patient or control, 10.6% as MSA-C or non-MSA-C, and 10.1% in classifying sub-jects as cerebellar positive or cerebellar negative. Receiver operating characteristic analyses in the bilateral putamen and MCP were performed to identify cutoff values maximizing specificity and were determined as MD .20% of the mean normative value in the MCP and .6% in the putamen.
Discussion
In the present study, we investigated DTI characteristics of brain gray and white matter in MSA subjects in vivo. Our TBSS results showed widespread differences in the white matter of MSA subjects in comparison to controls, reflected primarily in increased RD and MD (Figure 2). While MD is known to be a sensitive but nonspecific marker of mor-phological changes in the white matter, RD has been shown to correlate with myelin integrity.17,18 Our findings
there-fore lend support to the hypothesis that MSA is a primary oligodendrogliopathy.
In examining DTI differences between MSA subgroups (MSA-P and MSA-C) and controls, we observed similar differences between MSA-C subjects and controls as in the pooled analysis, while only supratentorial differences were detected between MSA-P subjects and controls. As with all MSA subjects versus controls, the MSA-C and MSA-P subgroups showed the greatest differences in RD and MD. These observations are generally in agreement with those reported previously.20,22,25,36 Approximately half of the patient
participants in our study exhibited clinically both cerebellar and parkinsonian manifestations, in agreement with previous studies.37,38 As we did not observe any differences between
the MSA-C and MSA-P diagnostic subgroups by TBSS, we hypothesized that this large degree of clinical overlap was likely related to this negative result. To further explore potential differences between the MSA-C and MSA-P subgroups, we additionally evaluated DTI characteristics in the basal ganglia. We detected significant differences between the MSA-P group and other groups (MSA-C, controls) in RD, MD, and AD in the putamen only, with no differences observed in FA.
To evaluate clinical applicability of our findings, support vector machine analysis was performed on MD data extracted from ROIs covering the bilateral putamen and MCP. The selection of MD was made primarily due to the robust results in both regions, as well as the consideration of general acces-sibility. We reached the highest classification performance
Table 4 correlation between age, disease duration, and DTi metrics in the McP and bilateral putamen in Msa patients
MCP Putamen
Age Disease
duration
Age Disease
duration Metric P-value Metric P-value Metric P-value Metric P-value
Fa P=0.59 Fa P=0.83 Fa P=0.16 Fa P=0.77
aD P=0.32 aD P=0.93 aD P=0.14 aD P=0.39
rD P=0.51 rD P=0.96 rD P=0.18 rD P=0.37
MD P=0.44 MD P=0.95 MD P=0.07 MD P=0.38
Abbreviations: aD, axial diffusivity; DTi, diffusion tensor imaging; Fa, fractional anisotropy; McP, middle cerebellar peduncle; MD, mean diffusivity; Msa, multiple system atrophy; rD, radial diffusivity.
î± î±
0'LQWKH0&3
0'LQWKHSXWDPHQ
06$ +HDOWK\
Figure 3 support vector machine results in the bilateral putamen and middle cerebellar peduncle: paired MD with complex decision boundary.
Notes: No healthy subjects were misclassified as MSA, three MSA patients were misclassified as healthy.
Abbreviations: McP, middle cerebellar peduncle; MD, mean diffusivity; Msa, multiple system atrophy.
Neuropsychiatric Disease and Treatment downloaded from https://www.dovepress.com/ by 118.70.13.36 on 25-Aug-2020
Dovepress rulseh et al
in both regions combined (accuracy 90.3%±9%, Figure 3), indicating that both regions should ideally be evaluated in the workup of MSA subjects. Thus, objective DTI evalua-tion in these two regions was superior to more tradievalua-tional subjective evaluation.
We hypothesized that differences in the putamen may be more representative of a parkinsonian phenotype, that is, subjects with clinically evident parkinsonian manifestations are likely to have detectable changes in the putamen. We hypothesized that this more common sense approach would perform better than classification by the traditional subgroups (MSA-C, MSA-P), as half of the MSA subjects had both clinically evident cerebellar and parkinsonian manifestations. To test this possibility, leave-one-out cross-validation was performed on MD data in the putamen. Cross-validation results support this hypothesis, as the prediction error improved from 15.2% in all MSA subjects versus controls, to 13% as MSA-P or non-MSA-P, and 11.6% when classifying subjects by phenotype. We performed a similar analysis in the MCP, and found that a phenotypic classification also per-formed better than traditional classification, with prediction error improving from 15.5% in classifying subjects as patient or control, 10.6% as MSA-C or non-MSA-C, and 10.1% phenotypically. Thus, the typical designations of MSA-C/ MSA-P provide only limited information as, for example, approximately half of MSA-C subjects have clinically evident parkinsonian manifestations and likely have corresponding changes in the putamen detectable by DTI (Figure 1).
Our results suggest that the cerebellar and parkinsonian components of MSA may be separate, but overlapping processes. In a large series of 100 definite MSA cases, Ozawa et al38 reported that pathological changes in
stria-tonigral degeneration likely begin in the substantia nigra, where neuronal cell death appears to occur independent of glial cytoplasmic inclusion accumulation, and concluded that other factors likely contribute to this phenotype. The authors did not observe any cases of pure striatonigral or olivopontocerebellar pathology, which may be related to the postmortem nature of the study; that is, at the terminus of the disease process it is likely that both striatonigral and olivopontocerebellar systems are affected.
In the diagnostic setting, magnetic resonance imaging is performed to assist in the confirmation or exclusion of MSA; therefore, we aimed to maximize specificity by determining diagnostic thresholds using receiver operating characteristic analyses. We found that MD .20% of the mean normative value in the MCP and .6% of the mean normative value in the putamen maximized specificity (100%). However,
thresholds and specific cutoff values may be influenced by a number of factors39,40 and should be verified on a per-site
basis. As one of the most challenging scenarios in the workup of MSA is differentiating MSA from Parkinson disease, further studies are needed to evaluate the performance of the presented methodology in this setting.
Conclusion
In conclusion, we detected widespread changes in the brain white matter and putamen of MSA subjects. We achieved high classification performance on MD data in both the bilateral putamen and MCP (accuracy 90.3%±9%, sensitiv-ity 86.5%±11%, specificity 99.3%±4%). Finally, we deter-mined that MD .20% of the mean normative value in the MCP and .6% of the mean normative value in the putamen achieved specificity of 100%.
Acknowledgments
This work was supported by the Ministry of Health, Czech Republic – conceptual development of research organization (Nemocnice Na Homolce – NNH, 00023884; IG 154303) and by the grant “Cognitive Predictors of Neurodegeneration from the Czech Science Foundation”, under grant number 16-01781S.
Disclosure
The authors report no conflicts of interest in this work.
References
1. Gilman S, Wenning GK, Low PA, et al. Second consensus statement on the diagnosis of multiple system atrophy. Neurology. 2008;71(9): 670–676.
2. Papp MI, Kahn JE, Lantos PL. Glial cytoplasmic inclusions in the CNS of patients with multiple system atrophy (striatonigral degeneration, olivopontocerebellar atrophy and Shy–Drager syndrome). J Neurol Sci. 1989;94(1–3):79–100.
3. Song YJC, Lundvig DMS, Huang Y, et al. p25alpha relocalizes in oli-godendroglia from myelin to cytoplasmic inclusions in multiple system atrophy. Am J Pathol. 2007;171(4):1291–1303.
4. Ishizawa K, Komori T, Arai N, Mizutani T, Hirose T. Glial cytoplasmic inclusions and tissue injury in multiple system atrophy: a quantitative study in white matter (olivopontocerebellar system) and gray matter (nigrostriatal system). Neuropathology. 2008;28(3):249–257. 5. Prusiner SB, Woerman AL, Morder DA, et al. Evidence for α-synuclein
prions causing multiple system atrophy in humans with parkinsonism.
Proc Natl Acad Sci U S A. 2015;112(38):E5308–E5317.
6. Horimoto Y, Aiba I, Yasuda T, et al. Longitudinal MRI study of multiple system atrophy – when do the findings appear, and what is the course?
J Neurol. 2002;249(7):847–854.
7. Schrag A, Kingsley D, Phatouros C, et al. Clinical usefulness of magnetic resonance imaging in multiple system atrophy. J Neurol Neurosurg
Psychiatry. 1998;65(1):65–71.
8. Abe K, Hikita T, Yokoe M, Mihara M, Sakoda S. The “cross” signs in patients with multiple system atrophy: a quantitative study.
J Neuroimaging. 2006;16(1):73–77.
Neuropsychiatric Disease and Treatment downloaded from https://www.dovepress.com/ by 118.70.13.36 on 25-Aug-2020
Neuropsychiatric Disease and Treatment
Publish your work in this journal
Submit your manuscript here: http://www.dovepress.com/neuropsychiatric-disease-and-treatment-journal
Neuropsychiatric Disease and Treatment is an international, peer-reviewed journal of clinical therapeutics and pharmacology focusing on concise rapid reporting of clinical or pre-clinical studies on a range of neuropsychiatric and neurological disorders. This journal is indexed on PubMed Central, the ‘PsycINFO’ database and CAS,
and is the official journal of The International Neuropsychiatric Association (INA). The manuscript management system is completely online and includes a very quick and fair peer-review system, which is all easy to use. Visit http://www.dovepress.com/testimonials.php to read real quotes from published authors.
Dovepress
Dove
press
Diffusion imaging in multiple system atrophy
9. Schwarz J, Weis S, Kraft E, et al. Signal changes on MRI and increases in reactive microgliosis, astrogliosis, and iron in the putamen of two patients with multiple system atrophy. J Neurol Neurosurg Psychiatry. 1996;60(1):98–101.
10. Vymazal J, Righini A, Brooks RA, et al. T1 and T2 in the brain of healthy subjects, patients with Parkinson disease, and patients with multiple system atrophy: relation to iron content. Radiology. 1999; 211(2):489–495.
11. Bürk K, Skalej M, Dichgans J. Pontine MRI hyperintensities (“the cross sign”) are not pathognomonic for multiple system atrophy (MSA). Mov
Disord. 2001;16(3):535.
12. Nicoletti G, Fera F, Condino F, et al. MR imaging of middle cerebel-lar peduncle width: differentiation of multiple system atrophy from Parkinson disease. Radiology. 2006;239(3):825–830.
13. Massey LA, Micallef C, Paviour DC, et al. Conventional magnetic resonance imaging in confirmed progressive supranuclear palsy and multiple system atrophy. Mov Disord. 2012;27(14):1754–1762. 14. Kraft E, Schwarz J, Trenkwalder C, Vogl T, Pfluger T, Oertel WH.
The combination of hypointense and hyperintense signal changes on T2-weighted magnetic resonance imaging sequences: a specific marker of multiple system atrophy? Arch Neurol. 1999;56(2):225–228. 15. Lee EA, Cho HI, Kim SS, Lww WY. Comparison of magnetic resonance
imaging in subtypes of multiple system atrophy. Parkinsonism Relat
Disord. 2004;10(6):363–368.
16. Seppi K, Schocke MF, Mair KJ, et al. Progression of putaminal degeneration in multiple system atrophy: a serial diffusion MR study.
Neuroimage. 2006;31(1):240–245.
17. Song S, Sun S, Ramsbottom MJ, Chang C, Russell J, Cross AH. Dysmyelination revealed through MRI as increased radial (but unchanged axial) diffusion of water. Neuroimage. 2002;17(3):1429–1436. 18. Song S, Sun S, Ju W, Lin SJ, Cross AH, Neufeld AH. Diffusion
ten-sor imaging detects and differentiates axon and myelin degeneration in mouse optic nerve after retinal ischemia. Neuroimage. 2003;20(3): 1714–1722.
19. Song S, Yoshino J, Le TQ, et al. Demyelination increases radial dif-fusivity in corpus callosum of mouse brain. Neuroimage. 2005;26(1): 132–140.
20. Shiga K, Yamada K, Yoshikawa K, Mizuno T, Nishimura T, Nakagawa M. Local tissue anisotropy decreases in cerebellopetal fibers and pyramidal tract in multiple system atrophy. J Neurol. 2005;252(5):589–596. 21. Kitamura K, Nakayama K, Kosaka S, et al. Diffusion tensor imaging of
the cortico-ponto-cerebellar pathway in patients with adult-onset ataxic neurodegenerative disease. Neuroradiology. 2008;50(4):285–292. 22. Ito M, Watanabe H, Atsuta N, et al. Fractional anisotropy values detect
pyramidal tract involvement in multiple system atrophy. J Neurol Sci. 2008;271(1–2):40–46.
23. Taoka T, Kin T, Nakagawa H, et al. Diffusivity and diffusion anisotropy of cerebellar peduncles in cases of spinocerebellar degenerative disease.
Neuroimage. 2007;37(2):387–393.
24. Nilsson C, Bloch KM, Brockstedt S, et al. Tracking the neurodegenera-tion of parkinsonian disorders – a pilot study. Neuroradiology. 2007; 49(2):111–119.
25. Oishi K, Konishi J, Mori S, et al. Reduced fractional anisotropy in early-stage cerebellar variant of multiple system atrophy. J Neuroimaging. 2009; 19(2):127–131.
26. Tir M, Delmaire C, le Thuc V, et al. Motor-related circuit dysfunction in MSA-P: usefulness of combined whole-brain imaging analysis. Mov
Disord. 2009;24(6):863–870.
27. Wang P, Wu H, Lin C, Soong BW. Use of diffusion tensor imaging to identify similarities and differences between cerebellar and parkin-sonism forms of multiple system atrophy. Neuroradiology. 2010;53(7): 471–481.
28. Smith SM, Jenkinson M, Woolrich MW, et al. Advances in functional and structural MR image analysis and implementation as FSL.
Neuroim-age. 2004;23(Suppl 1):S208–S219.
29. Smith SM. Fast robust automated brain extraction. Hum Brain Mapp. 2002;17(3):143–155.
30. Smith SM, Jenkinson M, Johansen-Berg H, et al. Tract-based spatial statis-tics: voxelwise analysis of multi-subject diffusion data. Neuroimage. 2006; 31(4):1487–1505.
31. R Development Core Team. R: A Language and Environment for
Statistical Computing. Vienna, Austria: R Foundation for Statistical
Computing; 2014.
32. Oishi K, Faria A, Jiang H, et al. Atlas-based whole brain white mat-ter analysis using large deformation diffeomorphic metric mapping: application to normal elderly and Alzheimer’s disease participants.
Neuroimage. 2009;46(2):486–499.
33. Robin X, Turck N, Hainard A, et al. pROC: an open-source package for R and S+ to analyze and compare ROC curves. BMC Bioinformatics. 2011;12:77.
34. Davison AC, Hinkley DV. Bootstrap Methods and Their Applications. Cambridge: Cambridge University Press; 1997.
35. Hastie T, Tibshirani R, Friedman JH. The Elements of Statistical
Learning – Data Mining, Inference, and Prediction. New York:
Springer; 2009.
36. Prakash N, Hageman N, Hua X, Toga AW, Perlman SL, Salamon N. Patterns of fractional anisotropy changes in white matter of cerebellar peduncles distinguish spinocerebellar ataxia-1 from multiple system atrophy and other ataxia syndromes. Neuroimage. 2009;47(Suppl 2): T72–T81.
37. Schrag A, Good CD, Miszkiel K, et al. Differentiation of atypical parkinsonian syndromes with routine MRI. Neurology. 2000;54(3): 697–702.
38. Ozawa T, Paviour D, Quinn NP, et al. The spectrum of pathological involvement of the striatonigral and olivopontocerebellar systems in multiple system atrophy: clinicopathological correlations. Brain. 2004;127(Pt 12):2657–2671.
39. Pierpaoli C, Basser PJ. Toward a quantitative assessment of diffusion anisotropy. Magn Reson Med. 1996;36(6):893–906.
40. Rulseh AM, Keller J, Tintěra J, Kožíšek M, Vymazal J. Chasing shadows: what determines DTI metrics in gray matter regions? An in vitro and in vivo study. J Magn Reson Imaging. 2013;38(5):1103–1110.
Neuropsychiatric Disease and Treatment downloaded from https://www.dovepress.com/ by 118.70.13.36 on 25-Aug-2020