ISSN (e): 2250-3021, ISSN (p): 2278-8719
Vol. 08, Issue 01 (January. 2018), ||V1|| PP 94-100
Mushroom Classification Using ANN and ANFIS Algorithm
S.K. Verma
1,M. Dutta
21 Electronic and communication Department, NITTTR, Chandigarh, India 2 Electronic and communication Department, NITT TR, Chandigarh, India
Corresponding Author:S.K. Verma
Abstract:
This paper presents classification techniques for analyzing mushroom dataset. Artificial Mushroom dataset is composed of records of different types of mushrooms, which are edible or non- edible. Aritificial Neural Network and Adaptive Nuero Fuzzy inference system are used for implementation of the classification techniques. Different techniques used for classification like ANN, ANFIS and Naïve Bayes are used to categorize different mushrooms as edible or non-edible. The performance of the different techniques is evaluated using accuracy, MAE, kappa statistic. After analyzing the results it was found that Adaptive Nuero Fuzzy inference System outperformed the other techniques with highest accuracy, lowest mean absolute error and ANN is the second best performer. If size of training set is increased, the accuracy also increased with respect to training set.Keywords:
Accuracy , ANN, Adaptive Nuero Fuzzy Inference system, Classification , MSE ,Kappa statistic --- -------Date of Submission: 10-01-2018 Date of acceptance: 27-01-2018
--- ---
I.
INTRODUCTION
Large amount of data analysis is difficult task, so to handle large amount of datasets data mining technique can be used. Data mining techniques used to extract important information from large amount of data. Data mining is basically KDD process which involves Identification of data, its validation, novelty and understanding of pattern recognition of large and complex data [1-2]. Data mining technique is divided in to two categories descriptive and predictive task [3].Agriculture sector data is analyzed to classify different types of crops, classification of soil, increase the productivity of crops, aroma detection and freshness of fruits and vegetable [1]. Mushroom aroma and its structure, place of origin, and habitat has been used as marker of mushroom discrimination [4-6].The main component of mushroom aromas include alcohols and 1-octane-3-ol.The classification of mushrooms using sensors have reported in previous studies [7-9].This paper presents the use of different classification techniques on mushroom data to classify various types of mushrooms as edible or non-edible. Section I provides an overview of classification techniques used in this paper and different parameters used for performance of different techniques. Section II provides a brief review of related work on mushroom dataset used. Section III describes methodology. In Section IV result of classification techniques on mushroom data. Section V concludes the paper with future perspective.
II.
RELATED
WORK
Learning and testing two steps involved in classification and it predict the classes of objects whose class label is not known .In first step of classification; classifier is built to describe a predetermined set of concept by analyzing the training set of datasets. In next step, the predictive accuracy of classifier is estimated using the test data which is achieved in first step [1].Different types of classifiers such as Multilayer perceptron, Self-Organizing map, Support vector machine, decision trees, Bayes classifier, Genetic Algorithms, Nueral Network , Nuero fuzzy,Adaptive Nuero Fuzzy Inference system, etc. are used for classification of
datasets[10-12].Artificial neural network is applicable in various applications like, medical [13], business applications [14],
III.
METHODOLOGY
The artificial mushroom from Agaricus and Lepiota family were retrieved from UCI Machine learning respository [26]. This dataset consists of 8124 instances, 22 attributes, 2 possible classes. Mushroom dataset was split for training and testing purposes. Different sizes of training data were used to check the performance of classifier. The performance of different classification algorithm such as ANN, ANFIS , and Bayes Net classifier were compared on the basis of Mean absolute error, Accuracy, Kappa statistic for mushroom datasets. Feature extraction is required to get mathematical transformation of the multivariate time response. These transformations actually reduce the dimension of input data with more informative data [27].The steps involved in proposed method is shown in fig.1.
Fig.1 Steps involved in Mushroom classification
The proposed technique for mushroo classification is artificial neural network (BPNN) and adaptive fuzzy inference system. Naive bayes classifier assumes the presence of particular feature of a class which is not related to the presence of any feature. This is the supervised classification technique [1]. Fuzzy neural networks retain the basic properties and architectures of neural networks . The ANFIS learns features in the data set and adjusts the system parameters according to a given error criterion. ANFIS is the specific approach in neuro fuzzy development which has shown significant results in modeling of nonlinear functions [28-29]
IV.
RESULT AND DISCUSSION
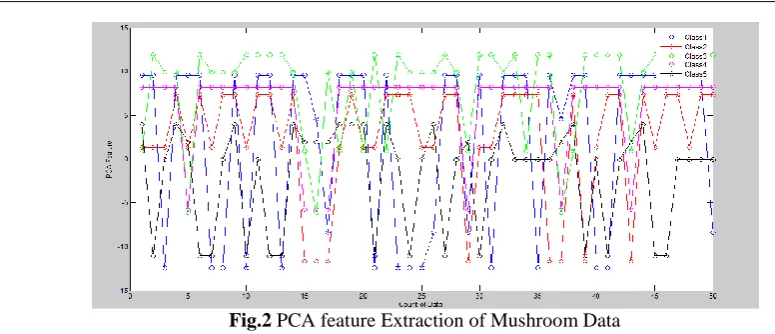
Fig.2 PCA feature Extraction of Mushroom Data
Fig. 2 shows feature extraction of mushroom data. Only five features selected as class 1,2,3,4,5 were given to next step ANN and ANFIS.Table 1 shows the values of different parameters like total no. instances, correctly classified instances and Kappa Statistic with the respective training dataset size for ANN technique. It is clear from the table that the accuracy is high when size of training dataset is large as compared to when dataset is small but highest accuracy is achieved at 70% of training data size and mean absolute error decreases as size of dataset increases. The values of Kappa Statistic also increase with the increase in size of training set.
Table1 Simulation result of ANN algorithm
S. No. Training Size (%) No. of Instances used for training (8124) Correctly Classified Instances %(value Incorrectly Classified Instances %(value) Mean Absolute Error Kappa Statistic
01 40 3250 94.4615 5.5385 0.0523 0.8892
02 50 4062 95.5441 4.4559 0.4431 0.9103
03 60 4874 95.5478 4.4522 0.452 0.9165
04 70 5687 96.8173 3.1872 0.033 0.9316
05 80 6499 96.738 3.262 0.0338 0.9338
It is clearly evident from the table that the accuracy increases with increase in dataset size and it is maximum for training set of 70 % of the whole data set. Mean Absolute Error decreases gradually from 40% to 70% of training data set size. Kappa statistic values vary between 0.8892 to 0.9338.
Table 2 Simulation result of ANFIS algorithm
S. No. Training Size (%) No. of Instances used for training (8124) Correctly Classified Instances %(value Incorrectly Classified Instances %(value) Mean Absolute Error Kappa Statistic
01 40 3250 94.7446 5.2524 0.0468 0.8827
02 50 4062 96.7583 3.2417 0.0316 0.9266
03 60 4874 98.7279 1.2721 0.0074 0.9822
04 70 5687 99.7538 0.2462 0.0018 0.9956
05 80 6499 99.8769 0.1231 0.0008 0.9980
Table 2 shows the values of different parameters with the respective training dataset size for ANFIS technique. It is clear from the table that the accuracy is high when size of training dataset is large as compared to when dataset is small but highest accuracy is achieved at 80% of training data size and mean absolute error decreases as size of dataset increases. The values of Kappa Statistic also increase with the increase in size of training set.
Table 3 Simulation result of Naïve Bayes algorithm [1]
S. No. Training Size (%) No. of Instances used for training (8124) Correctly Classified Instances %(value Incorrectly Classified Instances %(value) Mean Absolute Error Kappa Statistic
01 40 3250 94.4615 5.5385 0.0523 0.8892
.
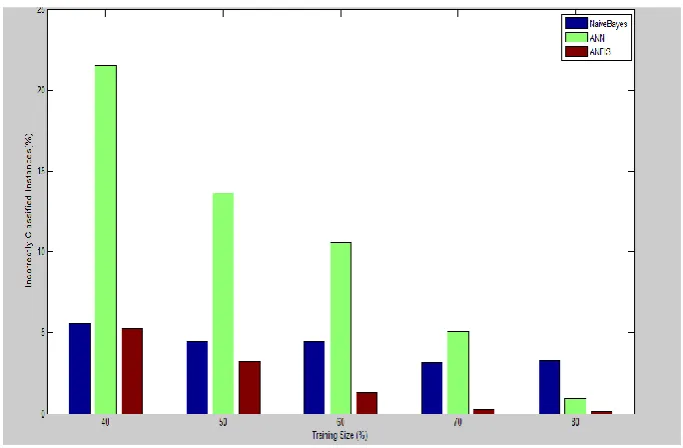
Fig 3. Comparison based on incorrectly classified instances
Fig 3 shows the comparative analysis between Naïve Bayes, ANN, and ANFIS classifier based on incorrectly classified instances. Fig 4 clearly depicts that the accuracy of ANFIS classifier is the best among these three classifier Naive Bayes, ANN, ANFIS techniques.
Fig 5. Comparison based on Mean Absolute Error
Fig 5 shows that the highest Mean absolute error is 0.03% and lowest Mean absolute error is 0.0019% in the ANFIS Technique. From the above graph we can clearly see that the Mean absolute error rate of Naïve Bayes classifier is the highest among these three classifier techniques.
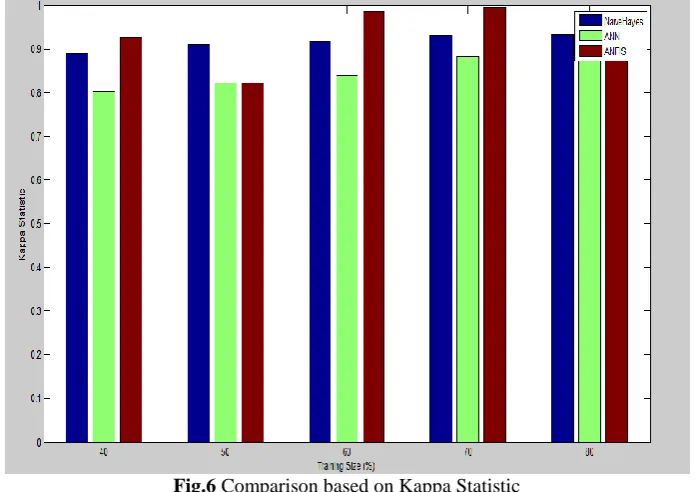
Fig.6 Comparison based on Kappa Statistic
Fig. 6 shows that the Kappa Statistic for all training size. From the above graph we can clearly see that the
Kappa Statistic rate of ANFIS classifier is the highest among these three classifier techniques
.
V.
CONCLUSION
Francisco, CA: Elsevier ; Morgan Kaufmann, 2006.
[4]. A. D. Wilson, “Diverse Applications of Electronic-Nose Technologies in Agriculture and Forestry”,
Sensors 2013, 13, 2013,2295-2348.
[5]. Z. Peterlin, Y. Li, G. Sun, R. Shah, S. Firestein,K. Ryan, “The importance of odorant conformation to the
binding and activation of a representative olfactory receptor” Chem. Biol.Vol. 15, 2008, 1317–1327.
[6]. L. Turin,F. Yoshii, “Structure-odor relations: A modern perspective” In Handbook of Olfaction and
Gustation, 2nd ed.; Richard, L.D., Ed.; Informa Healthcare: New York, NY, USA, 2003;p. 35.
[7]. Y.S.Kim, “Thermal treatment effects on the material and gas-sensing properties of room-temperature
tungsten oxide nanorod sensors” , Sens. Actuator B Chem. 2009, 137, 297–304.
[8]. Rossiter, K.J. Structure-odor relationships. Chem. Rev. 1996, 96, 3201–3240.
[9]. Wise, P.M.; Olsson, M.J.; Cain, W.S. Quantification of odor quality. Chem. Sens. 2000, 25, 429–433.
[10]. D.Kumar, S. Beniwal, “ Gentic algorithm and programming based classification: a survey”, Journal of
Theoretical and applied information technology, Vol. 54(1), 2013, 48-58.
[11]. M.Pardo, G. Sberveglieri, “Remarks on the use of multilayer perceptrons for the analysis of chemical
sensor array data” ,IEEE sensors Journal, Vol. 4, No.3, 2004, 355-363.
[12]. F.A.M. Davide, C. Di Natale, and A. D’ Amico, “ Self-organizing multi sensor systems for odour
classification: Internal categorization, adaptation and drift rejection”, Sensors Actuator B, Chemical, Vol.18No.-1-3, 1994, 244-258.
[13]. D. M. Joshi, N. K. Rana, and V. M. Misra, “Classification of brain cancer using artificial neural
network,” in Electronic Computer Technology (ICECT), 2010 International Conference on, 2010, pp. 112–116.
[14]. F. Y. partovi and murujan anandrajan, “classifying inventory using artificial neural network approach,”
Comput. Ind. Eng., vol. 41, no. 4, 2002, 389–404.
[15]. D. C. Park, M. A. El-Sharkawi, R. J. Marks, L. E. Atlas, and M. J. Damborg, “Electric load forecasting
using an artificial neural network,” IEEE Trans. Power Syst., vol. 6, no. 2, 1991, 442–449.
[16]. S. Knerr, L. Personnaz, and G. Dreyfus, “Handwritten digit recognition by neural networks with
single-layer training,” IEEE Trans. Neural Netw., vol. 3, no. 6, 1992, 962–968.
[17]. S. Agatonovic-Kustrin and R. Beresford, “Basic concepts of artificial neural network (ANN) modeling
and its application in pharmaceutical research,” J. Pharm. Biomed. Anal., vol. 22, no. 5, 2000,717–727,
[18]. H. Bourlard and Nelson morgan, “Continuous Speech Recognition by Connectionist Statistical
Methods,” IEEE Trans. Neural Netw., vol. 4, no. 6,1993, 893–909.
[19]. R. P. Lippmann, “Review of neural networks for speech recognition,” Neural Comput., vol. 1, no. 1,
1989, 1–38.
[20]. G. Zhang, M. Y. Hu, B. E. Patuwo, and D. C. Indro, “Artificial neural networks in bankruptcy prediction:
General framework and cross-validation analysis,” Eur. J. Oper. Res., vol. 116, no. 1, 1999. 16–32.
[21]. H. Bischof, W. Schneider, and A. J. Pinz, “Multispectral classification of Landsat-images using neural
networks,” IEEE Trans. Geosci. Remote Sens., vol. 30, no. 3, 1992, 482–490.
[22]. P. D. Heermann and N. Khazenie, “Classification of multispectral remote sensing data using a
back-propagation neural network,” IEEE Trans. Geosci. Remote Sens., vol. 30, no. 1, 1992., 81–88
[23]. C.-T. Lin and C. S. G. Lee, “Neural-network-based fuzzy logic control and decision system,” IEEE
Trans. Comput., vol. 40, no. 12, 1991 ,1320–1336
[24]. A. D. Wilson, and Manuela Baietto, “Applications and Advances in Electronic Nose Technologies”
,Sensors 2009,9,MDPI Journals, 2009,5099-5148.
[25]. K. Fujiaka, N. Shimizu, Y. Manome, K. Ikeda,K. Ymamoto and Yasuko Tomizawa, “Discrimination
[26]. K. Bache, M. Lichman, “UCI Machine learning Respository”. Available online: http:// archive.ics.uci.edu/ml
[27]. S. Marco and A. Gutierrez-Galvez, “Signal and Data Processing for Machine Olfaction and Chemical
Sensing: A Review”, IEEE Sensors Journal, Vol.12, No.11, 2012, 3189-3214.
[28]. J. Shing “Adaptive–Nework-Based Fuzzy Interfernce System”, IEEE Transaction system, Man And
Cybernetic Bernetic,Vol.23,No 3, 1993.
[29]. S. Priya, R. Priya, P. B, “Analysis of blood sample using ANFIS classification”, International research
Journal of Engineering and Technology, Vol.-04, No.3, 2017, 1460-1466.