Research Article
CODEN: IJPNL6
DEVELOPMENT AND VALIDATION OF RP-HPLC METHOD FOR THE
SIMULTANEOUS ESTIMATION OF NEBIVOLOL AND VALSARTAN IN PURE
BULK AND PHARMACEUTICAL DOSAGE FORM
D. Sreelatha, R. Ramya and T. Ramarao
Department of Pharmaceutical Analysis, Avanthi Institute of Pharmaceutical Sciences, Hyderabad,
India
*Corresponding author e-mail: [email protected]
ABSTRACT
A simple, Accurate, precise method was developed for the simultaneous estimation of the Nebivolol and Valsartan in Tablet dosage form. Retention time of Nebivolol and Valsartan were found to be 2.496min and 3.905min. %RSD of the Nebivolol and Valsartan were and found to be 0.4 and 0.8 respectively. %Recover was Obtained as 99.52% and 99.93% for Nebivolol and Valsartan respectively. LOD, LOQ values are obtained from regression equations of Nebivolol and Valsartan were 0.070ppm, 0.2142ppm and 0.179ppm, 0.544 ppm respectively. Regression equation of Nebivolol is y = = 0722x + 144.0, and y = 4560x + 248.2 of Valsartan . Retention times are decreased and that run time was decreased so the method developed was simple and economical that can be adopted in regular Quality control test in Industries.
Keywords: Nebivolol, Valsartan, RP-HPLC, Estimation, and Tablets
INTRODUCTION
Nebivolol is a β1 receptor blocker with nitric
oxide-potentiating vasodilatory effect used in treatment of hypertension and also for left ventricular failure. The chemical name for nebivolol is (1RS,1'RS)-1,1'-
[(2RS,2'SR)bis(6-fluoro-3,4-dihydro-2H-1-benzopyran-2-yl)]-2,2'-iminodiethanol hydrochloride. Nebivolol is a racemate composed of d-Nebivolol and l-Nebivolol with the stereochemical designations of [SRRR]-nebivolol and [RSSS]nebivolol, respectively. Nebivolol's molecular formula is (C22H25F2NO4•HCl). Nebivolol hydrochloride is a
white to almost white powder that is soluble in methanol, dimethylsulfoxide, and N,N-dimethylformamide, sparingly soluble in ethanol, propylene glycol, and polyethylene glycol, and very slightly soluble in hexane, dichloromethane, and methylbenzene. Valsartan is a nonpeptide, orally active, and specific angiotensin II receptor blocker acting on the AT1 receptor subtype. Valsartan is chemically described as N-(1-oxopentyl)-N-[[2'-(1H-tetrazol-5-yl) [1,1'-biphenyl]-4-yl]methyl]-L-valine. Its empirical formula is C24H29N5O3, its molecular
weight is 435.5. Valsartan is a white to practically
white fine powder. It is soluble in ethanol and methanol and slightly soluble in water. Valsartan is used to treat of high blood pressure, congestive heart failure, and to reduce death for people with left ventricular dysfunction after having had a heart attack. Literature survey reveals that good analytical methods are not available for the drugs like nebivolol and valsartan and very few simultaneous estimation methods for these two drugs individually so many methods like UV-Visible, HPLC, HPTLC, Volta metric methods reported for the estimation nebivolol and valsartan pharmaceutical dosage form. Present work is aimed at to develop a new, simple, fast, rapid, accurate, efficient and reproducible RP-HPLC method for the analysis of nebivolol and valsartan and developed method will be validated for parameters like accuracy, linearity, precision, specificity, robustness, and system suitability according to ICH guidelines.
MATERIALS AND METHODS
Instrumentation: Chromatographic separation was performed on WATERS HPLC 2965 SYSTEM with
International Journal of Pharmacy
Auto Injector and PDA Detector. Equipped with quaternary pump, Software used is Empower 2 solution software was employed for data collecting and processing. Chromatographic separation was achieved on BDS C‐18 (150mm × 4.6 mm, i.d., 5μ.) column column. Over laid spectrum was recorded by using UV-3000+ LABINDIA double beam UV-Visible spectrophotometer (model no.UV-2371) with 1cm matched quartz cells. Weighing was done on Shimadzu electronic balance (AY‐120). Global digital pH meter was used to adjust pH of the mobile phase. The mobile phase was degassed and sonicated by using PCI Mumbai 3.5 liter capacity Sonicator.
Method development and optimization of chromatographic parameters: The method is developed mainly based on pka concept of drug and
also different mobile phase compositions, flow rate, λmax, different columns and column temperatures.
Preparation of Buffer Solution: Buffer: (0.01N KH2PO4) Accurately weighed 1.42gm of Potassium
di hydrogen Ortho phosphate in a 1000ml of Volumetric flask add about 1000ml of milli-Q water and pHof this solution was adjusted to 3.0 with ortho phosphoric acid. The solution was mixed well and then filtered through 0.45µ filter paper.
Preparation of Mobile phase: Mobile phase was prepared by mixing pH 3.0 buffer solution and acetonitrile in the ratio 50:50 v/v. prior to use the mobile phase was filtered through 0.45µ membrane filter after sonication for 8 mins.
Diluent: (methanol) sample firstly dissolved in methanol and made up with buffer.
Preparation of Standard Stock Solution of Nebivolol: Accurately weighed 64 mg of Nebivolol standard drug was transferred to 100 ml of volumetric flask. Then it was dissolved by adding a little amount of diluent. Mix it well, 20 min for sonicate the solution and volume was made up to 100 ml. This is 1000µg/ml. From this solution 10 ml was transferred to another 100 ml volumetric flask and volume was made up to 100 ml with diluent(100µg/ml).
Preparation of Standard Stock Solution of Valsartan: Accurately weighed 16 mg of sertraline standard drug was transferred to 25 ml of volumetric flask. Then it was dissolved by adding a little amount of diluent. Mix it well, sonicate the solution and volume was made up to 25 ml. This is 1000µg/ml. From this solution 10 ml was transferred to another
100 ml volumetric flask and volume was made up to 100 ml with diluent(100µg/ml).
Preparation of Working Mixed Standard Solution: Accurately Weighed and transferred 5mg of Nebivolol and 16mg of Valsartan working Standards into 10ml and 25ml clean dry volumetric flasks, add 3/4th volume of diluent, sonicated for 5 minute and make up to the final volume with diluents. 1ml from the above two stock solutions was taken into a 10ml volumetric flask and made up to 10ml.
Preparation of Sample Solution: 5 tablets were weighed and calculate the average weight of each tablet then the weight equivalent to 5 tablets was transferred into a 250 mL volumetric flask, 150mL of diluent added and sonicated for 30 min, further the volume made up with diluent and filtered. From the filtered solution 0.8ml was pipeted out into a 10 ml volumetric flask and made upto 10ml with diluent.
System Suitability Studies: The system suitability studies were done for parameters like theoretical plates, tailing factor, retention time, resolution. 10 µl of mixed drug solution containing 100µg/ml of nebivolol and 100µg/ml of valsartan was injected (n=6) in to the optimized HPLC system and the results obtained are given in the table no.5.10.
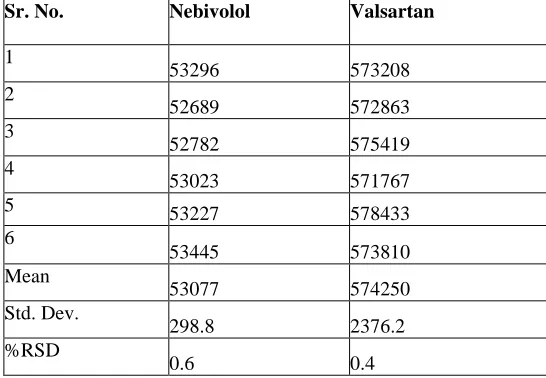
Linearity Studies: Preparation of Working Standard Solution: A mixture of solutions is prepared using the above stock solutions and linearity was observed by injecting these prepared solutions. The results were obtained and a graph is plotted between peak area v/s concentration taking peak area on y-axis and concentration on x-axis. Six Linear concentrations of Nebivolol (2-12ppm) and Valsartan (32-192ppm) are prepared and injected. Regression equation of the Nebivolol and Valsartan are found to be, y =6722.2x +144 y = 4560.4x + 248.25 and regression co-efficient was 0.999.
Precision Studies: For precision same concentration solution i.e, 5 mg of Nebivolol and 80 mg of Valsartan solution was injected 6 times and observed for any peculiar change in the areas and % RSD was calculated for each drug.
Intermediate Precision: Precision is done by injecting six times the same sample solution of drug and checked for the change in the area and %RSD was calculated for each drug and the results are tabulated below individually for each drug
Accuracy: For Accuracy the standard drug is spiked and 50%, 100%, 150% solutions were prepared and injected and averages of 3 readings are taken and recovery study is done.
Specificity: Specificity is the ability to assess unequivocally the analyte in the presence of components which may be expected to be present. Typically these might include impurities, degradants, matrix, etc.The chromatogram was taken by injecting appropriate diluted standard solution, sample solution and also blank and it was found that there is no interference with the analyte peak.
Limit of Detection: Limit of detection is the lowest concentration of the analyte that can be detected by injecting decreasing amount,not necessarily quantity by the method, under the stated experimental conditions. The limit of detection was calculated using the formula: LOD = 3.3* S.D/Slope
The slope and standard deviation (SD) values were calculated using the linearity graph. The LOD values of Nebivolol and Valsartan were found to be 0.070693µg/ml and 0.179618 µg/ml respectively.
Limit of Quantification:Limit of quantitation is the lowest concentration of the analyte in a sample that can be estimated quantitatively by injecting decreasing amount of drug with acceptable precision and accuracy under the stated experimental conditions of the method. The limit of quantitation was calculated using the formula:
LOQ = 10* S.D/ Slope
The slope and standard deviation (SD) values were calculated using the linearity graph
LOQ for Nebivolol and Valsartan were found to be 0.214and 0.544 respectively.
Robustness studies: Robustness is generally done by deliberately changing the parameters like flow rate and column temperature in the optimised conditions.The results obtained are presented in the table no 5.16.
Assay: Standard preparations are made from the API and Sample Preparations are from Formulation. Both sample and standards are injected six homogeneous samples. Drug in the formulation was estimated by taking the standard as the reference. The Average %Assay was calculated and found to be 99.52% and 99.93% for Nebivolol and Valsartan respectively.
RESULTS AND DISCUSSION
To develop a new RP-HPLC method, several mobile phase compositions were tried. A satisfactory
separation with good peak symmetry was obtained with C‐18 (250mm X 4.6mm, i.d., 5μm,) column using mobile phase containing KH2PO4 Buffer
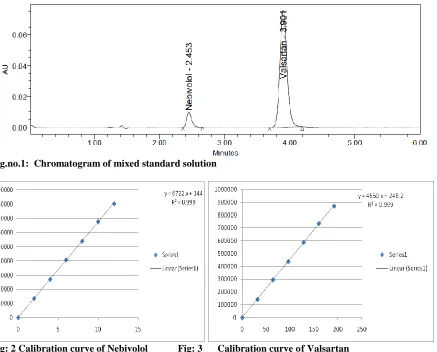
(PH=3): ACN: (50:50) (v/v) at a flow rate of 1 ml/min. Quantification was achieved at UV detection at 280 nm based on peak area. The retention time for Nebivolol and Valsartan were found to be 2.496 min and 3.905 min respectively. The optimized method was validated as per ICH guidelines. System suitability parameters like retention time, resolution, tailing and plate count were shown uniformity and %RSD was less than 2 and the results are given in table 5.10 and from the obtained results we can say that the system is suitable for analysis.
A linearity range of Nebivolol (2-12ppm) and Valsartan (32-192ppm) with correlation coefficient 0.999 was observed for both the drugs. In linearity plot the graph with six different concentrations versus areas to construct the linear regression equation and to calculate the value of correlation co-efficient. Linear correlation of Nebivolol and Valsartan are found to be, y =6722.2x +144 y = 4560.4x + 248.25 and regression co-efficient was 0.999. And calibration curve was shown in Fig.3 and 4. The precision of the proposed method was carried in terms of the repeatability and the %RSD values were found to be Nebivolol and Valsartan were 0.4% and 0.8%. Which reveal that the proposed method is precise Precision studies were tabulated in table.no.3 and 4. The study of robustness in the present method shows no significant changes either in the peak area or Rt. Rubustness data is tabulated in table no.6. The method accuracy was evaluated by recovery studies. The percentage recovery of Nebivolol and Valsartan was found to be 99.89% and 99.98% for 50% level; 100.59% and 100.39% for 100% level; 99.70% and 100.16% for 150% level and results was shown in table.no5.Method specificity was concluded and those figures are Nebivolol and Valsartan standard chromatogram and other one is formulation. There is no placebo and excipients peaks interference with standard and analytic peak so it proves method is selective.
CONCLUSION
and 0.179ppm, 0.544 ppm respectively. Regression equation of Nebivolol is y = = 0722x + 144.0, and y = 4560x + 248.2 of Valsartan . Retention times are decreased and that run time was decreased so the method developed was simple and economical that
can be adopted in regular Quality control test in Industries.
Fig.no.1: Chromatogram of mixed standard solution
Fig: 2 Calibration curve of Nebivolol Fig: 3 Calibration curve of Valsartan
Table No.1: System suitability studies of Nebivolol and Valsartan
S.No Parameter Drug Observed Value
Acceptance Criteria
1. Theoretical plates٭ Nebivolol 4724
NLT 2000 Valsartan 6293
2. Tailing factor٭ Nebivolol 1.32
NMT 2 Valsartan 1.14
3. Retention time (min)٭ Nebivolol 2.496
NLT 2 Valsartan 3.905
4 %RSD٭
Nebivolol 0.4 NMT 2 Valsartan 0.8
Table: 2 Calibration data of Nebivolol and Valsartanmethod. S.no Linearity
Level
Concentration Nebivolol(µg/ml)
Area Response
Concentration Valsartan (µg/ml)
Area Response
1 I
0 0 0 0
2 II
2 13518 32 142448 3 III
4 26980 64 295065 4 IV
6 40794 96 437436 5 V
8 53980 128 586878 6 VI
10 67727 160 734298 7 VII
12 80342 192 870202 Correlation coefficient 0.9999 0.9999
Table: 3 Repeatability results for Nebivolol and Valsartan
Sr. No. Nebivolol Valsartan
1
53554 584344 2
53716 596794 3
53631 585707 4
54001 583232 5
53456 586791 6
53513 587387 Mean
53645 587376 Std. Dev.
196.7 4861.9 %RSD
0.4 0.8
Table 4 Inter day precision results for Nebivolol and Valsartan
Sr. No. Nebivolol Valsartan
1
53296 573208 2
52689 572863 3
52782 575419 4
53023 571767 5 53227 578433 6
53445 573810 Mean
53077 574250 Std. Dev.
298.8 2376.2 %RSD
Table: 5 Accuracy results of Nebivolol and Valsartan
Sample Accuracy
Amount added (µg/ml)
Amount
Recovered (µg/ml)
Recovery (%) % RSD SD
Nebivolol
50% 4 3.99 99.89 0.75 0.75 100% 8 8.04 100.59 0.30 0.305 150% 12 63.80 99.70 0.63 0.472
Valsartan
50% 64 63.98 99.98 0.31 0.632 100% 128 127.97 100.38 0.43 0.31 150% 192 192.30 100.16 0.42 0.43
Table 6 Robustness data of Nebivolol and Valsartan method
Table.no.7: Results of analysis of commercial formulation
REFERENCES:
1. Arunadevi S. Birajdar , Subramania Nainar Meyyanathan and Bhojraj Suresh simultaneous determination of
nebivolol hcl and valsartan in solid dosage form by spectrophotometric and rp-hplc method IJPSR (2011), Vol.
2, Issue 2, 278-283.
2. C. Madhavi1, b. Siddartha1, c. Parthiban simultaneous estimation and validation of nebivolol and valsartan in tablet dosage form by rp-hplc International Journal of Pharmacy and Pharmaceutical Sciences ISSN- 0975-1491 Vol 6, Issue 1, 2014
3. Jagadish S. Modiya, Chirag B. Pandya, K. P. Channabasavaraj Simultaneous Estimation of Nebivolol Hydrochloride and Valsartan in Bulk and Capsule Dosage Form by Simultaneous Equation Method International Journal of ChemTech Research CODEN( USA): IJCRGG ISSN : 0974-4290 Vol.2, No.3, pp 1387-1390, July-Sept 2010
4. Chaudhary Ankit B Patel Rakesh K Chaudhary Sunita A Estimation of Valsartan and Nebivolol in pharmaceutical dosage forms by absorption ratio method Chaudhary Ankit B et al. | Int. J. Res. Pharm. Sci.
Vol-1, Issue-2, 108-112, 2010
5. B.s.sastry, d.srinivasulu and h.ramana reverse phase hplc method for the analysis of nebivolol in pharmaceutical dosage forms jprhc | july 2009 | vol. 1 | no.1 | 25-33
6. M.Akiful Haque, S.Hasan Amrohi, Prashanth Kumar.K Stability indicating RP-HPLC method for the estimation of Valsartan in pharmaceutical dosage form IOSR Journal of Pharmacy ISSN: 2250-3013, www.iosrphr.org
Volume 2 Issue 4 July-August 2012 PP.12-18
7. Imam SS, Ahad A, Aqil M, Sultana Y, Ali A. A validated RP-HPLC method for simultaneous determination of propranolol and valsartan in bulk drug and gel formulation. J Pharm Bioallied Sci. 2013 Jan;5(1):61-5
8. Selvadurai Muralidharan Simple and Validated RP-HPLC Method for the Estimation of Valsartan in
Pharmaceutical Tablet Dosage Form Journal of Radiation Research.
9. Subhajit Ghanty, Rudranil Das, Sabyasachi Maiti, Kalyan Kumar Sen RP-HPLC Method for Estimation of
Valsartan in Solid Oral Dosage Forms Journal of PharmaSciTech ISSN: 2231 3788 (Print) 2321 4376 (Online
10.V. Bhaskara Raju and A. Lakshmana Rao Reversed Phase HPLC Analysis of Valsartan in
Pharmaceutical Dosage Forms nternational Journal of Chemical, Environmental and Vol. 2, No.1,
56-60 January-April, 2011.
Condition Variation
Average peak area %RSD Retention time (min)
NEBI VAL NEBI VAL NEBI VAL Flow rate
(ml/min)
Less flow 0.80 4304723 24398390 0.2 0.1 2.875 4.823 Actual flow 1 3819929 22066321 1.3 0.2 2.317 3.688 More flow 1.20 3414393 19104424 0.6 0.2 2.137 3.025 Temperature
(ºC)
Less temp 28 3940195 21760337 0.5 0.5 2.854 4.356 Actual temp 30 3819929 22066321 0.4 1.2 2.371 3.688 More temp 32 3921278 21410909 0.6 0.1 2.364 3.347