Correspondence author: [email protected]
ISOLATION AND OPTIMIZATION OF INTER-SIMPLE SEQUENCE
REPEAT (ISSR) TECHNIQUE FOR PLEUROTUS SAJOR CAJU TOWARDS
ENVIROMENTAL STUDY IN SUPPORT OF THE COUNTRY’S NUCLEAR
POWER PROGRAMME
Rosnani Abdul Rashid, Azhar Mohamad, Mat Rasol Awang, Hassan Hamdani Mutaat,
Shaiful Azuar Mohamad, Affrida Abu Hasan, Mohd Meswan Maskom and Siti Khadijah Mohd Nahar
Division of Agrotechnology and Biosciences Malaysian Nuclear Agency
Bangi, 43000 Kajang, Selangor, Malaysia
ABSTRACT
Mushroom can be used as a biological indicator in assessing radiological impact on the environment. Radiological effect would be reflected through morphological changes as well as those changes at molecular level. For this purpose, a preliminary work was conducted, which included DNA isolation, optimization of PCR parameters for Inter-Simple Sequence Repeat (ISSR) and primers screening on Pleurotus sajor caju mushroom strains from Nuclear Malaysia’s Sterifeed Mushrooms Collection Centre. In this work, DNA isolation technique from cap and stalk of fruit body were optimized and quantified. It was found that stalk produced highest amount of genomic DNA at 304.01ng/µl and cap at 149.00ng/µl. A total of 100 ISSR primers were tested and 51 primers were successfully amplified. These primers will be used further for dose response evaluation and molecular profiling in mushroom species.
Keywords: Bioindicator, DNA isolation, Pleurotus sajor caju, Primer Inter-Simple Sequence Repeat, Radiological impact on environment, Sterifeed Mushrooms Collection Center.
INTRODUCTION
The Pleurotus sajor caju is a widely established cultivable mushroom species. The established tissue culture method for seed preparation and cultivable aspect of the mushroom would make it suitable to be used as bioindicator in the environmental monitoring of radiation area. The radiological effect on microorganism, particularly mushrooms, would be reflected in morphological changes as well as at the molecular level. The detection of this change, at molecular level is performed by a specific molecular marker that analyzed part of the whole genome information.
2
This paper reports works on optimization and selection of primers for the ISSR which was a part of the project on biological indicator and biosensor for environmental study to support the country’s Nuclear Power Programme. Besides plant and animal, fungi and mushrooms can also be used for that purpose. Selected mushrooms were of highly sensitive to radiation and easily be multiplied by spores or vegetative propagation. It is an advantage to use these mushrooms due to their short life cycle over plants or animals. The objectives of this work were to establish DNA extraction protocol specifically for mushroom samples and to establish ISSR primer for specific marker in P. sajor caju based on optimum annealing temperature. This work covered DNA extraction, DNA electrophoresis and quantification, primers selection, PCR optimization and screening for grey oyster mushroom P. sajor caju from our collection, Sterifeed Mushrooms Collection Center.
MATERIALS AND METHODS
Materials
The fruit body of grey oyster mushroom, P. sajor caju (Figure 1) used in this study was obtained from Sterifeed Mushrooms Collection Centre, Malaysian Nuclear Agency.
Fig.1: Pleurotus sajor caju
Method
DNA Isolation
3
minute. The cold mixture was centrifuged at 12000 rpm for 5 minutes at 4°C to afford DNA precipitate. The DNA pellet was washed with 100µl of 70% ethanol, dried and dissolved in 50-300µl of TE buffer. One volume of RNAse was added to the mixture, and then it was left at 37°C for 1 hour before used in electrophoresis and quantification.
DNA Electrophoresis and Quantification
The DNA quantification was performed by using Nanodrop Spectrophotometer and the purity was then determined by calculating the absorbance ratio at 260 nm to 280 nm (OD260/280). The separation of amplified fragments was performed on 1.5 % agarose gels run at 70 volt for 45 minutes. The images of DNA bands were taken by an automatic imaging system.
Primers Selection and PCR Optimization
One hundred ISSR primers were tested for their repeatable amplification on P. sajor caju samples. The lists of primers used in this study are presented in Table 1. The annealing temperatures used were in the range of 40 to 60˚C to determine the optimum temperature for PCR amplification. Primers with good amplification products were chosen for ISSR assay. For PCR gradient analysis, 25µl reaction master mix was placed in a thermo cycle machine (PTC200 DNA Engine Cycler, USA). consisted which of 2µl of template DNA, 1µl of 10mM dNTPs mixed, 1.5µl of 10mMMgCl2, 2µl of 10µM ISSR primers, 5µl 5X PCR buffer, 0.1µl Taq DNA polymerase and 13.4µl steril water. PCR amplification were initiated with hot start and followed by specific thermal cycles as follows single step of initial denaturation at 94˚C for 3 minutes followed by 30 cycles of 1 minute at 94˚C, 30s at different annealing temperature, 50s elongation at 72˚C and final extension at 72˚C for 7 minutes. The amplified products were separated by electrophoresis using 1.5 % agarose gel in 1X TBE for 30 minute and the DNA image fingerprints were evaluated by an automatic imaging system.
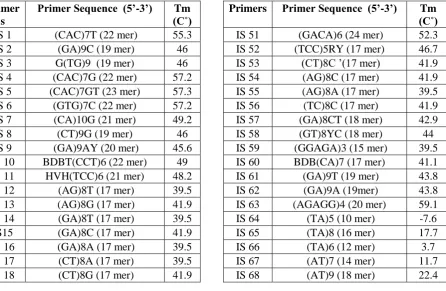
Table 1: List of ISSR primers and their respectively melting temperature
Primer s
Primer Sequence (5’-3’) Tm
(C˚) Primers Primer Sequence (5’-3’) (C˚) Tm
IS 1 (CAC)7T (22 mer) 55.3 IS 51 (GACA)6 (24 mer) 52.3
IS 2 (GA)9C (19 mer) 46 IS 52 (TCC)5RY (17 mer) 46.7
IS 3 G(TG)9 (19 mer) 46 IS 53 (CT)8C ’(17 mer) 41.9
IS 4 (CAC)7G (22 mer) 57.2 IS 54 (AG)8C (17 mer) 41.9
IS 5 (CAC)7GT (23 mer) 57.3 IS 55 (AG)8A (17 mer) 39.5
IS 6 (GTG)7C (22 mer) 57.2 IS 56 (TC)8C (17 mer) 41.9
IS 7 (CA)10G (21 mer) 49.2 IS 57 (GA)8CT (18 mer) 42.9
IS 8 (CT)9G (19 mer) 46 IS 58 (GT)8YC (18 mer) 44
IS 9 (GA)9AY (20 mer) 45.6 IS 59 (GGAGA)3 (15 mer) 39.5
IS 10 BDBT(CCT)6 (22 mer) 49 IS 60 BDB(CA)7 (17 mer) 41.1
IS 11 HVH(TCC)6 (21 mer) 48.2 IS 61 (GA)9T (19 mer) 43.8
IS 12 (AG)8T (17 mer) 39.5 IS 62 (GA)9A (19mer) 43.8
IS 13 (AG)8G (17 mer) 41.9 IS 63 (AGAGG)4 (20 mer) 59.1
IS 14 (GA)8T (17 mer) 39.5 IS 64 (TA)5 (10 mer) -7.6
IS15 (GA)8C (17 mer) 41.9 IS 65 (TA)8 (16 mer) 17.7
IS 16 (GA)8A (17 mer) 39.5 IS 66 (TA)6 (12 mer) 3.7
IS 17 (CT)8A (17 mer) 39.5 IS 67 (AT)7 (14 mer) 11.7
4
IS 19 (CT)8T (17 mer) 39.5 IS 69 (TGG)5 (15 mer) 42.2
IS 20 (CA)8A (17 mer) 39.5 IS 70 (GAA)6 (18 mer) 36.1
IS 21 (CA)8G (17 mer) 41.9 IS 71 (AG)7 (14 mer) 32.2
IS 22 (GT)8A (17 mer) 39.5 IS 72 (GTC)5 (15 mer) 42.2
IS 23 (GT)8C (17 mer) 41.9 IS 73 (CT)8 (16 mer) 38.2
IS 24 (GT)8T (17 mer) 39.5 IS 74 (CT)14 (28 mer) 56.3
IS 25 (TC)8A (17 mer) 39.5 IS 75 (CTT)5 (15 mer) 28.6
IS 26 (GT)9C (19 mer) 46 IS 76 (CCG)6 (18 mer) 63.4
IS 27 (GT)7GGTG (18 mer) 45.2 IS 77 (AT)5 (AAT)7 - (31 mer) 38.1
IS 28 (AC)8T (17 mer) 39.5 IS 78 (AGA)7 (21 mer) 41.4
IS 29 (AC)8C (17 mer) 41.9 IS 79 (TC)11 (22 mer) 49.7
IS 30 (AC)8G (17 mer) 41.9 IS 80 (AAT)8 (24 mer) 31.8
IS 31 (TG)8A (17 mer) 39.5 IS 81 (AG)5T (11 mer) 17.2
IS 32 (TG)8G (17 mer) 41.9 IS 82 (AG)5TT (12 mer) 20.7
IS 33 (AG)8YT (18 mer) 41.8 IS 83 (AG)5TTG (13 mer) 26.9
IS 34 (GA)8YT (18 mer) 41.8 IS 84 C(AG)5 (11 mer) 20.9
IS 35 (CT)8RA (18 mer) 41.8 IS 85 (CT)5CACC (14 mer) 35.1
IS 36 (CT)8RC (18 mer) 44 IS 86 (GT)5GA (12 mer) 24.2
IS 37 (CA)8RT (18 mer) 41.8 IS 87 (AATGC)3AAT -(18 mers) 36.1
IS 38 (CA)8RC (18 mer) 44 IS 88 (AG)8T (17 mer) 39.5
IS 39 (GT)8YA (18 mer) 41.8 IS 89 (AG)8C (17 mer) 41.9
IS 40 (GT)8YG (18 mer) 44 IS 90 (AG)8G (17 mer) 41.9
IS 41 (TC)8RT (18 mer) 41.8 IS 91 (CA)8T (17 mer) 39.5
IS 42 (AC)8YG (18 mer) 44 IS 92 (CA)8C (17 mer) 41.9
IS 43 (AC)8YA (18 mer) 41.8 IS 93 (AGC)6 (18 mer) 49.7
IS 44 (AC)8YT (18 mer) 41.8 IS 94 (ATG)6 (18 mer) 36.1
IS 45 (TG)8RT (18 mer) 41.8 IS 95 (GATA)4 (16 mer) 28.0
IS 46 (TG)8RC (18 mer) 44 IS 96 (GACA)4 (16 mer) 38.2
IS 47 (ACC)6 (18 mer) 49.7 IS 97 (GATA)3GACA (20 mer) 30.5
IS 48 (ATG)8 (24 mer) 45.4 IS 98 (GAT)4A (13 mer) 20.6
IS 49 (CTC)6 (18 mer) 49.7 IS 99 (GAT)4T (13 mer) 20.6
IS 50 (GAA)6 (18mer) 36.1 IS 100 (GAT)4G (13 mer) 23.7
B=C, G, T; D= A, G, T; H= A, C, T; R= A, G; V=A, C, G and Y=C, T
RESULTS AND DISCUSSION
DNA Isolation
5
Table 2: Amount of genomic DNA extracted using CTAB method
Sample Replicates
Average DNA concentration
(ng/ µl)
Average OD260/280
Stalk 4 177.7 + 49.41 1.9 + 0.20
Cap 4 113.1 + 17.94 1.8 + 0.13
DNA Electrophoresis and Quantification
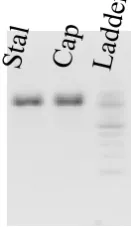
The isolated DNA from stalk and cap of P. sajor caju are shown in Figure 2. For agarose gel electrophoresis, 1X Tris borate EDTA (TBE) buffer was used. TBE has a higher buffering capacity and lower conductivity than Tris acetate EDTA (TAE).
Fig 2: Quality of genomic DNA isolated from stalk and cap of P. sajor caju separated on 1.5% agarose gel.
The OD260/280 ratio of isolated DNA from CTAB method was typically between 1.59 to 2.03 for stalk and 1.67 to 1.94 for cap (Table 3). The acceptable OD260/280 ratio varied from 1.8 to 2.0. For PCR analysis, stalk sample was chosen due to its OD ratio values fall within the range of 1.8 to 2.0.
Primers Selection and PCR Optimization
6
Table 3: Optimum annealing temperature for ISSR primers
Annealing Temperature (°C) Total Primers ISSR Primers 45.5 46.0 46.9 47.9 49.2 50.5 52.3 54.1 57.0 57.9 59.5 5 4 9 4 7 4 5 2 2 3 6
1, 15, 55, 89, 91 28, 31, 58, 100
21, 33, 34, 36, 38, 65, 79, 90, 99 5, 44, 45, 96
7, 16, 39, 40, 42, 43, 59 20, 22, 54, 60
2, 12, 13, 29, 30 6, 32
49, 57 27, 63, 69
4, 10, 11, 46, 47, 98
Lane
1 2 3 4 5 6 7 8 9
Fig. 3: Electrophoresis result of PCR gradient for primer IS 20. Lane 1: 60°C, lane 2: 58.9°C, lane 3: 57.0°C, lane 4: 54.1°C, lane 5: 50.5°C, lane 6: 47.9°C, lane 7: 46.0°C, lane 8: 45.0°C and
lane 9: Ladder
The amplified bands for fifty one of ISSR primers are shown in Table 4. Only clear and well visible bands were considered for best evaluation such as in figure 3. From table 4, a total of 396 bands were amplified with mean 7.76 were amplified by each primer. It was also found that 26 out of 51 primers have above 7 amplified bands with the highest been obtained from primer IS 29 and IS 49 which 20 amplified bands. Our results shows, the content of nitrogen base in primers do not show relationship with the number of amplified band.
Table 4: Percentage of amplified bands and G, A, T and C content for ISSR primers
Primer name
Primer sequence
(5’-3’) temperature Annealing
Number of amplified
bands
Percentage of
G A T C
IS 1 (CAC)7T (22 mer) 45.5 4 0 31.8 4.5 63.6
IS 2 (GA)9C (19 mer) 52.3 10 47.4 47.4 0 5.3
IS 4 (CAC)7G (22 mer) 59.5 16 4.5 31.8 0 63.6
IS 5 (CAC)7GT (23 mer) 47.9 4 4.3 30.4 4.3 60.9
7
IS 7 (CA)10G (21 mer) 49.2 4 4.8 47.6 0 47.6
IS 10 BDBT(CCT)6 (20 mer) 59.5 12 122.7 40.9 231.8 136.4
IS 11 HVH(TCC)6 (21 mer) 59.5 8 42.9 128.6 114.3 177.3
IS 12 (AG)8T (17 mer) 52.3 9 47.1 47.1 5.9 0
IS 13 (AG)8G (17 mer) 52.3 4 52.9 47.1 0 0
IS15 (GA)8C (17 mer) 45.5 6 47.1 47.1 0 5.9
IS 16 (GA)8A (17 mer) 49.2 6 47.1 52.9 0 0
IS 20 (CA)8A (17 mer) 50.5 4 0 52.9 0 47.1
IS 21 (CA)8G (17 mer) 46.9 3 5.9 47.1 0 47.1
IS 22 (GT)8A (17 mer) 50.5 3 47.1 5.9 47.1 0
IS 27 (GT)7GGTG (18 mer) 57.9 18 55.6 0 44.4 0
IS 28 (AC)8T (17 mer) 46.0 3 0 47.1 5.9 47.1
IS 29 (AC)8C (17 mer) 52.3 20 0 47.1 0 52.9
IS 30 (AC)8G (17 mer) 52.3 13 5.9 47.1 0 47.1
IS 31 (TG)8A (17 mer) 46.0 9 47.1 5.9 47.1 0
IS 32 (TG)8G (17 mer) 54.1 18 52.9 0 47.1 0
IS 33 (AG)8YT (18 mer) 46.9 5 44.4 44.4 11.1 5.6
IS 34 (GA)8YT (18 mer) 46.9 3 44.4 44.4 11.1 5.6
IS 36 (CT)8RC (18 mer) 46.9 2 5.6 5.6 44.4 50
IS 38 (CA)8RC (18 mer) 46.9 12 5.6 50 0 50
IS 39 (GT)8YA (18 mer) 49.2 8 44.4 5.6 50 5.6
IS 40 (GT)8YG (18 mer) 49.2 4 50 0 50 5.6
IS 42 (AC)8YG (18 mer) 49.2 9 5.6 44.4 5.6 50
IS 43 (AC)8YA (18 mer) 49.2 11 0 50 5.6 50
IS 44 (AC)8YT (18 mer) 47.9 2 0 44.4 11.1 50
IS 45 (TG)8RT (18 mer) 47.9 10 50 5.6 50 0
IS 46 (TG)8RC (18 mer) 59.5 9 50 5.6 44.4 5.6
IS 47 (ACC)6 (18 mer) 59.5 8 0 33.3 0 66.7
IS 49 (CTC)6 (18 mer) 57.0 20 0 0 33.3 66.7
IS 54 (AG)8C (17 mer) 50.5 16 47.1 47.1 0 5.9
IS 55 (AG)8A (17 mer) 45.5 3 47.1 52.9 0 0
IS 57 (GA)8CT (18 mer) 57.0 3 44.4 44.4 5.6 5.6
IS 58 (GT)8YC (18 mer) 46.0 8 44.4 0 50 11.1
IS 59 (GGAGA)3 (15 mer) 49.2 6 60 40 0 0
IS 60 BDB(CA)7 (17 mer) 50.5 4 158.8 94.1 264.7 147.0
IS 63 (AGAGG)4 (20 mer) 57.9 9 60 40 0 0
IS 65 (TA)8 (16 mer) 46.9 4 0 50 50 0
IS 69 (TGG)5 (15 mer) 57.9 8 66.7 0 33.3 0
IS 79 (TC)11 (22 mer) 46.9 8 0 0 50 50
IS 89 (AG)8C (17 mer) 45.5 3 47.1 47.1 0 5.9
IS 90 (AG)8G (17 mer) 46.9 9 52.9 47.1 0 0
IS 91 (CA)8T (17 mer) 45.5 12 0 47.1 5.9 47.1
IS 96 (GACA)4 (16 mer) 47.9 6 25 50 0 25
IS 98 (GAT)4A (13 mer) 59.5 3 30.8 38.5 30.8 0
IS 99 (GAT)4T (13 mer) 46.9 10 30.8 30.8 38.5 0
IS 100 (GAT)4G (13 mer) 46.0 2 38.5 30.8 0 30.8
CONCLUSION
8
annealing temperature was between 45.5 to 59.5°C. It was also found that 51 out of 100 primers were possible for that ISSR assay of P. sajor caju. The most suitable primers were used for P. sajor caju are IS 29 and IS 49 based on numbers of amplified bands.
This result suggested a possibility of using ISSR primers for identification of P. sajor caju specifically and other mushroom in general. This includes identification of all mushrooms collection in Sterifeed Mushroom Culture Collection. This finding also implied that other wild mushroom species in the environment could be identified and hence the technique can be equally applied to detect mushroom affected by radiation. This knowledge and skills developed would be beneficial to the environmental study on the effect of radiation on microflora in the vicinity of radiation facility which supports the country’s Nuclear Power Programme.
REFERENCES
Charters Y. M., Robertson A., Wilkinson M. J. and Ramsay G. (1996). PCR analysis of oil seed rape cultivars (Brassica oleracea L. ssp. oleifera) using 5’-anchored simple sequence repeat (SSR) primers. Theor. Appl. Genet., 92, 442-447.
Kantety R. V., Zeng X., Bennetzen J. L. and Zehr B. (1995). Assessment of genetic diversity in dent and popcorn (Zea mays L.) inbred lines using inter-simple sequence repeat (ISSR) amplification.
Mol. Breed., 1, 365-373.
Provan J., Powell W. and Waugh R. (1996). Analysis of cultivated potato (Solanum tuberosum) using inter-micro-satellite amplification. Genome, 39, 767-769.
Tsumura Y., Ohba K. and Strauss S. H. (1996). Diversity and inheritance of inter-simple sequence repeat polymorphisms in Douglas fir (Pseudotsuga menziesii) and sugi (Cryptomeria japonica).
Theor. Appl. Genet., 92, 40-45.
Zietkie-wicz E., Rafalski A. and Labuda D. (1994). Genome fingerprinting by simple-sequence repeat (SSR) anchored polymerase chain reaction amplification. Genomics, 20,176-183. In: Reddy K.D.,
Nagaraju J. J. and Abraham E. G. (1999).Genetic characterization of the silkworm Bombyx mori by