ISSN: 1735-0344 Tanaffos 2018; 17(4): 233-240
Estimating of Net Transition Probabilities in Triple Stages
of Cigarette Consumption in Iranian Men
Mahshid Aryanpur 1, Ahmad Khosravi 2,
Mahmoud Yousefifard 3, Mostafa
Hosseini4, Alireza Oraii 5, Gholamreza
Heydari 1, Mehdi Kazempour-Dizaji 6,
Hooman Sharifi 1, Zahra Hessami 1,
Hamidreza Jamaati 1
Background: The present study was designed to estimate the net transition probabilities in triple stages of cigarette consumption in Iranian men over 15 years old.
Materials and Methods: Data from the national surveillance of risk factors of non-communicable diseases in 2011 were entered in the present study. Data of 3130 Iranian men between the ages of 15 and 69 years old were included. Individuals were divided to three groups of current smoker, past smoker and nonsmoker based on cigarette consumption. Afterwards, net transition probability of different stages of cigarette consumption over a year was assessed.
Results: Net transition probability from nonsmoker to smoker was at its highest level until 30 years of age at 19.1 per 1000 men and then net transition reduces to reach zero per 1000 men at the age of 45 years old. However, net transition probability from smoker to nonsmoker was at a very low level until 45 years of age but, it increases afterwards to reach a plateau at the age of 64 years old. Net transition probability from smoker to nonsmoker is estimated to be 23.1 per 1000 men at the age of 69 years old.
Conclusion: For the first time, the present study has estimated the transition probabilities in different stages of cigarette consumption in Iranian adults. Findings showed that risk of becoming a smoker in younger individuals is much higher than the risk in middle-aged and old population. However, tendency to quit smoking is increased after the age of 45 years old. Therefore, health policy makers should concentrate on younger age groups in their preventive strategies regarding control of tobacco consumption.
Key words:
Smoking; Tobacco; Tobacco Use; Epidemiology;
Prevalence
1 Tobacco Prevention and Control Research Center, National Research Institute of Tuberculosis and Lung Diseases (NRITLD), Shahid Beheshti University of Medical Sciences, Tehran, Iran, 2 Department of Epidemiology, School of Public Health, Shahroud University of Medical Sciences, Shahroud, Iran, 3 Physiology Research Center, Faculty of Medicine, Iran University of Medical Sciences, Tehran, Iran, 4 Department of Epidemiology and Biostatistics, School of Public Health, Tehran University of Medical Sciences, Tehran, Iran, 5 Department of Medicine, Tehran University of Medical Sciences, Tehran, Iran, 6 Mycobacteriology Research Center, Biostatistics Unit, NRITLD, Shahid Beheshti University of Medical Sciences, Tehran, Iran.
Received: 24 February 2018 Accepted: 28 August 2018
Correspondence to: Hosseini M Address: Department of Epidemiology and Biostatistics, School of Public Health, Tehran University of Medical Sciences, Tehran, Iran Email address: [email protected]
INTRODUCTION
Assessing the transition of individuals between different groups of cigarette consumption in a time period is defined as transition probability which has a great importance in health policy making systems (1). With the help of the mentioned concept, it can be predicted that how many nonsmokers will become smoker and how many will quit
smoking in the following year or longer time periods. Future cigarette consumption status of the country can be acknowledged based on mentioned estimations and such measures will help health policy makers in application of preventive strategies (2, 3).
Cigarette smoking is considered the most important preventable risk factor of death across the world. Cigarette
smoking is the risk factor of many diseases such as cancer, cardiovascular diseases, pulmonary fibrosis, and many other non-communicable diseases (4-7). Relative risk of getting a cancer is 23 times greater in smokers compared to nonsmokers (4,6). Cigarette smoking is responsible for the death of more than half of its long-term consumers as almost 5 million adults lost their lives due to cigarette smoking in 2000 (about 12% of all deaths in 2000) and this amount is estimated to reach 8.3 million individuals in 2030. Seventy percent of these deaths occurred in developing countries (4). World Health Organization (WHO) estimates that there are 1.3 billion smokers across the world consisting one third of population over 15 years old which will ultimately reach 2 billion people if the mentioned pattern of cigarette smoking remains until 2030 (8). Cigarette smoking prevalence in Iran is reported to be about 19% in men and 1.5% in women with a total prevalence of 11.9% in Tehran and 12.5% across the country (9, 10).
Cigarette consumption is divided into three stages in an epidemiological view including current smokers, past smokers and nonsmokers. Individuals who have smoked at least 100 cigarettes either daily or occasionally are considered current smokers. Individuals who were used to smoke in a daily manner and have quitted are considered past smoker and individuals who have not smoked a cigarette are considered nonsmokers (1).
Although there are many studies across the world assessing cigarette smoking and its different consumption stages (1, 11-15), there are no studies assessing net transition probability in different stages of cigarette consumption in Iranian adults. Hence, the goal of the present study was to estimate the net transition probabilities in triple stages of cigarette consumption in Iranian men using data from the national surveillance of risk factors of non-communicable diseases in 2011.
MATERIALS AND METHODS
Study setting and participants
Data from the national surveillance of risk factors of non-communicable diseases in 2011 were entered (3130 men
between the ages of 15 and 69 years old). In the national surveillance of risk factors of non-communicable diseases in 2011, data of 7510 people were gathered in a systematic approach and multi-stage cluster sampling using databases of geography department and postal codes of Iran’s post company. Distribution of selected clusters was proportionate to the number of households in different postal areas of the state and also population ratio of cities and villages. Minimum sample size was 200 individuals in the least populated state of the country and maximum sample size was 800 individuals in state samples. Data of cigarette consumption status of 3130 men between the ages of 15 and 69 years old was recorded. In the mentioned sampling, four age groups of 25 to 34, 35 to 44, 45-54 and 55 to 64 years old were selected including equal number of men and women. Technical committee of world health organization suggests at least 1000 individuals for the mentioned age and sex based groupings. Hence, sample size in mentioned groups is more than 1000 in the present study.
Variables
Data cleaning was performed before analysis of gathered data. Data cleaning needs to be highly accurate and its correct application leads us to more reliable results. Hence, the accuracy of entering data and amount of missing were assessed. The way of entering data was the first source of error. The mentioned error which is a common problem in large databases was assessed. Therefore, frequency of data of each variable was obtained first and then minimum and maximum amounts of each column were assessed. This method gave us the opportunity to get a quick look at the data. In addition, both very high and very low amounts which could not be attributed to cigarette smoking were evaluated. At the end, the amount of missing data was specified. The amount of observed missing was less than 0.6% which could be ignored. Statistical analyses were done when accuracy of data was assured.
measured. Prevalence of different cigarette consumption stages in the population was assessed.
Individuals over 15 years old were categorized into 3 stages based on cigarette consumption. Individuals who have smoked either daily or occasionally are considered current smokers. Individuals who were used to smoke in a daily manner and have quitted in the present day are considered past smoker and individuals who have not smoked a cigarette (including its different kinds such as factory cigarettes, hand-made cigarettes and cigars) are considered nonsmokers.
Outcome
Net transition probability in different stages of cigarette consumption was the most important assessed outcome of the present study. Net transition describes the differences between inflow and outflow from one state to another state. In the present study, movement of individuals between different stages of cigarette consumption within a year was defined as transition.
Statistical analyses
Data analysis was performed using R software. Estimation of net transition probabilities in three stages of nonsmoker, current smoker and past smoker was performed in two steps. In the first step, specific age prevalence of three stages of nonsmoker, current smoker and past smoker were smoothed and in the second step, net transition probabilities in different stages was estimated with the help of methods used for solving transportation problems. Methodology of estimating the net transition probabilities are fully explained in the study by Kassteele et al. (16). Briefly in the first step, age specific prevalence of triple stages of cigarette consumption in study population was smoothed using a multinomial p-spline method. Noise reduction in probabilities in the triple stages of cigarette consumption was the goal of the mentioned step. In the second step, transition probability was estimated by the help of idea used in solving transportation problems. Estimations are minimized using methods used in operation research models in order to increase the power of estimated transitions. In the mentioned method, smoothed prevalence
of different stages in two consecutive years was used to estimate net transition probability. These estimations were done based on the two following assumptions:
A) Net Transition probabilities between triple stages are stable between two consecutive ages over time. We assumed that sudden jumps between consecutive ages in the terms of transitional probabilities are unlikely, B) Changes among the smoothed prevalence of triple stages of cigarette consumption between two consecutive ages are similar to transition probabilities among the triple stages of cigarette consumption after a year increase in age. It means that one year transitional probability for 15 years old subjects is similar to differences between smoothed prevalence of smoking stages of 15 and 16 years old subjects.
After accepting mentioned assumptions, number of individuals in two consecutive ages can be used for estimations. As number of individuals in two consecutive ages is not always equal in a cross-sectional study, we used change as prevalence share of each stage in two consecutive ages. Hence, sum of prevalence shares of all stages equals to one. Kassteele and colleagues (16) address that actual prevalence of stages of cigarette consumption is a smoothed function based on age.
Net transition (𝝉𝝉𝒊𝒊𝒊𝒊) is positive and above zero for
defined stages as retrograde net transition does not exist (meaning that transition from smoker to nonsmoker does not exist). Net transition from stage i at the age of a-1 to stage j at the age of a (𝝉𝝉𝒊𝒊𝒊𝒊≥ 𝟎𝟎). Hence, net transition of τij′ equals:
𝝉𝝉′𝒊𝒊𝒊𝒊�𝝉𝝉𝟎𝟎𝒊𝒊𝒊𝒊 − 𝝉𝝉𝒊𝒊𝒊𝒊𝒐𝒐𝒐𝒐𝒐𝒐𝒐𝒐𝒐𝒐𝒐𝒐𝒊𝒊𝒐𝒐𝒐𝒐 𝝉𝝉𝒊𝒊𝒊𝒊>𝝉𝝉𝒊𝒊𝒊𝒊
In the second step with the help of transportation problem, net transition was defined as decision variable, smoothed prevalence of age a-1 as supply, smoothed prevalence of age as demand and transition matrix (Cij) as
and advancing two steps forward in stages costs. In other words, when a nonsmoker becomes a smoker it costs less than when a nonsmoker becomes a smoker after a year and then transits to being a past smoker (transition has occurred in two steps in the latter).
𝑚𝑚𝑚𝑚𝑚𝑚 𝑗𝑗= � � 𝑐𝑐𝑖𝑖𝑖𝑖𝜏𝜏𝑖𝑖𝑖𝑖′ 𝑘𝑘
𝑖𝑖=1 𝑘𝑘
𝑖𝑖=1
RESULTS
Data of 3130 men over 15 years old were entered. Mean age was 40.6±0.25 years old. Mean age of the beginning of cigarette smoking was 24.0 years old (95%CI: 22.9-25.0). Cigarette consumption had a prevalence of 21.1% among men (95%CI: 19.9-22.4) and prevalence of individuals who had quitted smoking was 7.1% (95%CI: 6.3-7.9). The highest prevalence of cigarette consumption was observed in the age group of 35 to 64 years old. Table 1 shows different stages of cigarette consumption based on age groups.
Table 1. Observed prevalence of smoking stages in population
Age group Nonsmoker
(95% CI)
Smoker (95% CI)
Past smoker (95% CI)
15-24 91.2 (89.3-92.8) 6.3 (4.9-7.9) 2.5 (1.7-3.7)
25-34 74.9 (72.1-77.6) 21.4 (18.9-24.1) 3.4 (2.7-5.1)
35-44 59.6 (55.6-63.4) 33.7 (30.0-37.6) 6.7 (5.0-9.0)
45-54 60.3 (56.0-64.5) 28.8 (25.0-32.9) 10.8 (8.4-13.9)
55-64 63.0 (60.0-65.9) 25.1 (22.5-27.9) 11.9 (10.0-14.0)
65-70 68.2 (63.3-73.7) 19.6 (15.5-24.6) 11.7 (8.5-16.0)
Total 71.8 (70.4-73.1) 21.1 (19.9-22.4) 7.1 (6.3-7.9)
Data are presented as percentage with 96% confidence interval (95% CI).
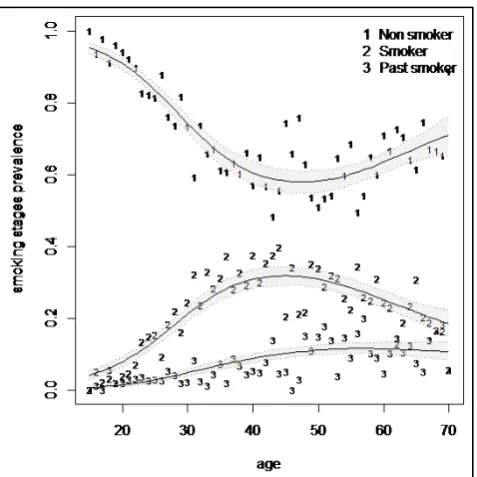
Smoothed prevalence of triple stages of cigarette consumption is depicted in figure 1 for age specific prevalence in Iranian men. As shown, prevalence of cigarette smoking has had an increasing trend until the age of 45 years old and then the prevalence of cigarette consumption has slowly decrease after the age of 45 years old. Number of past smokers has had a slowly increasing trend until the age of 50 years old and then has reached a plateau.
Figure 1. Trend of smoothed prevalence of smoking stages in studied
population
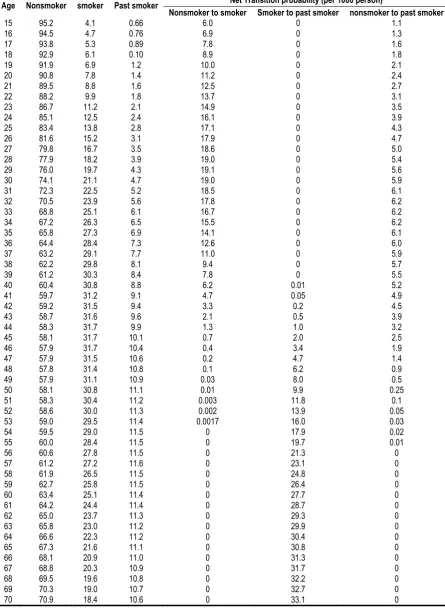
Table 2. Age adjusted smoothed prevalence (%) of smoking stages in population
Age Nonsmoker smoker Past smoker Net Transition probability (per 1000 person)
Nonsmoker to smoker Smoker to past smoker nonsmoker to past smoker
15 95.2 4.1 0.66 6.0 0 1.1
16 94.5 4.7 0.76 6.9 0 1.3
17 93.8 5.3 0.89 7.8 0 1.6
18 92.9 6.1 0.10 8.9 0 1.8
19 91.9 6.9 1.2 10.0 0 2.1
20 90.8 7.8 1.4 11.2 0 2.4
21 89.5 8.8 1.6 12.5 0 2.7
22 88.2 9.9 1.8 13.7 0 3.1
23 86.7 11.2 2.1 14.9 0 3.5
24 85.1 12.5 2.4 16.1 0 3.9
25 83.4 13.8 2.8 17.1 0 4.3
26 81.6 15.2 3.1 17.9 0 4.7
27 79.8 16.7 3.5 18.6 0 5.0
28 77.9 18.2 3.9 19.0 0 5.4
29 76.0 19.7 4.3 19.1 0 5.6
30 74.1 21.1 4.7 19.0 0 5.9
31 72.3 22.5 5.2 18.5 0 6.1
32 70.5 23.9 5.6 17.8 0 6.2
33 68.8 25.1 6.1 16.7 0 6.2
34 67.2 26.3 6.5 15.5 0 6.2
35 65.8 27.3 6.9 14.1 0 6.1
36 64.4 28.4 7.3 12.6 0 6.0
37 63.2 29.1 7.7 11.0 0 5.9
38 62.2 29.8 8.1 9.4 0 5.7
39 61.2 30.3 8.4 7.8 0 5.5
40 60.4 30.8 8.8 6.2 0.01 5.2
41 59.7 31.2 9.1 4.7 0.05 4.9
42 59.2 31.5 9.4 3.3 0.2 4.5
43 58.7 31.6 9.6 2.1 0.5 3.9
44 58.3 31.7 9.9 1.3 1.0 3.2
45 58.1 31.7 10.1 0.7 2.0 2.5
46 57.9 31.7 10.4 0.4 3.4 1.9
47 57.9 31.5 10.6 0.2 4.7 1.4
48 57.8 31.4 10.8 0.1 6.2 0.9
49 57.9 31.1 10.9 0.03 8.0 0.5
50 58.1 30.8 11.1 0.01 9.9 0.25
51 58.3 30.4 11.2 0.003 11.8 0.1
52 58.6 30.0 11.3 0.002 13.9 0.05
53 59.0 29.5 11.4 0.0017 16.0 0.03
54 59.5 29.0 11.5 0 17.9 0.02
55 60.0 28.4 11.5 0 19.7 0.01
56 60.6 27.8 11.5 0 21.3 0
57 61.2 27.2 11.6 0 23.1 0
58 61.9 26.5 11.5 0 24.8 0
59 62.7 25.8 11.5 0 26.4 0
60 63.4 25.1 11.4 0 27.7 0
61 64.2 24.4 11.4 0 28.7 0
62 65.0 23.7 11.3 0 29.3 0
63 65.8 23.0 11.2 0 29.9 0
64 66.6 22.3 11.2 0 30.4 0
65 67.3 21.6 11.1 0 30.8 0
66 68.1 20.9 11.0 0 31.3 0
67 68.8 20.3 10.9 0 31.7 0
68 69.5 19.6 10.8 0 32.2 0
69 70.3 19.0 10.7 0 32.7 0
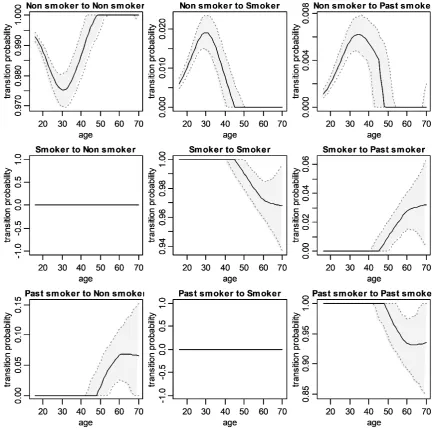
Figure 2. Net Transition probability among smoking stages in Iranian men.
DISCUSSION
The present study showed that net transition probability from nonsmoker to smoker reaches its maximum at the age of 30 years old and reduces afterwards to reach zero at the age of 45 years old. Net transition probability from current smoker to nonsmoker is very low until the age of 45 years old but, the mentioned probability increases to reach a plateau at the age of 64 years old. These findings indicate that most changes in tendency to cigarette smoking occur
before the age of 45 years old. Hence, health policy makers should concentrate on younger age groups in their preventive strategies regarding control of cigarette consumption.
estimating transition probability in different stages of cigarette consumption in Iranian adolescents, it was shown that the probability of nonsmoker boys becoming smoker is 8.9-fold greater compared to same aged girls (1). Similar to the present study, Fotouhi et al. showed that prevalence of cigarette consumption is significantly lower in ages above 55 years old (9). This finding is concordant with other studies reporting that tobacco consumption usually increases until 5th and 6th decade of life (17-20) and then decreases (6,19). On the other hand, prevalence of individuals quitting cigarette smoking increases in higher ages (17,19).
Probability of staying in a stage of cigarette consumption until the next time period is considered probability of staying and if transition to another stage happens it is considered probability of transition. Estimation of these transition probabilities is done using longitudinal studies assessing cigarette consumption status in different stages in a repetitive manner. However, less longitudinal studies are conducted due to their time consuming nature, high cost, problems regarding follow ups and accuracy of answers regarding cigarette consumption (1). Therefore, statistical methodology used in the present study has created an artificial longitudinal cohort based on data of a cross-sectional study in order to overcome limitations of a longitudinal study (16).
CONCLUSION
For the first time, the present study has estimated the transition probability in different stages of cigarette consumption in Iranian adults. The present study which has used data of the national surveillance of risk factors of non-communicable diseases showed that probability of becoming a smoker reaches its maximum at the age of 30 years old and then net transition decreases to reach zero at almost the age of 45 years old. In addition, tendency to quit smoking is increased after the age of 45 years old compared to younger ages. Therefore, health policy makers should concentrate on younger age groups in their preventive strategies regarding control of tobacco consumption.
Acknowledgement
We appreciate the help of Dr. Kassteele for giving the codes used for analysis of net transition probability to the authors of the present study. We also thank the non-communicable diseases risk factor surveillance Office, Center for non-communicable diseases Control & Management, Center for Disease Control (CDC) and Iranian Ministry of Health and Medical Education for using this invaluable data.
REFERENCES
1. Khosravi A, Mansournia MA, Mahmoodi M, Pouyan AA, Holakouie-Naieni K. Estimating the Transitional Probabilities of Smoking Stages with Cross-sectional Data and 10-Year Projection for Smoking Behavior in Iranian Adolescents. Int J Prev Med 2016;7:101.
2. Mohammadpoorasl A. Increasing the Trend of Smoking in Iranian Adolescents. Iran J Public Health 2013;42(10):1197-8. 3. Mohammadpoorasl A, Nedjat S, Yazdani K, Fakhari A,
Foroushani AR, Fotouhi A. An algorithm of smoking stages assessment in adolescents: a validation study using the latent class analysis model. Int J Prev Med 2013;4(11):1304-11. 4. Garcia M, Jemal A, Ward EM, Center MM, Hao Y, Siegel RL,
Thun MJ. Global Cancer Facts & Figures 2007. Atlanta, GA:
American Cancer Society, 2007. Т. 2007;1:52.
5. Parkin DM, Bray F, Ferlay J, Pisani P. Global cancer statistics, 2002. CA Cancer J Clin 2005;55(2):74-108.
6. Masjedi MR, Naghan PA, Taslimi S, Yousefifard M, Ebrahimi SM, Khosravi A, et al. Opium could be considered an independent risk factor for lung cancer: a case-control study.
Respiration 2013;85(2):112-8.
7. Saadat S, Yousefifard M, Asady H, Moghadas Jafari A, Fayaz M, Hosseini M. The Most Important Causes of Death in Iranian Population; a Retrospective Cohort Study. Emerg (Tehran)
2015;3(1):16-21.
8. World Health Organisation, Report on the Global Tobacco Epidemic 2009, In The MPOWER package Geneva.
10. Meysamie A, Ghaletaki R, Haghazali M, Asgari F, Rashidi A, Khalilzadeh O, et al. Pattern of tobacco use among the Iranian adult population: results of the national Survey of Risk Factors of Non-Communicable Diseases (SuRFNCD-2007). Tob Control
2010;19(2):125-8.
11. Khosravi A, Holakouie-Naieni K, Mansournia MA, Mahmoodi M, Pouyan AA. Predictors of transition in smoking stages in Iranian adolescents: a probabilistic discrete event system model. Iranian Journal of Psychiatry and Behavioral Sciences
2017;11(2): e7670.
12. Tucker JS, Ellickson PL, Klein DJ. Predictors of the transition to regular smoking during adolescence and young adulthood. J Adolesc Health 2003;32(4):314-24.
13. White HR, Bray BC, Fleming CB, Catalano RF. Transitions into and out of light and intermittent smoking during emerging adulthood. Nicotine Tob Res 2009;11(2):211-9.
14. Chen X, Lin F. Estimating Transitional Probabilities with Cross-Sectional Data to Assess Smoking Behavior Progression: A Validation Analysis. J Biom Biostat 2012;Suppl 1. pii: 004. 15. Lin F, Chen X. Estimation of Transitional Probabilities of
Discrete Event Systems from Cross-Sectional Survey and its
Application in Tobacco Control. Inf Sci (N Y) 2010;180(3):432-440.
16. Kassteele Jv, Hoogenveen RT, Engelfriet PM, Baal PH, Boshuizen HC. Estimating net transition probabilities from cross-sectional data with application to risk factors in chronic disease modeling. Stat Med 2012;31(6):533-43.
17. Sreeramareddy CT, Pradhan PM. Prevalence and Social Determinants of Smoking in 15 Countries from North Africa, Central and Western Asia, Latin America and Caribbean: Secondary Data Analyses of Demographic and Health Surveys.
PLoS One 2015;10(7):e0130104.
18. Hamrah MS, Harun-Or-Rashid M, Hirosawa T, Sakamoto J, Hashemi H, Emamian MH, et al. Smoking and associated factors among the population aged 40-64 in Shahroud, Iran.
Asian Pac J Cancer Prev 2013;14(3):1919-23.
19. Emami H, Habibian S, Salehi P, Azizi F. Pattern of smoking habit in an urban area in tehran, 2001 tehran glucose and lipid study. Pajouhesh Dar Pezeshki 2003;27(1): 47-52.