© Universiti Tun Hussein Onn Malaysia Publisher’s Office
IJIE
Journal homepage:http://penerbit.uthm.edu.my/ojs/index.php/ijie
ISSN : 2229-838X e-ISSN : 2600-7916
The International
Journal of
Integrated
Engineering
Density Functional Theory Study of Water Adsorption on the
CoO (100) and CoO (110) Surfaces
Salihah Azemi
1, Khuzaimah Arifin
2,*, Rozan Mohamad Yunus
2, Sharifah Najiha
Timmiati
21School of Applied Physics, Faculty of Science and Technology, Universiti Kebangsaan Malaysia 43600 UKM Bangi, Selangor, MALAYSIA
2Fuel Cell Institute, Universiti Kebangsaan Malaysia 43600 UKM Bangi, Selangor, MALAYSIA *Corresponding Author
DOI: https://doi.org/10.30880/ijie.2019.11.07.030
Received 16 July 2019; Accepted 20 October 2019; Available online 15 November 2019
Abstract: In this study, density functional theory was used to identify the optimum adsorption sites of H2O molecule on the CoO(100) and CoO(110) surfaces. The adsorption of H2O molecule is the first step in water molecule splitting on a catalytic surface. CoO bulk crystals were optimised by using generalised gradient approximation-Perdew–Burke–Ernzerhof functional methods through spin orbital interaction calculations. Band structure calculation results show that the indirect and direct bandgaps are 0.23 and 1.6 eV, respectively, which are similar to the reported experimental bandgap. The CoO(100) and CoO(110) surfaces were created from the optimised bulk structure. The CoO(100) surface contains 13 atoms Co vacancy, whereas the CoO(110) surface contains 15 atoms Co vacancy on the top layer surfaces. The adsorption energy of H2O on the CoO(100) and CoO(110) surfaces was calculated on the basis of eight configurations. The optimum adsorption energy (5.123 eV) of H2O on the CoO(100) surface is in Model 5. Meanwhile, the optimum adsorption energy (2.810 eV) of H2O on the CoO (110) surface is in Model 6. This result indicates that H2O is easier to absorb on CoO(110) than on CoO(100), and agree to the experiment result reported.
Keywords:Cobalt oxide, band structure, PDOS, energy Adsorption
1. Introduction
Energy demand is increasing globally with the advances in technology and rising world population. Fossil fuels, including petroleum, coal and natural gas, which are the main current energy sources, are predicted to be exhausted in few years. In addition, the use of fossil fuels causes environmental pollution and triggers global warming because of carbon dioxide emissions. The need to tap alternative and renewable energy sources, including solar en ergy, wind, geothermal heat, tides, and biomass, is indispensable [1; 2]. The development of carbon-free energy from renewable sources has attracted the attention of researchers primarily because they are low cost and produce clean energy. Hydrogen gas has emerged as an alternative to fossil fuels with the development of fuel cell technology. Fuel cell produces clean and efficient energy, with pure water as a by-product; thus, it may solve global warming and climate change issues [3; 4].
under sunlight was TiO2 [7]. However, TiO2has a large band gap of 3.2 eV under ultraviolet irradiation, which only contributes 4% of the solar energy to reach Earth. In addition, 13.8% of solar energy cannot be used [8]. An ideal semiconductor photoelectrode for water splitting must have (i) an ideal semiconductor energy band gap to absorb sufficient solar energy (1.6 eV < Eg < 2.2 eV), (ii) efficient light absorption, (iii) high electrical conductivity, (iv) high photoelectrochemical stability in electrolyte solution, (v) edge band gap structure that meets water redox potential criteria and (vi) high carrier mobility [9].
Metal oxide semiconductors have been widely studied for photoelectrochemical water splitting because they are cheaper and more environmentally friendly than other types of semiconductors [10; 11]. Metal oxide is selected as a photocatalytic because it is stable in aqueous solution and has a high photoactivity under visible lig ht [11]. However, the weakness of metal oxide semiconductors is in their large energy gap (TiO2= 3.2eV, SnO2= 3.5 eV, KTaO3= 3.4 eV). In addition, it is only suitable for use in a limited range of ultraviolet wave spectrum. Hence, the production of metal oxide-based semiconductor electrodes with modified energy gap to absorb visible light is expected to be useful in photoelectrochemical water splitting. Recently, cobalt oxide (CoO) has been widely studied because of its many advantages, including its 5% efficiency in solar to hydrogen production, which is the highest efficiency of any single material for photoelectrochemical water splitting [12]. CoO has been reported in rock-salt cubic structure (space group Fm3hm) with octahedral Co2+atoms (Fig. 1a) [13]. Among the various surfaces of CoO, CoO(100) is reported as the most probable surface configuration for CoO (Fig. 1b-c).
In this study, we used density functional theory (DFT) methods to investigate the electronic structure and identify the stable adsorption sites of H2O molecule on the CoO(100) and CoO(110) surfaces. First-principle DFT calculation is commonly used to assess the properties of molecules and mechanisms on the catalyst surface. It is a reliable, fast and inexpensive technique [14; 15]. The adsorption of H2O molecule is the first step in water molecule splitting process. In a catalytic process, a model with absorption energy in the middle among other models is the most preferable model. The highest absorption energy means the H2O weakly absorbed and there is not enough interaction with the catalyst surface. While the smallest absorption energy means H2O adsorbed strongly on the catalyst surface, causing it difficult to continue the catalytic process.[16].
2
Computational Methodology
First-principles calculations were performed based on DFT implemented in The CASTEP module from Biovia Material Studio 2016 software package. Exchange correlation by using the functional of generalised gradient approximation (GGA) with the level theory of the Perdew–Burke–Ernzerhof functional (PBE) was employed for electron–electron interactions [17]. Calculations were spin-polarised using an ultrasoft pseudo-potential. In these calculations, a plane-wave cutoff energy of 340 eV was used. The Monkhorst–Pack grid size for the self-consistent field calculation was 6x6x6. The rock-salt CoO structure was obtained from the Crystallography Open Database (CID No 1000053.cif); the structure of magnesium oxide was changed to CoO. The corresponding optimised crystal structures were used to develop the CoO (100) and CoO(110) surfaces. The vacuum slab layer thickness of the surfaces was set to 15 Å for the structural relaxations of the slabs.
The adsorption energy of H2O on the CoO (100) and CoO (110) surfaces was calculated based on eight configurations to identify the optimum sites of H2O on the CoO surfaces. The adsorption energy of molecules in different adsorption sites was calculated using the equation (1):
Eads= E(molecule on surface) -E (surface) - E (molecule) (1)
where E (molecule on surface) is the total energy of H2O adsorbed on the CoO surface, and E(surface and E(molecule) are the formation energies of the CoO surface and H2O molecule, respectively.
3. Results and Discussions
3.1 Optimization of CoO and H
2O structures
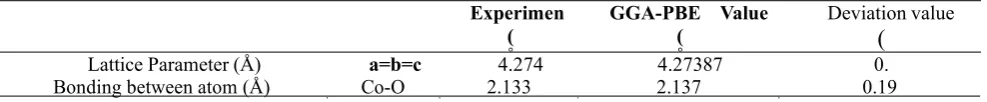
All lattice and bonding parameters between cobalt and oxygen atoms, Co-O for CoO bulk, using different methods are given in Table 1. The GGA–PBE method provides a lattice parameter of 4.27387 Å with a deviation value of 0.16% to the experimental value of 4.26 Å [18]. Furthermore, the calculation of bonding between Co-O atoms is 2.137 Å, which is closer to the experimental value of 2.133 Å. The deviation value is 0.19% with a bonding error of 0.0004 Å.
Table 1 - Lattice parameters of optimised CoO bulk
Experimen GGA-PBE Value Deviation value (
Å Å(
(
Lattice Parameter (Å) a=b=c 4.274 4.27387 0.
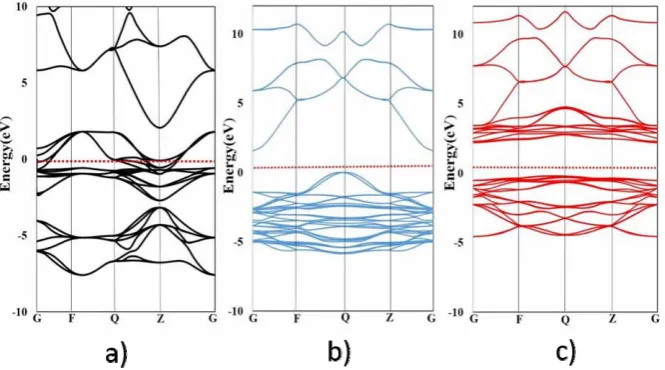
Fig. 1(a) shows the calculated band structure of pure CoO without spin orbit interactions, which shows metallic properties. The band structure is similar with reported by many researcher [19-21]. Figs. 1(b) and (c) show the calculated band structures considering spin orbital interactions and the band structures of alpha- and beta-cobalt oxide. The different alpha and beta phases may confirm the magnetic properties of CoO. The spin orbital interactions calculation shows that CoO has indirect and direct bandgaps, which are 0.23 and 1.55 eV, respectively, which are similar to the reported experimental bandgap [22].
Fig.1 - Calculated band structure of pure CoO (a) without spin polarization, (b-c) with spin polarization and (c) partial density of state
Fig. 2 - (a) Crystal structure of CoO bulk (Blue: cobalt, Red: oxygen), (b) CoO (100) and (c) CoO (110)
The CoO (100) and CoO (110) surfaces were created from the 2x2x2 optimized bulk structure. Fig. 2 is the optimize structures of CoO (100) and CoO (110) surfaces, where the CoO (100) has lattice size a = b, and the atoms position are perpendicular each layer. Meanwhile, CoO (110) surface has lattice size a ≠ b and produce zig-zag layer configuration. From Fig 2, clearly shows that CoO (110) surface has larger compared to the CoO (100) surface in which the CoO (100) surface contains 13 atoms Co atoms at the top layer surfaces, whereas the CoO (110) surface contains 15 atoms Co. However, CoO (100) layer was thicker compared to CoO (110) layer.
3.2 Energy Adsorption of water molecule
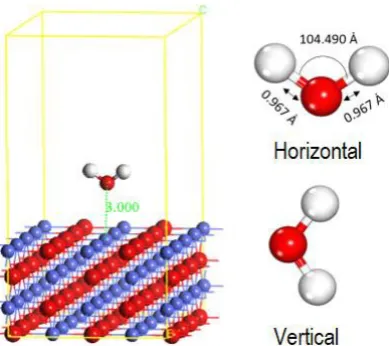
respectively. The H2O is adsorbed at horizontal position (Fig.4). Meanwhile, Figs. 3(e) to 3(g) show H2O molecule at vertical position (Fig. 4). The distance between H2O and CoO (100) surface was set to 3.0 Å (Figs. 4). This distance is considered to have an interaction between the H2O adsorption and the selected CoO surfaces.
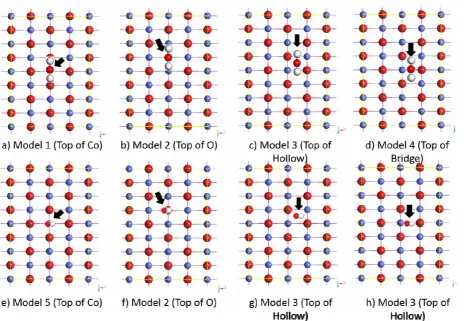
Fig. 3 - H2O adsorption on CoO surface
Table 3 shows a summary of the H2O adsorption on CoO(100). On the basis of the data obtained, the adsorption energies calculated on Model 1, Model 2, Model 3, Model 4, Model 5, Model 6, Model 7 and Model 8 are 5.188, 6.039, 5.729, 5.094, 5.123, 5.691, 5.094 and 5.096 eV, respectively. In a catalytic process, a model with absorption energy in the middle among other models is the most preferable model. The highest absorption energy means the H2O weakly absorbed and there is not enough interaction with the catalyst surface. While the smallest absorption energy means H2O adsorbed strongly on the catalyst surface, causing it difficult to continue the catalytic process. The H2O adsorption energy over the CoO (100) surface has an optimum value of 5.123 eV in Model 5, where the H2O position on top of Co atom. This value is taken based on the intermediate energy among them. The other reason is because the adsorption of H2O on the site of atom at Co is stronger than at other sites owing to the stable Co2+ ion structure on the CoO(100) surface. The adsorption on the surface of the holes and bridges causes the H2O molecule to move toward the site that contains atoms for optimum energy adsorption. In general, the closer the energy to the d-line at Fermi level, the stronger the binding to the surface [23].
Therefore, adsorption of the H2O molecule at the Model 5 site is optimum compared with other models because the bond between the molecules and the surface is the most optimum and easy for water splitting. At the same time, the H2O adsorption at the Model 2 site is the least optimum because of the high adsorption energy of 6.039 eV because the distance between H2O bonding and surface is too large and causes difficulty for H2O to decompose. Table 4 shows a summary of the H2O adsorption energy on the CoO (110) surface.
Fig. 4 - Side view of H2O adsorption on CoO surface before optimization step
Table 3 - Summary of calculations of CoO (100) adsorption energy.
Model H2O distance with surface (Å) Energy Adsorption (eV)
Model 1 2.0 5.1
Model 2 2.9 6.0
Model 3 2.1 5.7
Model 4 1.9 5.0
Model 5 2.0 5.1
Model 6 2.6 5.6
Model 7 1.9 5.0
Model 8 2.0
25 5.096
Table 4 - Summary of calculations of CoO adsorption energy (110).
Model H2O distance with surface (Å) Energy Adsorption (eV)
Model 1 1.6 -2.708
Model 2 1.5 -3.013
Model 3 1.5 -3.006
Model 4 1.9 3.1
Model 5 1.9 3.3
Model 6 1.6 2.8
Model 7 1.7 2.8
Model 8 1.9
28 3.296
4. Conclusion
This study was successful built CoO(100) and CoO(110) surfaces and determined the H2O adsorption energy on the surfaces by using a DFT calculation method. The surface of CoO(100) has planar atoms configuration, while the CoO(110) surface has zig-zag atoms configuration. The surface area of CoO(110) was found larger than the CoO(100) surface. The H2O adsorption energy calculated on both surfaces on basis of eight models. On the CoO(100) surface, the optimum adsorption energy was found at Model 5, in which the H2O placed vertically on top of Co atom. The calculated value is 5.123 eV. Meanwhile, the optimum H2O adsorption energy on the CoO(110) surface was found at Model 6, where the H2O placed horizontally on top of O atom. The calculated value is 2.810 eV. The optimum adsorption energy of H2O on CoO(110) was found smaller than H2O on CoO(100). It indicates that H2O is easier to absorb on CoO(110) rather than on CoO(100). However, these promising results require further experimental confirmation.
Acknowledgment
References
[1] Bin Adnan, M.A., Arifin, K., Minggu, L.J., and Kassim, M.B. (2018). Titanate-based perovskites for photochemical and photoelectrochemical water splitting applications: A review. International Journal of Hydrogen Energy 43, 23209-23220.
[2] Mustapha, M. (2019). Estimation of Global Solar Radiation on Horizontal Surface in Kano, Nigeria Using Air Temperature Amplitude. International Journal of Integrated Engineering 6, 103–109.
[3] Arifin, K., Majlan, E.H., Wan Daud, W.R., and Kassim, M.B. (2012). Bimetallic complexes in artificial photosynthesis for hydrogen production: A review. International Journal of Hydrogen Energy 37, 3066-3087. [4] Nor Fatina, R., Andanastuti, M., Mahendra Rao, S., Nurul Akidah, B., and Muhammed Ali, S.A. (2018).
Challenges in Fabricating Solid Oxide Fuel Cell Stacks for Portable Applications: A Short Review. International Journal of Integrated Engineering 10, 80-86.
[5] Salehmin, M.N.I., Jeffery Minggu, L., Arifin, K., Mohamad Yunus, R., Mohamed, M.A., and Kassim, M.B. (2019). Recent advances on state-of-the-art copper (I/II) oxide as photoelectrode for solar green fuel generation: Challenges and mitigation strategies.Applied CatalysisA: General 582, 117104.
[6] Du, P., and Eisenberg, R. (2012). Catalysts made of earth-abundant elements (Co, Ni, Fe) for water splitting: Recent progress and future challenges. Energy & Environmental Science 5, 6012-6021.
[7] Arifin, K., Daud, W.R.W., and Kassim, M.B. (2013). Optical and photoelectrochemical properties of a TiO2 thin film doped with a ruthenium–tungsten bimetallic complex. Ceramics International 39, 2699-2707.
[8] Takanabe, K. (2017). Photocatalytic Water Splitting: Quantitative Approaches toward Photocatalyst by Design. ACS Catalysis 7, 8006-8022.
[9] Shen, S., Lindley, S.A., Chen, X., and Zhang, J.Z. (2016). Hematite heterostructures for photoelectrochemical water splitting: rational materials design and charge carrier dynamics. Energy & Environmental Science 9, 2744-2775.
[10] Deng, X., and Tüysüz, H. (2014). Cobalt-Oxide-Based Materials as Water Oxidation Catalyst: Recent Progress and Challenges. ACS Catalysis 4, 3701-3714.
[11] Zhang, B., Li, F., Yu, F., Wang, X., Zhou, X., Li, H., Jiang, Y., and Sun, L. (2014). Electrochemical and Photoelectrochemical Water Oxidation by Supported Cobalt–Oxo Cubanes.ACS Catalysis 4, 804-809.
[12] Liao, L., Zhang, Q., Su, Z., Zhao, Z., Wang, Y., Li, Y., Lu, X., Wei, D., Feng, G., Yu, Q., et al. (2013). Efficient solar water-splitting using a nanocrystalline CoO photocatalyst. Nature Nanotechnology 9, 69.
[13] Liu, R.X., Wang, X.C., Chen, G.F., and Yang, B.H. (2015). Magnetism and electronic structure in La-doped CoO: A first-principles study. Physica E: Low-dimensional Systems and Nanostructures 74, 226-232.
[14] Arifin, K., Daud, W.R.W., and Kassim, M.B. (2014). A DFT analyses for molecular structure, electronic state and spectroscopic property of a dithiolene tungsten carbonyl complex. Spectrochimica Acta Part A: Molecular and Biomolecular Spectroscopy 124, 375-382.
[15] Arifin, K., Minggu, L.J., Daud, W.R.W., Yamin, B.M., Daik, R., and Kassim, M.B. (2014). Synthesis, structure and theoretical investigation into a homoleptic tris(dithiolene) tungsten. Spectrochimica Acta Part A: Molecular and Biomolecular Spectroscopy 120, 208-215.
[16] Henderson, M.A. (2002). The interaction of water with solid surfaces: fundamental aspects revisited. Surface Science Reports 46, 1-308.
[17] Perdew, J.P., and Zunger, A. (1981). Self-interaction correction to density-functional approximations for many-electron systems. Physical Review B 23, 5048-5079.
[18] Helen, V., and Joseph Prince, J. (2019). Influence of annealing on the structural, optical and magnetic properties of CoO thin films. Materials Research Innovations 23, 200-206.
[19] Yin, M., Wang, X., Mi, W., Chen, G., and Yang, B. (2014). A first-principles prediction on the magnetism in CoO with Co and O Vacancies. Journal of Alloys and Compounds 610, 422-427.
[20] Gillen, R., and Robertson, J. (2013). Accurate screened exchange band structures for the transition metal monoxides MnO, FeO, CoO and NiO. Journal of Physics: Condensed Matter 25, 165502.
[21] Yin, M., Wang, X., Mi, W., Ding, Y., Chen, G., and Yang, B. (2014). Magnetism and electronic structure in Zn and Ti doped CoO: A first-principles study. Computational Materials Science 93, 193-200.
[22] Moridon, S.N.F., Salehmin, M.I., Mohamed, M.A., Arifin, K., Minggu, L.J., and Kassim, M.B. (2019). Cobalt oxide as photocatalyst for water splitting: Temperature-dependent phase structures. International Journal of Hydrogen Energy 44, 25495-25504.