[Karagoz * et al., 4(12): December, 2017]
ISSN: 2349-5197
Impact Factor: 2.715
I
NTERNATIONAL
J
OURNAL OF
R
ESEARCH
S
CIENCE &
M
ANAGEMENT
DESIGN AND PERFORMANCE ANALYSIS OF A VIRTUAL BODY MINI
CYCLONE
Mehmet E. Çalişkan1, Irfan Karagoz1*, Atakan Avci1 & Ali Surmen1
1Department of Mechanical Engineering, Uludag University, Görükle, Bursa, Turkey
DOI: 10.5281/zenodo.1117646
Keywords
:
cyclone separator, collection efficiency, fractional efficiency, pressure losses, air pollutionAbstract
Cyclone separators are used as main or pre-separator of particle in power plants, combustion systems, chemical and medical processes, systems related heat and mass transfer, etc. In this study, a new virtual body mini cyclone was designed and manufactured by using 3D printer. An experimental setup was constructed for its performance tests. The system was run in suction mode and the atmospheric air was sucked by using a blower. A digital flowmeter and a differential pressure sensor were used for measurement of the flow rate and pressure drop respectively. Calcite particles fed into incoming air was used in the experiments. Particle size distributions of the particles entering the cyclone and the collected particles were analyzed by using a particle analyzer. The particle collection efficiency, fractional efficiencies and pressure losses were obtained from the test results. The effects of flow rate or inlet velocity and various geometrical parameters on the cyclone performances were also analyzed.
Introduction
Cyclone separators have been used in different fields of engineering for over 200 years. Especially, nowadays, it takes an important place in fields such as chemistry, textile, medicine industry, vacuum cleaner industry, sample separation and recycling. The reasons of the widely usage of these cyclones; having simple structure, low cost production, low maintenance expenses and we can use them under extreme conditions such as high temperature and high pressure.
Beside these advantages, cyclone separators are expected to have high performance. The performance parameters of a cyclone separator can be listed as particle separation efficiency, pressure loss, flow rate and fractional efficiency. In the experiments with the cyclone separators, it can be seen how these performance parameters are affected by changing cyclone geometry and working parameters.
[Karagoz * et al., 4(12): December, 2017]
ISSN: 2349-5197
Impact Factor: 2.715
I
NTERNATIONAL
J
OURNAL OF
R
ESEARCH
S
CIENCE &
M
ANAGEMENT
importance to theoretical, experimental and numerical analysis of cyclone separation performance and optimization and they suggested a new cyclone design [12, 13, 14, 15].
This study is consist of experimental investigation of pressure loss as well as total and fractional efficiency values for a new design mini cyclone in different flow rates.
Materials And Methods
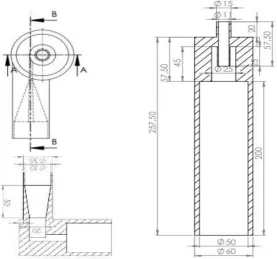
The cyclone separator used in the experiments of this study is presented in Fig. 1 including the main dimensions. Cyclone’s inlet cross-sectional area is a rectangle with a size of 3*20 mm. This sectional area expand a circular area that has 32 mm diameter. The dust-air mixture reaches this rectangular area due to a constricted structure by entering through a 32 mm circular cross section at the entrance of the cyclone. The exact mixing of air and calcite dust takes place in this area. In the present design, a large body was used instead of the cone as in the classic cyclones. With this design, it is aimed that the vortex formed by the cycle move downward as if had a virtual wall in this large body
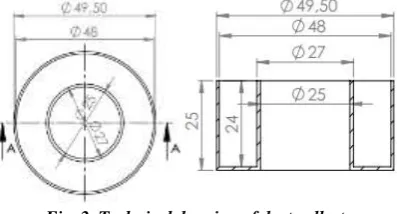
The cyclone separator also has 4 dust collectors placed in the large body so that the collected particles can be classified at the same time. The dimensions of these dust collectors are shown in Fig. 2. In addition, rings are used between these dust collectors to create space for dust collection. By changing the location of these rings between the dust collectors, the height of the dust collectors in the cyclone can be changed.
Experiments were carried out under normal atmospheric conditions. Calcite dust (CaCO3) was used as dust particles with an density of 2.7 gr / cm3. The average particle size of this calcite is 29.7 μm and the particle size distribution is shown in Fig. 3. Particle size measurements were carried out by using Mastersizer 2000 particle size analyzer.
[Karagoz * et al., 4(12): December, 2017]
ISSN: 2349-5197
Impact Factor: 2.715
I
NTERNATIONAL
J
OURNAL OF
R
ESEARCH
S
CIENCE &
M
ANAGEMENT
Fig. 2. Technical drawing of dust collector
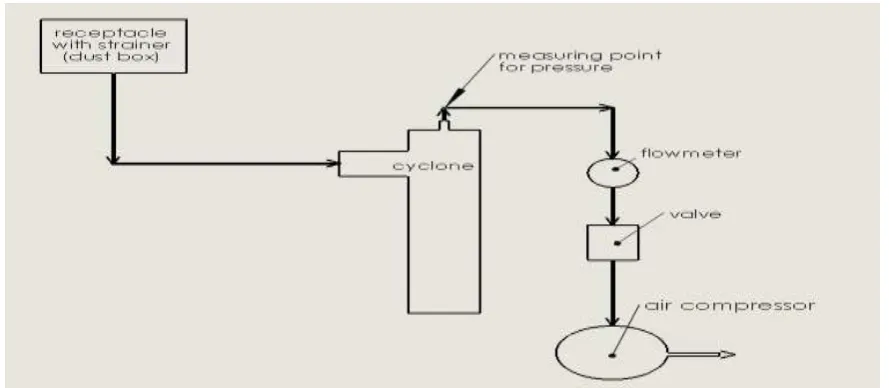
The required air pressure was provided by Proair 2.2 KW blower during the experiments. A flow meter and a valve are used in the pipe connected to the blower inlet. The pipe connected to this flow meter is connected to the outlet of the cyclone. At this point, the flow rate through the cyclone is measured with a accuracy of 0.1 m3/h and the desired flow rate is set by means of the valve. This experimental setup is given in Fig. 4.
Once the desired flow and configurations have been set, the calcite is placed in a strained dust box at the inlet of the cyclone. Due to the strainer contained in strained dust box, calcite dust enter the cyclone without agglomeration. In addition, thanks to a vibration device integrated in the dust box, the dusts enter the cyclone automatically at a constant concentration. In each experiment, 50 g of calcite dust was used, considering the capacity of the dust collectors. Also, each experiment is set to take between 25 and 35 minutes. The pressure loss measurement during the experiments was measured by using Testo 521 differential pressure gage. This device measures the pressure difference between two points. The first point taken on a pipe near the outlet of the cyclone, and the second point is left open to the atmosphere. That is, the measured pressure losses are given as the pressure difference between the atmosphere and cyclone exit.
At the end of each experiment, the dust collected in the dust collectors is weighed. The samples taken from each collected dust were stored to measure the particle size distributions. In addition, the overall collection efficiency is obtained from the ratio of the total dust weight collected in the dust collectors to the weight of the total dust sent to the cyclone.
For each configuration, the experiments were carried out at three flow rates, that are 4, 6, and 8 m3/h with corresponding inlet velocities ranging from 18.5 to 37 m/s.
[Karagoz * et al., 4(12): December, 2017]
ISSN: 2349-5197
Impact Factor: 2.715
I
NTERNATIONAL
J
OURNAL OF
R
ESEARCH
S
CIENCE &
M
ANAGEMENT
were measured and analyzed. In the light of the obtained dataset, 3 configurations were determined for optimal separation and efficiency. These 3 configurations include 2, 3 and 4 dust collectors, respectively. Here we will focus mainly on the configuration in which 3 dust collectors are used.
Fig. 4 Experimental set up of cyclone separator
Results And Discussion
The results of the experiments were analyzed to show the overall collection efficiency and classification performance of the cyclone separator at flow rates of 4 to 8 m3/h.
Overall Collection Efficiency and Pressure Loss of Cyclone
For the configuration of the cyclone separator contain three dust collectors, the results of the experiments for the flow rates of 4, 6 and 8 m3 / h are given in Fig 5. In these conclusions, the overall collection efficiency increases with the flow rate and the cyclone inlet velocity.
Ji et al. (2009), in their experimental studies with their own cyclone, kept cyclone inlet velocity range between 5 and 30 m / s. In these experiments, they obtained higher overall collection efficiency at higher inlet velocities and particle concentrations. In addition, Ji Z. et al. (2009) have found that they have achieved high collection efficiency at high cyclone inlet rates in their experiments [8].
[Karagoz * et al., 4(12): December, 2017]
ISSN: 2349-5197
Impact Factor: 2.715
I
NTERNATIONAL
J
OURNAL OF
R
ESEARCH
S
CIENCE &
M
ANAGEMENT
Fig. 5. Overall collection efficiency as a function of flow rate
Fig. 6. Pressure loss as a function of flow rate
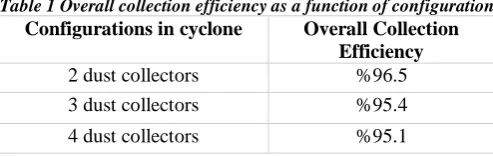
Another variable to be investigated during experiments is the configuration which has different numbers of dust collectors. Experiments in these configurations which have 2, 3 and 4 dust collectors, respectively, showed that the overall collection efficiency did not change much (Table 1).
Table 1 Overall collection efficiency as a function of configuration
Configurations in cyclone Overall Collection Efficiency
2 dust collectors %96.5
3 dust collectors %95.4
4 dust collectors %95.1
Amounts of dust collected in the dust collectors in the cyclone separator were also experimentally investigated in different flow rates. The results of the experimental investigation at 4 and 8 m3/h are given in Table 2. Particles collected in the dust collectors were measured with a Mastersizer 2000 particle analyzer and the results of mean particle diameter in each collector are also given in the tebale. Inside of the cyclone, the dust collector-1 is at the bottom and the dust collector-3 is at the top. The amount of dust which collected in the dust collectors and its mean particle diameters, d (0.5), vary with flow rate. For each dust collector, as the flow rate increases, the mean size of the collected particles increases slightly. For example, at 4 m3/h, the amount of dust collected in the collector-2 is 14.5 gr and the mean particle diameter is 14.69 microns, while, at the 8 m3/h, the amount of dust which collected in the dust collector-2 is 21.2 gr and the average particle diameter is 19.6 microns. It can also be
89.6 93.3 94.4 89 90 91 92 93 94 95
2 4 6 8 10
o ve ra ll co lle cti o n ef fi ci en cy (% )
flow rate(m3/h)
91 183 282 0 50 100 150 200 250 300
2 4 6 8 10
p re ssu re los s (m m ss)
[Karagoz * et al., 4(12): December, 2017]
ISSN: 2349-5197
Impact Factor: 2.715
I
NTERNATIONAL
J
OURNAL OF
R
ESEARCH
S
CIENCE &
M
ANAGEMENT
Table 2 Experimental results for dust distribution in collectors
Flow
Dust Collector 1 Dust Collector 2 Dust Collector 3
Collected
dust Mean size
Collected
dust Mean size
Collected
dust Mean size
4 m3/h 1.7 gr 5.65 μm 14.5 gr 14.69 μm 27.9 gr 44.45 μm
8 m3/h 3.85 gr 6.84 μm 21.2 gr 19.60 μm 21.55 gr 52.63 μm
Yoshida et al. (2009) observed in their study that the duration of dust particles in the cyclone separator increased due to the low flow rate [16]. The particles which remain more in the cyclone separator were subjected to more centrifugal forces. Thus, as seen in Table 2, more dust was collected at the top of the cyclone (Dust Collector 3).
Fractional Efficiencies
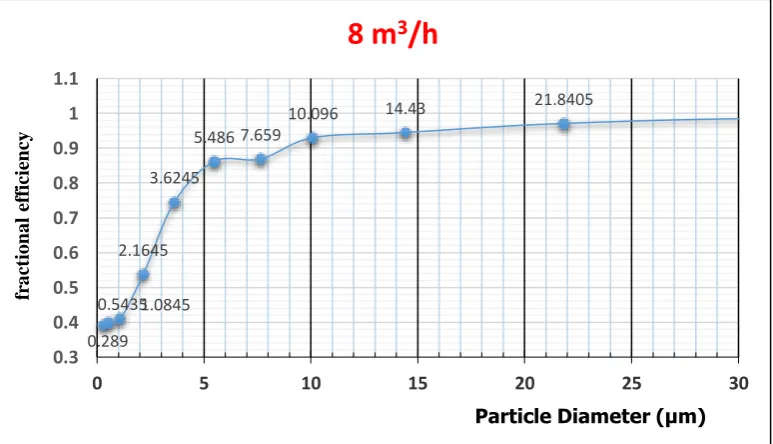
From the results of particle size analysis; it is possible to calculate the ratio of dust collected for each particle size to the amount of dust entering the cyclone. The fractional efficiency of the cyclone is obtained at the certain flow by calculating the collection efficiency for each particle size starting from the smallest dust size. It is possible to see from the curves of these fractional efficiencies, the change in the collection efficiency depending on the particle size. The fractional efficiency curves obtained from these experiments are given in Fig.7 for two different flow rates.
When the fractional efficiency curves are taken into account, the cyclone efficiency at very small particle sizes at both flow rates is around %30, while the fractional efficiency value increases as the particle size increases, approaching 1, i.e., %100. From these curves it is also possible to determine the critical particle diameters of the cyclone. The critical particle diameter is the particle diameter collected by the cyclone with the efficiency of %50. In these experiments it is seen that the critical diameters are 2.6 and 1.95 microns for 4 and 8 m3/h, respectively.
0.289 0.54351.0845
2.1645 3.6245
5.486 7.659
10.096 14.43 21.8405
0.3 0.4 0.5 0.6 0.7 0.8 0.9 1 1.1
0 5 10 15 20 25 30
fr
ac
tion
al
e
ff
icie
n
cy
Particle Diameter (μm)
[Karagoz * et al., 4(12): December, 2017]
ISSN: 2349-5197
Impact Factor: 2.715
I
NTERNATIONAL
J
OURNAL OF
R
ESEARCH
S
CIENCE &
M
ANAGEMENT
Fig.7 The fractional efficiency curves of the cyclone for 4 and 8 m3/h
Conclusion
The effect of the cyclone separator on the overall collection efficiency and performance were investigated in different configurations for 4-8 m3/h. Overall collection efficiency and pressure loss of the cyclone were observed to increase with the inlet velocity or flow rate of the dust-air mixture entering the cyclone. In addition, it is reached the conclusion that the overall collection efficiency do not vary significantly over different configurations. Cyclone separator performance was investigated in terms of flow rates, the number and location of the dust collectors changing within the cyclone (configurations). The results show that, the particle sizes of dusts collected in the upper part of the cyclone are also increased with increasing flow rate. It is understood that this is caused by the increasing centrifugal forces with increasing flow rate. Therefore, it has been shown that such a cyclone can also be used as a particle classifier. If a given sample is desired to be classified at a particular size, it is necessary to create a specific configuration in the cyclone separator and set the flow accordingly to achieve this classification.
Acknowledgement
The authors gratefully acknowledge the financial assistance from the Scientific and Technological Research Council of Turkey (No. 114M591).
References
1. Shephered, C. B., & Lapple, C. E., Flow pattern and pressure drop in cyclone dust collectors. Industrial & Engineering Chemistry, 31(8), 972-984, 1939.
2. Kilmer, V. J., & Alexander, L. T., Methods of making mechanical analyses of soils. Soil Science, 68(1), 15-24, 1949.
3. Stairmand, C. J., The design and performance of cyclone separators. Trans. Instn. Chem. Engrs., 29, 356-383, 1951.
4. Leith, D., The collection efficiency of cyclone type particle collectors-a new theoretical approach. In AIChE Symp. Ser. 68, 196-206, 1972.
5. Mihalski, K., Kaspar, P., Parnell Jr, C. B., Optimum utilization of cyclone technology. In American Society of Agricultural Engineers. Meeting (USA), 1992.
0.54351.0845 2.1645
3.6245
5.486 7.659
10.096 14.43 21.8405
0.300 0.400 0.500 0.600 0.700 0.800 0.900 1.000 1.100
0 5 10 15 20 25 30
fr
act
ion
al
e
ff
ici
e
n
cy
Particle Diameter (μm)
[Karagoz * et al., 4(12): December, 2017]
ISSN: 2349-5197
Impact Factor: 2.715
I
NTERNATIONAL
J
OURNAL OF
R
ESEARCH
S
CIENCE &
M
ANAGEMENT
8. Ji, Z., Xiong, Z., Wu, X., Chen, H., & Wu, H., Experimental investigations on a cyclone separator performance at an extremely low particle concentration. Powder Technology, 191(3), 254-259, 9. Elsayed, K., Lacor, C., Optimization of the cyclone separator geometry for minimum pressure drop using
mathematical models and CFD simulations. Chemical Engineering Science, 65(22), 6048-6058, 2010. 10. Zhao, B., Prediction of gas-particle separation efficiency for cyclones: A time-of-flight model.
Separation and purification technology, 85, 171-177, 2012.
11. Elsayed, K., Lacor, C., Numerical modeling of the flow field and performance in cyclones of different cone-tip diameters. Computers & Fluids, 51(1), 48-59, 2011.
12. Karagoz I, Avci A., Modelling of the pressure drop in tangential inlet cyclone separators “, Aerosol Science and Technology 39 (9): 857-865, 2005
13. Kaya F., Karagoz I., Numerical investigation of performance characteristics of a cyclone prolonged with a dipleg. Chemical Engineering Journal, 151, 39-45, 2009
14. Karagoz, I., Avci, A., Surmen, A., Sendogan O., Design and performance evaluation of a new cyclone separator. Journal of Aerosol Science, 59, 57-64, 2013.
15. Tan, F., Karagoz, I., Avci A., The Effects of Geometrical Parameters on the Natural Vortex Length in a New Cyclone Separator. Chemical Engineering Communications, 203(9), 1216–1221, 2016
16. Yoshida, H., Inada, Y., Fukui, K., & Yamamoto, T., Improvement of gas-cyclone performance by use of local fluid flow control method. Powder technology, 193(1), 6-14, 2009.