Botnet detection using graph‑based
feature clustering
Sudipta Chowdhury
1*, Mojtaba Khanzadeh
1, Ravi Akula
1, Fangyan Zhang
2, Song Zhang
2, Hugh Medal
1,
Mohammad Marufuzzaman
1and Linkan Bian
1Background
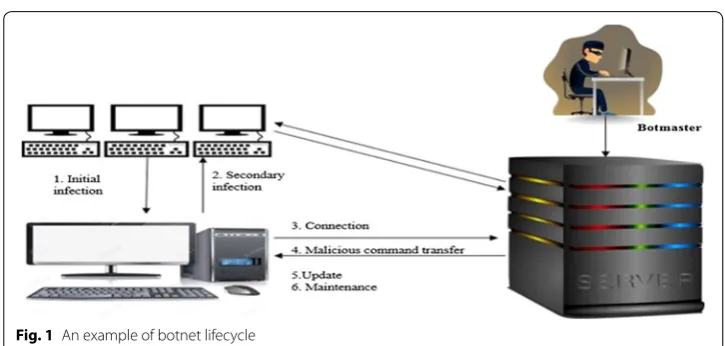
During the last 15 years, botnets have caused some of the most devastating and costly internet security incidents [1]. A client machine becomes a bot in a botnet when infected by a particular type of malware [2] that an attacker can exploit remotely to control an infected machine. An attacker can issue commands to a single bot, or to all the bots in botnet. The attacker controlling the botnet is sometimes referred to as the ‘botherder’, ‘botmaster’ or ‘controller’ [3]. Figure 1 shows a typical botnet cycle. Contrary to existing malwares such as viruses and worms, which focus on attacking the infecting host, bots can receive commands from the botmaster, allowing them to be used in a distributed attack platform [4].
Botnets can significantly damage the security of individuals and businesses. They pose a serious and growing threat against cyber-security as they provide a distributed plat-form for many cyber-crimes such as distributed denial of service (DDoS) attacks against critical targets, malware dissemination, phishing, and click fraud [5–8]. Majority of the
Abstract
Detecting botnets in a network is crucial because bots impact numerous areas such as cyber security, finance, health care, law enforcement, and more. Botnets are becoming more sophisticated and dangerous day-by-day, and most of the existing rule based and flow based detection methods may not be capable of detecting bot activities in an efficient and effective manner. Hence, designing a robust and fast botnet detec-tion method is of high significance. In this study, we propose a novel botnet detecdetec-tion methodology based on topological features of nodes within a graph: in degree, out degree, in degree weight, out degree weight, clustering coefficient, node between-ness, and eigenvector centrality. A self-organizing map clustering method is applied to establish clusters of nodes in the network based on these features. Our method is capable of isolating bots in clusters of small sizes while containing the majority of normal nodes in the same big cluster. Thus, bots can be detected by searching a lim-ited number of nodes. A filtering procedure is also developed to further enhance the algorithm efficiency by removing inactive nodes from consideration. The methodology is verified using the CTU-13 datasets, and benchmarked against a classification-based detection method. The results show that our proposed method can efficiently detect the bots despite their varying behaviors.
Keywords: Cyber security, Bot detection, Graph-based features, Clustering
Open Access
© The Author(s) 2017. This article is distributed under the terms of the Creative Commons Attribution 4.0 International License (http://creativecommons.org/licenses/by/4.0/), which permits unrestricted use, distribution, and reproduction in any medium, provided you give appropriate credit to the original author(s) and the source, provide a link to the Creative Commons license, and indicate if changes were made.
RESEARCH
*Correspondence: [email protected] 1 Department of Industrial and Systems Engineering, Mississippi State University, Starkville, MS 39759-9542, USA
existing botnet detection approaches concentrate primarily on particular botnet com-mand and control (C&C) protocols (e.g., HTTP, IRC and many more) and structures (e.g., centralized or P2P). They follow rule based approaches to detect botnets in net-work. However, these approaches can become ineffective and obsolete if botnets change their structure and C&C protocol in order to evade detection [4]. Thus, a robust botnet detection approach that can detect any type of botnet with varying characteristics is of utmost importance. Before exploring existing botnet detection schemes in literature, we first survey some of the studies done in anomaly detection. Later, we describe existing efforts dedicated to bot detection are identified that can be divided into two broad cat-egories: botnet detection using net flow based features and graph-based features.
Anomaly detection techniques
Researchers have conducted extensive research on anomaly detection techniques for cyber security. For example: Fadlullah et al. [9] develop a novel detection technique called DTRAB to infer DDoS attacks. The authors investigate the detection of attacks against application-level protocols that are encapsulated via encryption. In essence, this detection scheme is a distributed detection mechanism capable of detecting the anoma-lous events as early as possible. Moreover, DTRAB is able to simultaneously construct a defensive mechanism to discover attacks as well as find out the root of the threat by tracing back the attacker’s original network. The effectiveness of this scheme is vali-dated via simulation. Flow correlation information is utilized by Zhang et al. [10–12] to further improve the classification accuracy considering only a small number of train-ing instances based on K-Nearest-Neighbor and Naive Bayes classifiers that are used to detect anomalies in the network. Yan et al. [13] propose a framework of security and trust for 5G based on the perspective that the next generation network functions will be highly virtualized and software defined networking is applied for traffic control. The pro-posed approach by the researchers utilizes adaptive trust evaluation and management technologies as well as sustainable trusted computing technologies to achieve comput-ing platform trust and software defined networkcomput-ing security. A qualitative comparison is provided by Shu et al. [14] between the advantages and disadvantages of software-defined networking and traditional networking regarding security issues concerning
overall architecture. Moreover, a detailed assessment of the threats of software-defined networking from the perspective of functional layers and attack types is also provided by the authors’. Note that majority of the researchers conducted on anomaly detection focus on rule based techniques that may fall short for botnet detection as new generation bot-nets can easily encrypt their commands or use sophisticated cloaking techniques that do not follow any predefined rules. Moreover, due to the sophisticated nature of botnet in general, typical anomaly detection techniques are not applicable for botnet detection.
Flow‑based methods for botnet detection
NetFlow is a network protocol that is able to collect IP network traffic as it enters or exits an interface. NetFlow based features (or flow based features) have been used to detect anomalies including botnets in a high speed, large volume data networks. Flow based features can be defined as group of packets sharing common attributes such as source and destination IP, source and destination port, protocol type and many more. Examining each packet that is routed through the network can lead to identifying unique flows based on conjoint attributes of the packets. These attributes are considered as fingerprint of the packet and leveraging them one can determine if the packet is dis-tinctive or share common attributes with others [5, 15, 16]. Hence, using this features, many researchers have investigated the potential of detecting anomalies in the network. The botnet detection literature using net flow based features is a rich one and many researchers have significantly contributed in this area (e.g., [15–17]). Most of the exist-ing detection schemes falls into either of the three types of methods: clusterexist-ing, classifi-cation [18–20], and others.
Amini et al. [26] to detect botnets where these NetFlow data is collected, filtered, and is finally clustered using hierarchical clustering. Rule based methods are then applied to refine the clusters to reduce the percentage of false positives.
Among the authors’ who use classification techniques, Strayer et al. have developed detection approaches by examining flow characteristics such as bandwidth, packet tim-ing, and burst duration. In this study, the authors first eliminate traffic that is unlikely to be a part of a botnet, classify the remaining traffic into a group that is likely to be part of a botnet by using J48 decision trees, naïve Bayes, and Bayesian classifier. Finally, the likely traffic is correlated to find common communications patterns that would suggest the activity of a botnet [18, 20]. Fairly recently, a decision tree classifier has been used by Zhao et al. [19] to detect botnets by investigating 12 flow based features. Their proposed method can detect botnets during the C&C and attack phases based on the observation of flow based features for specific time intervals. It does not require significant mali-cious activity to occur before detection as it can recognize command and control sig-nals. Simultaneously, it does not require the knowledge about group behavior of several bots before it can be confident about making a decision.
Lu et al. [27] have incorporated both classification and clustering techniques in detec-tion of botnets where they have developed an unsupervised botnet detecdetec-tion framework where they first identify network traffic from existing known applications and then focus on each application community that might include botnet communication flows. This network traffic is then clustered to find the anomalous behaviors on that specific appli-cation community based on the n-gram features extracted from the content of network flows. The proposed detection framework has been evaluated on IRC community data, and results show that this approach obtains a high detection rate with a very low false alarm rate when detecting IRC botnet traffic.
Apart from classification and clustering techniques, there are a number of other stud-ies that employ other approaches in botnet detection using NetFlow based features. Interested readers can refer to [28–32] for such related works.
Limitation
Graph‑based methods for botnet detection
There are a number of studies that use different graph based features to detect anom-alies. Literature in this domain can be broadly categorized into two groups: detecting anomalies in static graphs and detecting anomalies in dynamic graphs. The static graphs can be further categorized into plain graphs and attributed graphs. Among the studies that use plain graphs for anomaly detection, Ding et al. [34], Henderson et al. [35], Hen-derson et al. [36], Kang et al. [37], Aggarwal [38], Zimek et al. [39], Chen and Giles [40] and many more utilize structure based patterns to detect anomalies. On the other hand, studies done by Sun et al. [41], Tong and Lin [42], Ambai et al. [43], Nikulin and Huang [44] focus on the utilization of community based patterns to detect anomalies. Simi-larly, for attributed graphs Davis et al. [45], Eberle and Holder [46], and Kontkanen and Myllymki [47] use a structure based pattern whereas Gao et al. [48], Muller et al. [49], Perozzi et al. [50] use community based patterns to detect anomalies. With dynamic graphs, authors have used the notion of graph similarity based on certain properties such degree distribution and diameter [51–53] by resorting to matrix or tensor decom-position of the time-varying graphs [54–57] or by monitoring graph communities over time and reporting events when there is structural or contextual change in any of them [58, 59].
Nagaraja et al. [67] have proposed a botnet detection technique based on structured graph analysis that localizes botnet members by identifying unique communication pat-terns arising from the overlay topologies prevalent in a command and control structure. However, this approach must be paired with some other malware detection scheme to clearly distinguish botnets from regular flows. Francois et al. [68] have proposed an approach called ‘BotTrack’ where NetFlow related data is correlated and a host depend-ency model is leveraged for advanced data mining purposes. They have used the popular linkage analysis algorithm called ‘PageRank’ with an additional clustering process to effi-ciently detect botnets. However, to validate the proposed method, the researchers have only used a small dataset (13.7 GB) and also they have generated the botnet randomly as the dataset was not labeled. Moreover, the authors’ have assumed that a certain percent-age of bots and their characteristic were known beforehand. So, if an unknown botnet exists in the network, their approach may not give good results. Francois et al. [69] have further extended their work on ‘BotTrack’ by developing a scalable method called ‘ Bot-Cloud’ for detecting botnets regarding the relationships between hosts. The evaluation of this method has showed a good detection accuracy and a good efficiency based on a Hadoop cluster. But, in this case also, the authors have initially used a botnet free dataset and later randomly have generated botnets in them. Hang et al. [70] have used com-munity detection based clustering to identify long-lived low intensity flows using graph based features.
Limitation
Similar to botnet detection methods using statistical features of flow/packet traffic or deep packet inspection, existing graph based botnet detection methods available in the literature have some major limitations. Many of them apply the botnet detection scheme in a simulated environment (e.g. [66]). Moreover, the detection approaches proposed in the literature are mostly rule based, meaning that a predetermined rule needs to be established beforehand to detect botnets from a graph (e.g., [60]). This approach may lead to unwarranted result if bots behave differently from a common norm. Although many of the graph based detection schemes use filtering to remove bot free data (e.g., [65, 67]) and then apply a detection method, the amount of data that needs to be inves-tigated to detect botnet is still very large. Simultaneously, if the dataset is large, the computational expense is often high for the detection approach, which is a huge disad-vantage if faster detection is required [65].
Significance of our approach
• We present a novel graph-based method for the detection of botnets in a computer network.
• Our approach does not depend on any rules to detect botnets and is capable of cap-turing the changing behavior of bots.
• Seven graph based features are used to characterize the topological structure of the network and utilize them to detect botnets.
• The proposed method can detect different types of botnets with different types of behavioral characteristics.
• A real world dataset is used to validate the results.
The rest of the paper is organized as follows. “Data description” provides a brief description of the real dataset used in this study. “Proposed graph based clustering” dis-cusses in detail the seven features used to detect botnets and the clustering methodology implemented to cluster these features. “Case study-detecting bots in CTU-13” provides numerical results obtained after applying a clustering methodology to the real dataset as well as giving a comparative overview of applying classification techniques. “ Conclu-sions” concludes our work and reviews our main contribution to the existing literature.
Data description
Big data has been an area of interest among researchers in recent years. For instance: Tsai et al. [71] have provided a comprehensive review on studies that attempt to develop new schemes capable of handling big data during the input, analysis, and output stages of knowledge discovery. They have found that majority of the existing literature is focused on innovative methods for data mining and analysis. However, little to no atten-tion have been given to the pre- and post-analysis processing methods. Evoluatten-tion based algorithms such as accelerated particle swam optimization is used to reduce the dimen-sionality of big data by Fong et al. [72]. Authors have investigated the applicability of their method on exceptionally large volume of data with high degree dimensions and have found that the proposed method results in enhanced analytical accuracy within a reasonable amount of processing time. In this study, a big NetFlow dataset that includes botnet behavior is used for validating the proposed detection methodology. In this study we use CTU-13 dataset which is one of the biggest labelled datasets available that con-sists of botnet traffic as well as normal and background labeled data. It was captured in the Czech Technical University (CTU) in 2011. The developers of the dataset have origi-nally developed it to compare three detection methods, namely Cooperative Adaptive Mechanism for Network Protection (CAMNEP) method, BCIus detetection method, and BotHunter method [73]. Researchers have found that BCIus and CAMNEP detec-tion methods cannot be generalized for all types of botnet behavior. Each of them seems fit for different types of behavior. Analysis of BotHunter detection method shows that in real environments it can still be useful to have blacklists of known malicious IP addresses known beforehand.
utilized five packets of CTU-13 dataset to evaluate the Snort-IDS rules detection bot-nets and analyze the function of the botbot-nets in three rules packet such as botnet-cnc. rules, blacklist.rules, and spyware-put.rules. Experimental results show that botnet-cnc. rules can detect botnets for 29,798 alerts. Blacklist.rules can detect botnets for up to 44 alerts. Spyware-put.rules cannot detect any botnet. The researchers eventually surmise that botnet-cnc.rules are most proficient in detecting botnets.
Although, researchers are hopeful of the potential of using CTU-13 datasets in detect-ing botnets, (e.g., see Malowidzki et al. [76], Chanthakoumman et al. [75]) according to best of authors’ knowledge, no significant work except [73] has been done using CTU-13 data in the detection of botnets. CTU 13 dataset consists of 13 captures (called scenar-ios) of different botnet samples [61]. This dataset was designed with goals such as.
• Dataset must have real botnet attacks, not simulated attacks.
• Must have real world traffic.
• Must have ground truth labels for training and evaluating methods discussed in [73].
• Must include multiple types of botnets.
• Must have several bots infected simultaneously to capture synchronization patterns.
• Must have NetFlow files to protect the privacy of the users.
A scenario in the CTU13 dataset can be defined as a particular infection of the virtual machines using a specific malware. The data collection period for each scenario is sig-nificantly different from one another. The duration of recorded NetFlow data vary from 0.26 to 66.85 h and subsequently the amount of NetFlow data also varies accordingly. Multiple types of bots are found in the scenarios. Majority of the scenarios have only one bot (scenario 1–8 and 13), whereas scenarios 9–12 have multiple bots in them. Percent-age of botnet flow is also very negligible (<2%) compared to total NetFlow for major-ity of the scenarios. However, botnet flow percentage increases (6–8%) when there are multiple bots present in the dataset (except scenario 12). Another distinctive feature of CTU-13 dataset is that each scenario has been manually analyzed and labeled. The labe-ling process was performed inside the NetFlow files. Table 1 provides a summary of the amount of data on each botnet scenario and percentage of botnet on each scenario.
The proposed approach in this study is first of its kind to convert the NetFlow features available from CTU-13 dataset into graph based features and use these graph features to detect botnets. As CTU-13 dataset is the most complete real world dataset [76], we choose this dataset to prove the concept of our approach, the details of which are dis-cussed in “Proposed graph based clustering”.
Proposed graph based clustering
This section discusses in detail the seven features used to detect botnets and the clus-tering methodology implemented to cluster these features. First of all, a directed graph is constructed for each of 13 data sets of CTU-13. A directed graph (digraph) can be defined as a set of nodes connected by directed edges.
Mathematically, a directed graph can be expressed as an ordered pair G(V,E) where
Subsequently, the feature values are calculated of these directed graphs and afterwards a clustering methodology is applied to find the nodes with similar features.
Graph features
The seven features used in this study are in degree, out degree, in degree weight, out degree weight, clustering coefficient, node betweenness, and eigenvector centrality. Graph-tool [77, 78] is used to calculate these seven features. A brief discussion of these seven features and rationale behind choosing them is provided below:
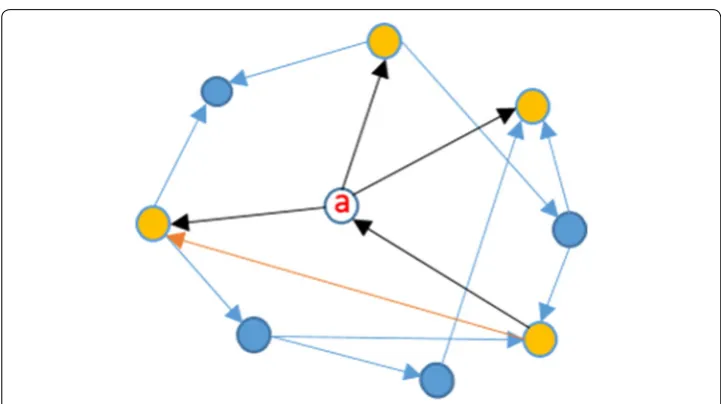
In degree
If many suspected bots contact a malicious domain for C&C reasons, this will result in a relatively high in degree for this domain. Keeping this in mind, in degree has been cho-sen as a feature to detect botnet in a network. For a particular node in a directed graph, in degree can be defined as the total number of head ends (arrows pointing towards the node) adjacent to that node. High value of in degree for a node indicates the neighboring nodes tendency to establish more connection where as low value indicates the opposite. For example: Fig. 2 shows that node a has an indegree of two.
Table 1 Amount of data on each botnet scenario [55]
Dataset Duration (h) NetFlows Size (GB) Bot name Number of bots Botnet flow
1 6.15 2,824,637 52 Neris 1 39933 (1.41%)
2 4.21 1,808,123 60 Neris 1 18839 (1.04%)
3 66.85 4,710,639 121 Rbot 1 26759 (0.56%)
4 4.21 1,121,077 53 Rbot 1 1719 (0.15%)
5 11.63 129,833 37.6 Virut 1 695 (0.53%)
6 2.18 558,920 30 Menti 1 4431 (0.79%)
7 0.38 114,078 5.8 Sogou 1 37 (0.03%)
8 19.5 2,954,231 123 Murlo 1 5052 (0.17%)
9 5.18 2,753,885 94 Neris 10 179880 (6.5%)
10 4.75 1,309,792 73 Rbot 10 106315 (8.11%)
11 0.26 107,252 5.2 Rbot 3 8161 (7.6%)
12 1.21 325,472 8.3 NSIS.ay 3 2143 (0.65%)
13 16.36 1,925,150 34 Virut 1 38791 (2.01%)
Out degree
For a particular node in a directed graph, the total number of tail ends (arrows pointing outwards from the node) adjacent to a node is called the out degree of the node. A high value of out degree for a node implies that this node tends to make more connections with other nodes and a low value implies the opposite. Bots tend to make more connection with other potential victim computers to spread the reach of botnet or to C&C domain for transferring information. So, out degree can be a useful indicator of botnet activity in a graph. As evident from Fig. 2, we can see that, node a has an out degree of two.
In degree weight
In degree weight refers to the total number of data packets received by a particular node transferred from its neighboring connected nodes. The mechanics of transferring data packets consists of setting up the data connection to the appropriate ports and choos-ing the parameters for transfer. Besides the raw data every data packet contains, it also has headers that carry certain types of metadata, along with the routing information and trailers that help in refining data transmission [77, 78]. Botnets tend to communi-cate with each other or to the C&C server to transfer information or update their com-mands. Same type of botnets usually show similar behavior in transferring information or updating commands. We assume that bots will receive the same type of command and receive approximately same volume of information that can be used to differentiate between bots and non-bots.
Out degree weight
Out degree weight and can be described as the total number of data packets sent by a particular node to its neighboring connected nodes. Same as in degree weight, we assume that bots will have similarity in the volume of data it sends out to other IP addresses in the network and can be a useful indicator of botnet activity in a network.
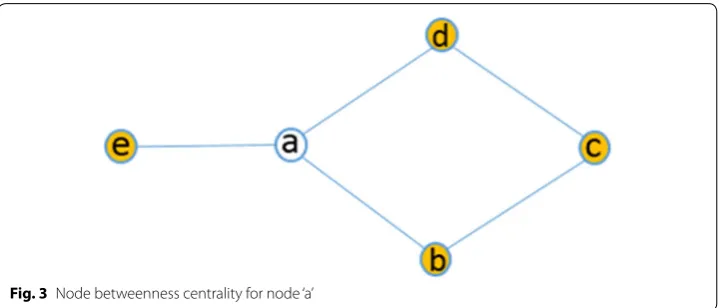
Node betweenness centrality
In graph theory, node betweenness centrality quantifies the number of times a node acts as a bridge along the shortest path between two other nodes. More specifically, node betweenness centrality indicates a particular node’s centrality in graph, which refers to how many shortest paths from all nodes to all others pass through that particular node [79]. Node betweenness centrality can be mathematically expressed as [80]:
where, σab is the total number of shortest paths from node a to b and σab(v) is total
num-ber of shortest paths that pass through node v. Figure 3 illustrates the concept of node betweenness [81].
Node betweenness centrality can be a useful feature to detect botnets especially in detecting P2P botnets where bots are more interconnected without a central C2C struc-ture. So, we assume that for a P2P bot in a botnet should have a higher node between-ness centrality in a graph.
NB(v)=
a�=b�=v∈V σab(v)
Local clustering coefficient
Local clustering coefficient of a node indicates how concentrated the neighborhood of that node is. More specifically, local clustering coefficient is a metric to evaluate how close a node’s neighbors are to each other. If Ka denotes the number of neighbors of
node a and ea denotes the number of connected pairs between all neighbors of node a,
then local clustering coefficient for node a can be given by [82]:
Figure 4 shows the clustering coefficient of node a, which is 0.083. Local clustering coefficient can also be a very significant indicator of a P2P botnet. As explained before, bots in P2P botnet have a decentralized structure where bots connect and communicate with each other to remove the need of a centralized server. As a result, interconnected-ness can be a very significant feature to detect P2P botnets which is essentially the basis of local clustering coefficient.
Eigen vector centrality
Eigen vector centrality, also known as Eigen centrality is a measurement criterion of influence of a node in a graph. It is essentially the weight of a node in a graph [83]. Each node is assigned a relative value based on the concept that connections to high-scoring nodes contribute more to the score of the node than equal connections to low-scoring nodes. Let G(V,E) be a graph where |V| is total number of nodes and |E| is the total
num-ber of edges. Let, A = (av,w) be the adjacency matrix where
Then the centrality score can be given as
nB(a)=
3.5
6 ≈0.583
Ca= ea Ka(Ka−1)
Ca=
1
4.3 ≈0.083
av,w=
1 if node v is linked to node w
0 if node v is not linked to node w
where M (v) is the set of neighbors of node v and λ is a constant. Now Eq. (1) can be rewritten as
There exists a positive solution λ with final eigenvector after using power method based Perron–Frobenius theorem [84]. Here λ is also the largest eigenvalue associated with the eigenvector of the adjacency matrix [85]. Eigenvector centrality is a natural extension of degree centrality. In-degree centrality awards equal centrality point for every link a node receives. But not all nodes are equivalent: some are more important than others based on their edge weight, and, reasonably, connections from important nodes count more. We expect that bots eigenvector centrality measure should be sig-nificantly different than non-malicious nodes and hence is used as a feature to detect botnets in this study.
Self organizing map
Self-organizing map (SOM) belongs to a class of unsupervised system that is based on competitive learning in which the output neurons compete amongst themselves to be activated. The primary goal of an SOM is to convert an incoming data of arbitrary dimension into a one or two-dimensional discrete map, and to perform this transforma-tion adaptively in a topologically ordered fashion [86]. In this study, we have considered on a particular kind of SOM known as Kohonen network that was developed by Tuevo Kohonen in 1982 [87].
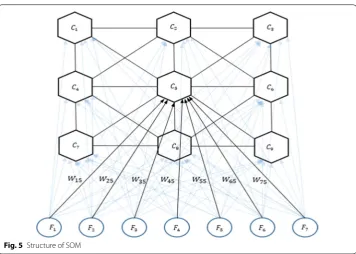
The basic structure of SOM is shown in Fig. 5, which shows a 3×3 SOM network. For this small SOM network, there are 63 connections. Notice that the map nodes (C1–C9) (1)
xv=
1
w∈M(v) av,wxw
Ax=x
are not connected to one another. In this 2-D representation of SOM, each map node has a unique (i,j) coordinate. Simultaneously, as map nodes are only connected to an input vector (F1–F7), map nodes are never aware of what other map nodes values are.
A map node’s weight (W) will only be updated if and only if allowed by the input vector. Algorithm 1 illustrates the basic methodology behind SOM.
In this study, we have used a 5×5 network. Weights of each map node in the network are initially assigned with seven random values, one for each element in the input vector. After that, input vectors each containing these seven features are presented to the net-work. Thenceforth, step 3–5 is followed to get the desired number of clusters.
In its essence, algorithm 1 is essentially screening the dataset and assigning the nodes to different clusters. Thus, this algorithm does not distinguish bots from non bots. Hence another algorithm is developed to detect bots in the clusters. This bot detection algorithm, which is run after algorithm 1, is illustrated below:
In this study the number of nodes in all clusters besides the cluster with largest num-ber of nodes, an indicator of the numnum-ber of nodes needed to be searched further to iden-tify the bots, is denoted by Ns. This parameter is a measure of the efficacy of the filtering
performed by the SOM clustering. After this filtering step, a practitioner would use other methods to detect bots within the remaining nodes (e.g., statistical classification, signature analysis, or consultation with subject matter experts).
Case study‑detecting bots in CTU‑13
We apply SOM to the CTU-13 dataset to investigate the effectiveness and efficiency of our proposed method. An enhanced filtering algorithm, based on the degree of bots, is proposed to further improve the botnet detection efficiency. The results are bench-marked against a support vector machine based classification algorithm to demonstrate the strength of our proposed procedure.
Graph features extraction
We first extract the seven graph-based features of CTU-13 data sets as discussed in “Proposed graph based clustering”. Because the CTU-13 data sets contains more than 20 million NetFlow records, High performance computing is needed to speed up the extrac-tion of graph-based features. The computaextrac-tion tasks of feature extracextrac-tion are performed using the Shadow-2 system, a super computer cluster available at The high performance computing collaboratory (HPC2) of Mississippi State University. The Shadow system is
equipped with a Cray CS300-LC cluster with 4800 Intel Ivy Bridge processor cores and 28,800 Intel Xeon Phi cores; each compute node has 20 processors. All the processors share the 500 GB memory available to them. However, in this study, only one processor was used as sequential algorithm was implemented for extracting feature values. With the aid of high performance computing capacity, we are able to the graph-based features from all CTU-13 data sets within 30 h. The resultant graph-based features are numbered and labeled by Feature 1–Feature 7 for the notational convenience, as shown in Table 2.
Graph based botnet detection using clustering
dataset-6. There is a total number of 25 cells, each representing a possible cluster of graph-based features. We chose the total number of cells to be 25 so that the SOM algo-rithm captures various types of node behaviors while not significantly increasing com-putation costs.
The numbers in each cell represent the total number of nodes that belong to the corresponding cluster. These nodes share similar behaviors in terms of the identified graph-based features. For example, there exist 105,672 nodes in the biggest cluster (in blue), which accounts for over 99% of nodes in dataset 6. Note that abnormal/malicious behaviors are rare in most of real-world networks. These nodes are unlikely to be bots. This helps to narrow down the identification of bots to the remaining few nodes, which account for less than 1% of the total nodes. Similar observations are made for the other CTU-13 datasets that the majority of nodes belongs to the biggest cluster and can be eliminated from the consideration of bot detection (see Table 3). For most datasets, the biggest cluster consists of over 99% of nodes. This allows us to eliminate majority of the dataset for further bot identification, significantly reducing the cost of computation.
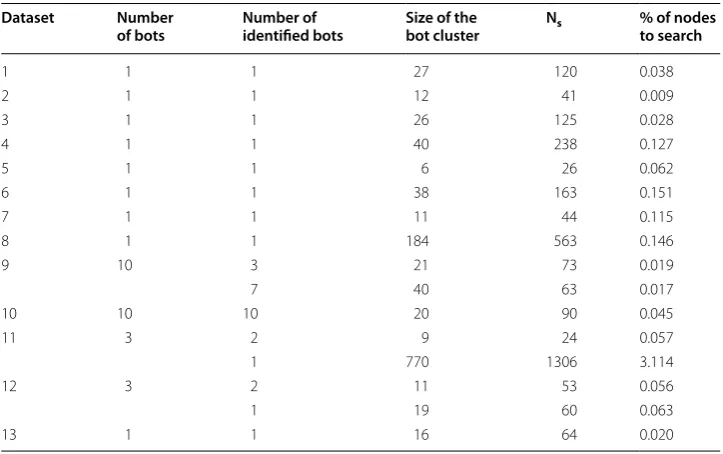
We apply the proposed bot search algorithm (Algorithm 2) to the clusters obtained via SOM. Table 4 shows the number of nodes to search (Ns) to identify all bots in each
data set. The sizes of clusters that include the bots are also reported. Bots can be isolated in small clusters for most data sets. As a result, bots can be identified by examining a limited number of nodes, i.e., small Ns values. For dataset 11, which contains three bots,
the proposed algorithm requires searching only 24 nodes to identify the first two bots. However, it requires searching additional 1306 nodes to identify the third bot in this data set. The last column represents the percentage of nodes to be examined to identify the bots in each dataset, which is calculated as the ratio between Ns and the total
num-ber of nodes. For most of the data sets, the proposed algorithm only requires examining less than 0.2% of the total nodes to identify all bots. This will significantly reduce the required computation costs.
Table 2 Graph‑based features used for clustering
1 2 3 4 5 6 7
In degree Out degree Sum of ingoing
edges weight Sum of outgoing edges Weight Clustering coefficient Node between-ness Eigen vector
Enhanced bot detection via filtering
To improve the efficiency of bot detection, we apply a filtering algorithm by removing the single-degree nodes before clustering. These nodes have one connection only and remain inactive during most of the period of data collection. Considering that the nature of bots is to attack and infest normal nodes, these nodes are highly unlikely to be bots. We filtered out these nodes and run the SOM clustering algorithm based on the graph features of the remaining nodes. The filtering step significantly reduces the number of nodes contained in the clusters of bots. For example, Fig. 7 shows that the number of nodes in the bot cluster of dataset seven drops from 11 to 8, making the bot easier to identify. A similar decrease is also observed for clusters of normal nodes.
Table 3 Number of nodes in the biggest cluster (normal nodes)
Dataset No. of nodes No. of nodes in
the biggest cluster % of nodes to be eliminated for bot detection
1 311,420 309,741 99.4608
2 442,471 440,505 99.5556
3 434,988 433,852 99.7388
4 186,245 185,042 99.3540
5 41,658 40,874 98.1180
6 107,343 105,672 98.4433
7 38,205 37,260 97.5265
8 383,788 382,670 99.7086
9 367,264 366,271 99.7296
10 197,824 196,996 99.5814
11 41,933 40,603 96.8282
12 94,436 93,104 98.5895
13 315,769 313,326 99.2263
Table 4 Number of nodes to search for bot identification (Ns)
Dataset Number
of bots Number of identified bots Size of the bot cluster Ns % of nodes to search
1 1 1 27 120 0.038
2 1 1 12 41 0.009
3 1 1 26 125 0.028
4 1 1 40 238 0.127
5 1 1 6 26 0.062
6 1 1 38 163 0.151
7 1 1 11 44 0.115
8 1 1 184 563 0.146
9 10 3 21 73 0.019
7 40 63 0.017
10 10 10 20 90 0.045
11 3 2 9 24 0.057
1 770 1306 3.114
12 3 2 11 53 0.056
1 19 60 0.063
As a result, the numbers of nodes to search for bot identification (Ns) are shown in
Table 5. Significant reduction in Ns can be observed. For example, 1306 nodes need to be
searched for identifying the third bot in dataset 11. After filtering, 384 nodes need to be searched only, a reduction of over 2% of the total number of nodes. For dataset 12, the two clusters containing bots are combined into one after filtering, requiring searching 36 nodes only compared to 113 nodes before clustering. However, we also observed the Ns
values slightly increase for datasets 5 and 6, which may result from randomness of the clustering algorithm.
Benchmark against classification
We compare our approach with a detection method based on support vector machine (SVM), which is a supervised machine learning technique used for classification and regression analysis [88–90]. MATLAB packages are used for implementing SVM clas-sification. We train SVM using datasets 9 and 10, and apply the SVM classifier on the remaining CTU-13 data sets. The number of detected bots in each dataset using SVM classifiers are presented in Table 6. Results show that the SVM classifier is capable of
Fig. 7 Size of bot cluster in dataset 7 before and after filtering (star is the bot)
Table 5 Improvement of Ns using filtering
Dataset Botnet detection without filtering Botnet detection without filtering
Ns % of nodes to search Ns % of nodes to search
1 120 0.038 115 0.036
3 125 0.028 96 0.022
4 238 0.127 181 0.097
5 26 0.062 65 0.156
6 163 0.151 252 0.234
7 44 0.115 40 0.104
8 563 0.146 307 0.079
10 90 0.045 77 0.038
11 24 0.057 21 0.050
1306 3.114 384 0.915
12 53 0.056 36 0.038
detecting the bot in dataset 2 only. For the rest of datasets, the bots cannot be detected. The results did not improve when other data sets are used for training.
The graph-based features (Features 1–7) of bots vary tremendously across all 13 data-sets. The range of Features 1–7 associated with bots is summarized in Fig. 8. For exam-ple, the values of Feature 1 range from 1 to 6842; and those of Feature 2 values range from 3 to 11,571 across the bots in CTU-13 datasets. Similar observations are made for the other features. This means that there is no interval for the value of Features 1–7 indi-cating bots. In other words, the value range of graph-based features associated with bots is so large that it also includes a portion of normal nodes, and thus, the bots cannot be distinguished from normal nodes only based on the values/intervals of features. This Table 6 Number of detected bots using SVM
Testing dataset Actual bot Detected bot
Training scenario: 9 Training scenario: 10
1 1 0 0
2 1 1 1
3 1 0 0
4 1 0 0
5 1 0 0
6 1 0 0
7 1 0 0
8 1 0 0
11 3 0 0
12 3 0 0
13 1 0 0
partially explains why the classification- or rule based bot detection methods (e.g., SVM) may not be able to detect the bots, since these methods rely on estimating the intervals of feature values to distinguish bots from normal dots, which vary tremendously from one dataset to another. Therefore, the classifier trained using one dataset may not apply for another. On the other hand, our method is more robust against the changing values of features. As long as the bots behave differently from normal nodes, and as long as the graph-based features of bots are different from those of normal nodes, such different behaviors can be captured by our clustering-based detection algorithm.
Conclusions
In this work, we propose a graph-based botnet detection approach that can detect changing behaviors of bots. This is novel because the existing approaches mainly rely on flow based features and thus do not capture the changes in the topological structure of networks caused by bot activities. We investigate seven graphed-based features that are may be connected to bot activities: in degree, out degree, in degree weight, out degree weight, clustering coefficient, node betweenness, and eigenvector centrality. SOM is applied to establish the clusters of nodes based on these graph features. Our approach is capable of isolating bots in clusters with very small sizes (less than 100 nodes), which enables fast detection of bot nodes. The proposed algorithm is further enhanced by fil-tering out inactive nodes, which are unlikely to be bots. We verify the proposed methods using CTU-13 datasets, the largest dataset that consists of bot-labeled nodes. Numerical results show that our proposed procedure is capable of detecting the bots by searching limited number of nodes (less than 0.1% of all nodes).
We compare our approach with a classification-based SVM detection algorithm using the same graph-based features. The SVM method is not capable of detecting most of the bots because of the varying values of bot features across different datasets. The advan-tage of our approach is that we focusing on capturing the abnormal behaviors of bots in terms of their graph-based behaviors. In other words, our method is more robust against the changing behaviors of bots because the proposed approach does not rely on any particular value/range of features. With different types of bot behavior, the proposed method can still detect bot with reasonable accuracy. What this approach ensures is that, bots will be found in small sized clusters with the majority of nodes (>99%) removed from further consideration. Numerical results from our study shows that, as long as the bots behave differently from normal nodes, such different behaviors can be captured by our clustering-based detection algorithm. Future work is needed to incorporate addi-tional graph-based features and reduce the computaaddi-tional costs of graph feature extrac-tion. Note that, as feature extraction cost contributes to the overall computational cost, future work is needed to investigate how feature extraction cost can be minimized. Effect of incorporating more relevant graph based features into the detection methodology is also a future research direction.
Note to the practitioners
botnets efficiently and in a faster manner. This method can be applicable for any real world network with varying bot characteristics. In this study, seven different types of bots were present which had been detected successfully. This method also reduces the large dataset into smaller ones that lessens the computational burden significantly. This is particularly useful for real world practitioners who work with real world dataset that are often huge. Hence, this detection approach can help them in ensuring cyber network integrity and protect it from future botnet attacks.
Authors’ contributions
SC, MK, RA, and FZ were responsible for developing methodology, processing data, and running experiments. They also prepared the manuscript. SZ, HM, MM, and LB supervised the work and provided guidelines on the preparation of the manuscript. All authors read and approved the final manuscript.
Authors’ information
Sudipta Chowdhury received his B.SC. in Industrial and Systems Engineering from Shahjalal University of Science and Technology in 2014. He is currently pursuing his Ph.D. degree at the department of Industrial and Systems Engineering in Mississippi State University.
Mojtaba Khanzadehdaghalian is currently pursuing his Ph.D. degree at the department of Industrial and Systems Engineering in Mississippi State University.
Ravi Akula is currently pursuing his M.S. degree at the department of Industrial and Systems Engineering in Missis-sippi State University.
Fangyan Zhang is currently pursuing his Ph.D. degree at the department of Computer Science and Engineering Engineering in Mississippi State University.
Song Zhang is an Associate Professor at the department of Computer Science and Engineering Engineering in Mississippi State University. His research interests include Scientific Visualization, Data Analysis, Medical Imaging, and Computer Graphics.
Hugh Medal is an Assistant Professor at Industrial and Systems Engineering department in Mississippi State University. His research interests include transportation logistics, supply chain design and management, and network optimization.
Mohammad Marufuzzaman received his Ph.D. in Industrial and Systems Engineering from Mississippi State University in 2014. He received his MASc degree in Industrial and Systems Engineering from University of Regina in 2010 and B.Sc. degree in Industrial and Production Engineering from Shahjalal University of Science and Technology in 2006. He is cur-rently working as an Assistant Professor at Industrial and Systems Engineering department in Mississippi State University as well as serving as a co-director of Analytics and Optimization LAB. His main areas of interest are in supply chain opti-mization with applications in renewable energy, stochastic programming, decomposition methods, solving large scale supply chain network problems, and supply chain risk management.
Linkan Bian received his Ph.D. in Industrial and Systems Engineering from Georgia Institute of Technology in 2013. He also holds dual M.S. degree in Statistics and Mathematics from Michigan State University, and a B.S. degree in Applied Mathematics from Beijing University. Presently, he is working as an Assistant Professor at the Industrial and Systems Engineering department in Mississippi State University. He is also the co-director of Analytics and Optimization LAB. His research focuses on the combination of advanced statistics and stochastic methods for system modeling, diagnosis, and prognosis. Applications of his research include advanced manufacturing systems and supply chains.
Author details
1 Department of Industrial and Systems Engineering, Mississippi State University, Starkville, MS 39759-9542, USA. 2 Department of Computer Science and Engineering, Mississippi State University, Starkville, MS 39759-9542, USA.
Competing interests
The authors declare that they have no competing interests. Funding
Funding for this work was provided by the Pacific Northwest National Laboratory, under US Department of Energy Contract DE-AC05-76RL01830.
Publisher’s Note
Springer Nature remains neutral with regard to jurisdictional claims in published maps and institutional affiliations.
Received: 2 March 2017 Accepted: 25 April 2017
References
2. Barford P, Yegneswaran V. An inside look at botnets. Special workshop on malware detection: advances in informa-tion security; 2006.
3. F-scure. Articles: botnets; 2016. https://www.f-secure.com/en/web/labs_global/botnets. Accessed 21 Feb 16. 4. Zeidanloo HR, Shooshtari MJZ, Amoli PV, Safari M, Zamani M. A taxonomy of botnet detection techniques. In: 2010
3rd IEEE international conference on computer science and information technology (ICCSIT), vol 2. New York: IEEE;. 2010. p. 158–62.
5. Ianelli N, Hackworth A. Botnets as a vehicle for online crime; 2005. https://resources.sei.cmu.edu/asset_files/White-Paper/2005_019_001_51249.pdf. Accessed 24 Apr 2016.
6. Bacher P, Holz T, Kotter M, Wicherski G. Know your enemy: tracking botnets; 2008. https://www.honeynet.org/ papers/bots/. Accessed 24 Apr 2016.
7. Kaspersky. What is botnet attack? 2016. https://usa.kaspersky.com/internet-security-center/threats/botnet-attacks#. V1du3TUrIdV. Accessed 21 Feb 16.
8. Sonawane SR. A review on botnet and botnet detection methods. Int J Comput Sci Innov. 2016;1:107–16. 9. Fadlullah ZM, Taleb T, Vasilakos AV, Guizani M, Kato N. DTRAB: combating against attacks on encrypted protocols
through traffic-feature analysis. IEEE/ACM Trans Netw (TON). 2010;18(4):1234–47.
10. Zhang J, Chen C, Xiang Y, Zhou W, Xiang Y. Internet traffic classification by aggregating correlated naive bayes predictions. IEEE Trans Inf Forens Secur. 2013;8(1):5–15.
11. Zhang J, Xiang Y, Wang Y, Zhou W, Xiang Y, Guan Y. Network traffic classification using correlation information. IEEE Trans Parallel Distrib Syst. 2013;24(1):104–17.
12. Zhang J, Chen C, Xiang Y, Zhou W, Vasilakos AV. An effective network traffic classification method with unknown flow detection. IEEE Trans Netw Serv Manag. 2013;10(2):133–47.
13. Yan Z, Zhang P, Vasilakos AV. A security and trust framework for virtualized networks and software-defined networking. Security and communication networks; 2015. https://www.researchgate.net/profile/Zheng_Yan4/ publication/274322323_A_Security_and_Trust_Framework_for_Virtualized_Networks_and_Software-Defined_Net-working/links/551ec3a40cf29dcabb08303a.pdf. Accessed 9 Dec 2016.
14. Shu Z, Wan J, Li D, Lin J, Vasilakos AV, Imran M. Security in software-defined networking: threats and countermeas-ures. Mob Netw Appl. 2016;21(5):764–76.
15. Zhang J, Perdisci R, Lee W, Sarfraz U, Luo X. Detecting stealthy P2P botnets using statistical traffic fingerprints. In: 2011 IEEE/IFIP 41st international conference on dependable systems & networks (DSN). New York: IEEE; 2011. p. 121–32.
16. Choi H, Lee H. Identifying botnets by capturing group activities in DNS traffic. Comput Netw. 2012;56(1):20–33. 17. Livadas C, Walsh R, Lapsley D, Strayer WT. Usilng machine learning technliques to identify botnet traffic. In: 2006 31st
IEEE conference on local computer networks, Proceedings. New York: IEEE; 2006. p. 967–74.
18. Strayer WT, Lapsely D, Walsh R, Livadas C. Botnet detection based on network behavior. In: Botnet Detection. Berlin: Springer; 2008. p. 1–24.
19. Zhao D, Traore I, Sayed B, Lu W, Saad S, Ghorbani A, Garant D. Botnet detection based on traffic behavior analysis and flow intervals. Comput Secur. 2013;39:2–16.
20. Strayer WT, Walsh R, Livadas C, Lapsley D. Detecting botnets with tight command and control. In: 2006 31st IEEE conference on local computer networks, Proceedings. New York: IEEE; 2006. p. 195–202.
21. Zeidanloo HR, Manaf AB, Vahdani P, Tabatabaei F, Zamani M. Botnet detection based on traffic monitoring. In: 2010 international conference on networking and information technology (ICNIT). New York: IEEE; 2010. p. 97–101. 22. Argus (audit record generation and utilization system); 2016. http://www.qosient.com/argus. Accessed 21 Feb 2016. 23. Karasaridis A, Rexroad B, Hoeflin DA. Wide-scale botnet detection and characterization. HotBots. 2007;7:7. 24. Gu G, Perdisci R, Zhang J, Lee W. BotMiner: clustering analysis of network traffic for protocol- and
structure-inde-pendent botnet detection. In: USENIX security symposium, vol. 5, no.2. Berkeley, CA, USA: USENIX Association; 2008. p. 139–54.
25. Arshad S, Abbaspour M, Kharrazi M, Sanatkar H. An anomaly-based botnet detection approach for identifying stealthy botnets. In: 2011 IEEE international conference on computer applications and industrial electronics (ICCAIE). New York: IEEE; 2011. p. 564–9.
26. Amini P, Azmi R, Araghizadeh M. Botnet detection using NetFlow and clustering. Adv Comput Sci Int J. 2014;3(2):139–49.
27. Lu W, Rammidi G, Ghorbani AA. Clustering botnet communication traffic based on n-gram feature selection. Com-put Commun. 2011;34(3):502–14.
28. Goebel J, Holz T. Rishi: identify bot contaminated hosts by IRC nickname evaluation. In: USENIX workshop on hot topics in understanding botnets (HotBots’07); 2007.
29. Binkley JR, Singh S. An algorithm for anomaly-based botnet detection. SRUTI. 2006;6:7–7.
30. Gu G, Zhang J, Lee W. BotSniffer: detecting botnet command and control channels in network traffic; 2008. 31. Al-Duwairi B, Al-Ebbini L. BotDigger: a fuzzy inference system for botnet detection. In: 2010 fifth international
con-ference on internet monitoring and protection (ICIMP). New York: IEEE; 2010. p. 16–21.
32. AsSadhan B, Moura JM, Lapsley D, Jones C, Strayer WT. Detecting botnets using command and control traffic. In: 2009 NCA 2009. eighth IEEE international symposium on network computing and applications. New York: IEEE; 2009. p. 156–62.
33. Venkatesh B, Choudhury SH, Nagaraja S, Balakrishnan N. BotSpot: fast graph based identification of structured P2P bots. J Comput Virol Hacking Tech. 2015;11(4):247–61.
34. Ding Q, Katenka N, Barford P, Kolaczyk E, Crovella M. Intrusion as (anti) social communication: characterization and detection. In: Proceedings of the 18th ACM SIGKDD international conference on Knowledge discovery and data mining. New York: ACM; 2012. p. 886–94.
36. Henderson K, Gallagher B, Li L, Akoglu L, Eliassi-Rad T, Tong H, Faloutsos C. It’s who you know: graph mining using recursive structural features. In: Proceedings of the 17th ACM SIGKDD international conference on Knowledge discovery and data mining. New York: ACM; 2011. p. 663–71.
37. Kang U, McGlohon M, Akoglu L, Faloutsos C. Patterns on the connected components of terabyte-scale graphs. In: 2010 IEEE 10th international conference ondata mining (ICDM). New York: IEEE; 2010. p. 875–80.
38. Aggarwal CC. Outlier ensembles: position paper. ACM SIGKDD Explor Newsl. 2013;14(2):49–58.
39. Zimek A, Campello RJ, Sander J. Ensembles for unsupervised outlier detection: challenges and research questions a position paper. ACM SIGKDD Explor Newsl. 2014;15(1):11–22.
40. Chen HH, Giles CL. ASCOS: an asymmetric network structure context similarity measure. In: 2013 IEEE/ACM interna-tional conference on advances in social networks analysis and mining (ASONAM). New York: IEEE; 2013. p. 442–49. 41. Sun H, Huang J, Han J, Deng H, Zhao P, Feng B. Gskeletonclu: density-based network clustering via
structure-connected tree division or agglomeration. In: 2010 IEEE 10th international conference on data mining (ICDM). New York: IEEE; 2010. p. 481–90.
42. Tong H, Lin CY. Non-negative residual matrix factorization with application to graph anomaly detection. In: Proceed-ings of the 2011 SIAM international conference on data mining. Society for industrial and applied mathematics. 2011. p. 143–53.
43. Ambai M, Utama NP, Yoshida Y. Dimensionality reduction for histogram features based on supervised non-negative matrix factorization. IEICE Trans Inf Syst. 2011;94(10):1870–9.
44. Nikulin V, Huang TH. Unsupervised dimensionality reduction via gradient-based matrix factorization with two adap-tive learning rates. In: ICML unsupervised and transfer learning. 2012. p. 181–94.
45. Davis M, Liu W, Miller P, Redpath G. Detecting anomalies in graphs with numeric labels. In: Proceedings of the 20th ACM international conference on Information and knowledge management. New York: ACM; 2011. p. 1197–202. 46. Eberle W, Holder L. Discovering structural anomalies in graph-based data. In:seventh IEEE international conference
on data mining workshops, 2007. ICDM workshops 2007. New York: IEEE; 2007. p. 393–8. 47. Kontkanen P, Myllymäki P. MDL Histogram Density Estim Rn. 2007;1000:2.
48. Gao J, Liang F, Fan W, Wang C, Sun Y, Han J. On community outliers and their efficient detection in information net-works. In: Proceedings of the 16th ACM SIGKDD international conference on Knowledge discovery and data mining. New York: ACM; 2010. p. 813–22.
49. Muller E, Sánchez PI, Mulle Y, Bohm K. Ranking outlier nodes in subspaces of attributed graphs. In: 2013 IEEE 29th international conference ondata engineering workshops (ICDEW). New York: IEEE; 2013. p. 216–22.
50. Perozzi B, Akoglu L, Iglesias Sánchez P, Müller E. Focused clustering and outlier detection in large attributed graphs. In: Proceedings of the 20th ACM SIGKDD international conference on Knowledge discovery and data mining. New York: ACM; 2014. p. 1346–55.
51. Kang U, Papadimitriou S, Sun J, Tong H. Centralities in large networks: algorithms and observations. In: Proceedings of the 11th SIAM international conference on data mining (SDM), Mesa,AZ, 2011b. p 119–30.
52. Gao X, Xiao B, Tao D, Li X. A survey of graph edit distance. Pattern Anal Appl. 2010;13(1):113–29.
53. Bunke H, Dickinson PJ, Kraetzl M, Wallis WD. A graph-theoretic approach to enterprise network dynamics, Vol. 24. Berlin: Springer Science & Business Media; 2007.
54. Akoglu L, Faloutsos C. Event detection in time series of mobile communication graphs. In: army science conference. 2010. p. 77–9.
55. Rossi RA, Gallagher B, Neville J, Henderson K. Modeling dynamic behavior in large evolving graphs. In: Proceedings of the sixth ACM international conference on web search and data mining. New York: ACM; 2013. p. 667–76. 56. Ishibashi K, Kondoh T, Harada S, Mori T, Kawahara R, Asano S. Detecting anomalous traffic using communication
graphs. In: telecommunications: the infrastructure for the 21st century (WTC), 2010. VDE; 2010. p. 1–6. 57. Papalexakis EE, Faloutsos C, Sidiropoulos ND. Parcube: sparse parallelizable tensor decompositions. In: joint
euro-pean conference on machine learning and knowledge discovery in databases. Berlin: Springer; 2012. p. 521–36. 58. Leskovec J, Lang KJ, Mahoney M. Empirical comparison of algorithms for network community detection. In:
Pro-ceedings of the 19th international conference on World wide web. New York: ACM; 2010. p. 631–40. 59. Peel L, Clauset A. Detecting change points in the large-scale structure of evolving networks. arXiv:1403.0989. 60. Li L, Mathur S, Coskun B. Gangs of the internet: towards automatic discovery of peer-to-peer communities. In: 2013
IEEE conference on communications and network security (CNS). New York: IEEE; 2013. p. 64–72.
61. Malware capture facility project. The CTU-13 dataset: a labeled dataset with botnet, normal and background traffic 2016. http://mcfp.weebly.com/the-ctu-13-dataset-a-labeled-dataset-with-botnet-normal-and-background-traffic. html. Accessed 26 Jan 2016.
62. Collins MP, Reiter MK. Hit-list worm detection and bot identification in large networks using protocol graphs. In: international workshop on recent advances in intrusion detection. Berlin: Springer; 2007. p. 276–95.
63. Wang J, Paschalidis IC. Botnet detection using social graph analysis. In: 2014 52nd annual allerton conference on communication, control, and computing (Allerton). New York: IEEE; 2014. p. 393–400.
64. Iliofotou M, Kim HC, Faloutsos M, Mitzenmacher M, Pappu P, Varghese G. Graption: a graph-based P2P traffic clas-sification framework for the internet backbone. Comput Netw. 2011;55(8):1909–20.
65. Zhao Y, Xie Y, Yu F, Ke Q, Yu Y, Chen Y, Gillum E. BotGraph: large scale spamming botnet detection. In: Nsdi ,vol. 9. p. 321–34.
66. Jaikumar P, Kak AC. A graph theoretic framework for isolating botnets in a network. Secur Commun Netw. 2015;8(16):2605–23.
67. Nagaraja S, Mittal P, Hong CY, Caesar M, Borisov N. BotGrep: finding P2P bots with structured graph analysis. In: USENIX security symposium. 2010. p. 95–110.
68. François J, Wang S, Engel T. BotTrack: tracking botnets using NetFlow and PageRank. In: international conference on research in networking. Berlin: Springer. 2011. p. 1–14.
70. Hang H, Wei X, Faloutsos M, Eliassi-Rad T. Entelecheia: detecting p2p botnets in their waiting stage. In: IFIP network-ing conference, 2013. New York: IEEE; 2013. p. 1–9.
71. Tsai CW, Lai CF, Chao HC, Vasilakos AV. Big data analytics: a survey. J Big Data. 2015;2(1):21.
72. Fong S, Wong R, Vasilakos AV. Accelerated PSO swarm search feature selection for data stream mining big data. IEEE Trans Serv Comput. 2016;9(1):33–45.
73. Garcia S, Grill M, Stiborek J, Zunino A. An empirical comparison of botnet detection methods. Comput Secur. 2014;45:100–23.
74. Grill M, Pevný T, Rehak M. Reducing false positives of network anomaly detection by local adaptive multivariate smoothing. J Comput Syst Sci. 2017;83(1):43–57.
75. Chanthakoummane Y, Saiyod S, Benjamas, N Khamphakdee N. Evaluation Snort-IDS rules for botnets detection; 2016. http://www.it.kmitl.ac.th/~natapon/ncit2015/papers/p87-chanthakoummane.pdf. Accessed 11 Apr 2016. 76. Małowidzki M, Berezinski P, Mazur M. Network intrusion detection: half a kingdom for a good dataset. In
Proceed-ings of NATO STO SAS-139 Workshop, Portugal; 2015. 77. Graph-tool. https://graph-tool.skewed.de/.
78. Technopedia.data packet. 2016. https://www.techopedia.com/definition/6751/data-packet. Accessed 05 May 2016. 79. Rafiei D. Effectively visualizing large networks through sampling. In: visualization, 2005. VIS 05. IEEE. New York: IEEE;
2005. p. 375–82.
80. Brandes U. A faster algorithm for betweenness centrality. J Math Sociol. 2001;25(2):163–77.
81. Rocchini C. Hue scale representing node betweenness on a graph; 2007. https://commons.wikimedia.org/w/index. php?curid=1988980. Accessed 05 Apr 2015.
82. Watts DJ, Strogatz SH. Collective dynamics of ‘small-world’networks. Nature. 1998;393(6684):440–2. 83. Langville AN, Meyer CD. A survey of eigenvector methods for web information retrieval. SIAM rev.
2005;47(1):135–61.
84. Kifer Y. Perron-Frobenius theorem, large deviations, and random perturbations in random environments. Math Z. 1996;222(4):677–98.
85. Newman MEJ. The mathematics of networks. In: Durlauf SN, Blume LE, editors. The new palgrave dictionary of economics. 2nd ed. Basingstoke: Imprint Palgrave Macmillan; 2008.
86. Bullinaria JA. Self-organizing maps: fundamentals; 2004. http://www.cs.bham.ac.uk/~jxb/NN/l16.pdf. Accessed 13 Jun 2016.
87. Guthikonda SM, Kohonen. Self-organizing maps. 2005. http://www.shy.am/wp-content/uploads/2009/01/kohonen-self-organizing-maps-shyam-guthikonda.pdf. Accessed 20 Jan 1016.
88. Cortes C, Vapnik V. Support-vector networks. Mach Learn. 1995;20(3):273–97.
89. Malhotra R, Jain A. Fault prediction using statistical and machine learning methods for improving software quality. J Inf Process Syst. 2012;8(2):241–62.
![Table 1 Amount of data on each botnet scenario [55]](https://thumb-us.123doks.com/thumbv2/123dok_us/857513.1583337/9.595.118.479.580.712/table-amount-of-data-on-each-botnet-scenario.webp)