3690
Predicting Malnutrition Disease Using Various
Machine Learning Algorithms
Rahamuddin Khan, Manish Ahirwar, Piyush kumar shukla
Abstract: Healthcare evaluates clinical datasets regularly by specialist's learning and action. In the clinical field, compu ter-supported with prediction system is used in the healthcare department. Malnutrition is a situation that c omes by eating a diet in which one or more nutrients are in imbalanc e or are too muc h such that the f ood c a us es health related problems. It may invol ve c arbohydrates , vitamins or minerals proteins , c alorie. Malnutrition c an lead to c omplic ations such as gas troenteritis, pneumonia, malaria, and measles. Enhanc ed predictive analysis f or malnutrition dis eas e using regression algorithms is a c onfronted t ask to help doc tors f or diagnos ing th e malnutrition patients. In this paper the work s ets out to mak e c omparative evaluation of class ifiers f or ac hieving higher classific ation acc urac y using W EKA tool and at last, the res ult is obtained. The experiment res ults s hown are about prediction accuracy, precision, rec all and ROC curve. The results in this work on Malnutrition datas et show that proc ess ing efficienc y and prediction acc urac y of linear regression is better than that of , k-neares t neighbor, decis ion tr ee, and multilayer perc eptron regression algorithms .
Keywords: malnutrition, healthcare, machine learning, prediction, linear regression, decision tree, KNN, multilayer perceptron.
————————————————————
1.
INTRODUCTION
Health care is the preservation or development of health via avoiding, diagnosis, and medical care of diseases, sickness, injury, and other physical and mental debilitate in human being. These days, the malnutrition ailments are a standout amongst the most real issue looked by our society.[1] The quantity of patients with undernourishment or over nutrition illnesses developing step by step however never decreases. In addition, this sort of maladies causes in excess of 500,000 passings in India every year and is presently the main foundation of death in India.
Currently, healthcare domain is to offer better for people 24*7 throughout the world in a more beneficial and in a very friendly or convenient way. Unfortunately millions of people sustain from various Malnutrition diseases, and Malnutrition is the primary cause of Death in the world and increasing of diseases mainly due to the negligence of their health because they don't have time for themselves and forget about their health protection due to a massive workload.[2].Our period have been seeing excess of immedicable and grim medical problems. With the expediently developing requirement for auspicious therapeutic office, the customary strategy for treatment at the centre or clinic all the more regularly misses the mark in bringing out achievement in numerous crisis cases.[3]. That implies the physical position of patients ought to be observed by doctors or medicinal consideration, who will then choose when to convey human services office dependent on patients' continuous condition. The substantive job of this inescapable human services mode is the continuous observing framework [4]. With the advancement in connected science, heaps of savvy or therapeutic sensors appeared that ceaselessly examinations
singular patient movement and naturally predicts a hrv assault. In the medicinal territory, these days quiet take dynamic job in accumulating and looking into their report [5].
2 LITERATURE REVIEW
Tanhim Islam, Tanjir Alam Chisty, Prova Roy.et al. during this paper, —Bangladesh has the very best rate of deficiency disease round the world. over nine.5 million kids suffer from deficiency disease and 50 to 60 % of girls in Asian country have less BMI. deficiency disease in kids, adolescents and girls could be a major concern. what is more, health professional human shows tolerance to produce care resolution in a very remote location or in rural areas. For the aim of determination this drawback, we have a tendency to build autonomous automaton that interacts and communicates with humans which might queries and answers concerning care queries showing intelligence, will acknowledge food and shows essential food nutrients singly and supply nutrition set up, health report separately.Jorge Ribeiro , David Ribeiro et al., Malnutrition is understood to be a significant concern among older adults. whether or not is it as a result of social-economic reasons or low nutritionary data, older adults generally struggle to possess healthy, varied, and reasonable diet. There are already some solutions within the market that try and raise awareness to people’s dangerous habits or to guide them towards additional healthy uptake ones. However, such solutions don't address the actual wants of older adults or are restricted in scope. Bambang Lareno, Liliana Swastina et al. this paper presents Changes in toddler’s weight among a precise time is early indication of kid nutritionary circumstances. within the six-month amount, infants failed to gain weight a pair of times, were in danger of deficiency disease 12.6 times than those with regular weight gain. supported this, the load modification info are often the parameter to mapping the potential deficiency disease issues.
3 PROBLEM DEFINITION
Health support of each individual should be considered a very important in today’s word because of rise in many health problems. There are many people over the world suffering from Malnutrition disease only due to lack of early detection of disease, malnutrition disease is a matter of great concern and thus many efforts are ————————————————
Rahamuddin Khan, Department of Computer Science, Rajiv Gandhi Proudyogiki Vishwavidyalaya, Bhopal, India e-mail: [email protected]
Manish Ahirwar, , Department of Computer Science, Rajiv Gandhi Proudyogiki Vishwavidyalaya, Bhopal, India,
e-mail: [email protected]
Piyush Kumar Shukla,Department of Computer Science, Rajiv Gandhi Proudyogiki Vishwavidyalaya, Bhopal, India. e-mail: [email protected]
devoted in most developed countries to design of automatic system for detecting this disease based on IoT. The sensor based device can be very useful to detect undernourishment or over nutrition and take necessary action by using regression algorithms. In healthcare environment no such system presents that accurately prediction the complete data of one patient to diagnose the disease in a short period of time. The previous systems take too much time to detect the disease which causes serious harm to the patients. In previous models the patient first go through various medical tests and get reports of each test individually, then doctor of each field monitor or check the test report based on some parameters and take necessary decision on the basis of the report. This process takes too much time in detecting the diseases in patients. The following are the point which identified as a problem Due to self-learning, the rate of false diagnose is high, Many proposed system does not clarify the accuracy regarding Malnutrition disease
The lack of interaction or communications of different machines so that they cannot calculate the accurate accuracy of the disease. Due to missing or abnormal values the rate of false diagnose is high. Existing work does not clarify about the data preprocessing normalization technique that will help us to enhance the accuracy of the result.
4 PROPOSED WORK
The main aim of our thesis is to find a best classifier that can classify chronic kidney disease more accurately and timely.
Figure 1. Proposed Model
As a solution we introduce a model that classify and predict the disease accurately in short period of time so that patient get quick diagnose based on the result. W e predict the disease by using the malnutrition disease dataset. The stored data is unstructured or raunchy and there may be some missing or abnormal values also. So, we have to replace an abnormal or missing value with expected value. The preprocessed data then will prediction using regression algorithm in order to calculate the accuracy of the disea se by using WEKA Tool.
Proposed Algorithms
Access the collected data from the data repository for further processing.
Load the dataset into the simulation environment i.e. W EKA Tool.
Feature Selection:- Apply Relief Attribute Eval feature selection algorit hm that the most significant attributes. Relief tests the worth of a feature or an attribute by sampling an instance repeatedly and considering the value of the given attribute for the nearest instance of the same and different class.
Apply 10-fold cross validation on the dataset.
Apply regression algorithms: Apply the regression algorithms on the dataset to calculate the accuracy of the disease.
Comparison: Compare the error of the different regression Algorithms to find the best algorithm.
5 EXPERIMENTAL & RESULT ANALYSIS
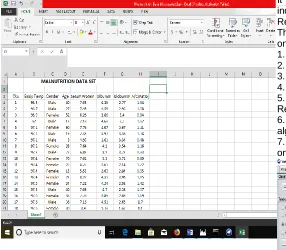
In this segment to loading the dataset of Malnutrition of different patients of cities of Madhya Pradesh. All the dataset is loaded in WEKA 3.8 toolkit software to analysis the regression model. We store the data in Ms-excel 10 text file format. In addition to the native ARFF data file format, WEKA has ability to read as ―.CSV‖ file format. All the dataset when loaded successfully we save ARFF format. In this analysis the data set consist of the parameters like.
Figure 2. Data set View
Initially (in the Pre-process table) click open and navigate to the directory containing the data file(.cvs or .arff). in this way we will open the above dataset of Malnutrition in dataset file. This is shown in fig. 3 .
Figure 3. List of recognized attributes
Linear Regression
It is a probabilistic model and in which each feature is independent from others. In that particular testing Linear Regression better result from all of the other techniques The following steps are followed to perform Linear Regression on the HRV dataset-
1. Firstly open the WEKA GUI application.
2. Then click the ―Explorer‖ button to open the WEKA Explorer. 3. Load the Malnutrition data set from dataset.csv file.
4. Click ―Classify‖ to open the Classify tab.
5. Then click the ―Choose‖ button and select ―Linear Regression‖ under the Random group‖.
6. After then click on the name of the algorithm to review the algorithm configuration.
7. Select Cross-validation folds to 10 and start the algorithm on the dataset.
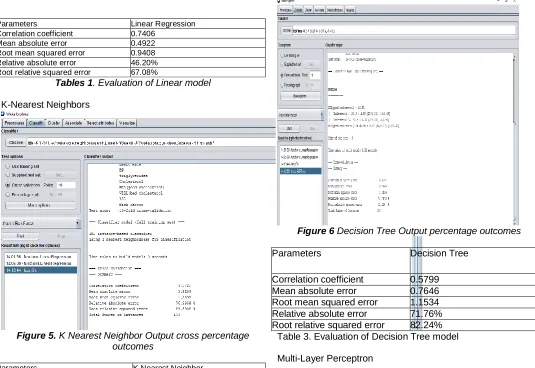
Parameters Linear Regression Correlation coefficient 0.7406
Mean absolute error 0.4922 Root mean squared error 0.9408 Relative absolute error 46.20% Root relative squared error 67.08%
Tables 1. Evaluation of Linear model
K-Nearest Neighbors
Figure 5. K Nearest Neighbor Output cross percentage outcomes
Parameters K Nearest Neighbor
Correlation coefficient 0.5725 Mean absolute error 0.8204 Root mean squared error 1.2397 Relative absolute error 77.00% Root relative squared error 88.39%
Table 2. Evaluation of K-Nearest Neighbor model
Decision Tree
Figure 6 Decision Tree Output percentage outcomes
Parameters Decision Tree
Correlation coefficient 0.5799 Mean absolute error 0.7646 Root mean squared error 1.1534 Relative absolute error 71.76% Root relative squared error 82.24%
Table 3. Evaluation of Decision Tree model
Multi-Layer Perceptron
Figure 7 Multilayer Perceptron Outputpercentage outcome
Parameters Multilayer Perceptron Correlation coefficient 0.7467
Relative absolute error 48.10% Root relative squared error 72.92%
Table 4. Evaluation of Multilayer Perceptron model
Graphs Comparison and Analysis
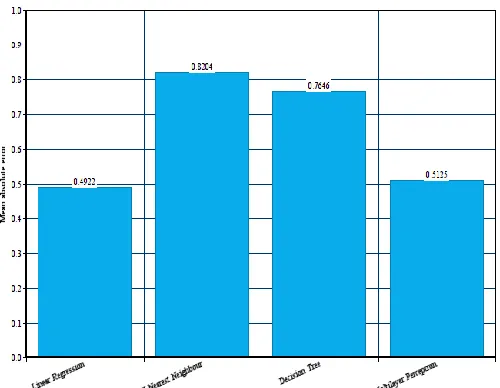
Figure 8 Comparison Graph for Mean Absolute Error
Figure 9: Comparison Graph for Root Mean Squared Error
Figure 10: Comparison Graph for Relative Absolute Error
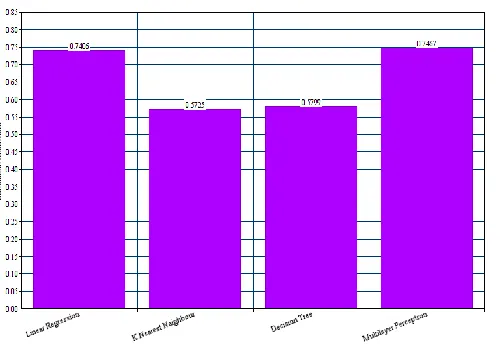
Figure 11 Correlation Coefficient
6 CONCLUSION
Linear regression gives least error in all four errors described above K Nearest Neighbor, Decision Tree and Multilayer Perceptronand has the best correlation coefficient among all regression algorithms used in this study. Multilayer perceptron is the second best among other regression algorithms. Decision Tree performed better than KNN but was less accurate than Linear Regression and Multilayer perceptronKNN performed the worst among all the algorithms with most error Linear Regression, Decision Tree, Multilayer Perceptronamong all errors and the least correlation coefficient.
REFERENCES
[1] Tanhim Islam, Tanjir Alam Chisty, Prova Roy, Israt Sahira Rafa," Sasthyakathan - A Health Based Social Robot" in IEEE 2019 .
[2] Jorge Ribeiro , David Ribeiro , Ayla Schwarz, Maria Joao M. Vasconcelos , Filomena Gerardo, Ciska van Harten , Riccardo Succu, Robbie Davisonk , Tiago Oliveira, Tiago Silva, Marlos Silva, " Cordon Gris: Integrated solution for meal recommendations" PerHealth'18 - 3rd IEEE PerCom Workshop on Pervasive Health Technologies.
[3] Bambang Lareno, Liliana Swastina, Husnul Maad Junaidi, " IT Application to Mapping The Potential of Malnutrition Problems".in 2018 IEEE.
[4] Vinay Kumar2 and Navakanta Bhat, ―anuPathTM : Novel Sensing Chemistry to Lab on Palm Sensor System for Diabetes and its Complications ―, in 2018 IEEE.
[5] Rene Baranyi, Bernhard Steyrer, Lukas Lechner, Gevher N. Agbektas, Nadja Lederer, Thomas Grechenig, ―NutritionRush - A Serious Game to Support People with the Awareness of Their Nutrition Intake‖, in 2017 IEEE.
[6] Piyatida Watcharapasorn and Nilubon Kurubanjerdjit,‖ The Surgical Patient Mortality Rate Prediction by machine learning algorithms‖, 2016 13th International Joint Conference on Computer Science and Software Engineering (JCSSE), IEEE.
[7] A. Arista-Jalife(1), H. A. Arista-Viveros ―Artificial Neural Networks as Auxiliary Tools in the Diagnosis of Malnutrition Related Diseases‖, IEEE 2016.
[8] Margaret H. Dunham and S. Sridhar, ―Data Mining Introductory and Advanced Topics‖, ISBN: 0130888923, Pearson Education, Inc., Copyright 2003.
[9] S. R., ―Artificial neural networks for automatic ecg analysis,‖ IJCSI, vol. 46, pp. 1417–1425, 1998. [10]F. E. Ahmed, ―Artificial neural networks for diagnosis
and survival prediction in colon cancer,‖ Molecular Cancer, 2005.
[11]D. S. W. Miculan, ―Reflujo gastroesofágico en pediatría.‖ 3er curso anual de actualización en pediatría ambulatoria, 2005.
[12]D. y William H. Saunders, Tratado de otorrinolaringología, Interamericana, Ed. Interamericana, 2009.