United Kingdom Vol. VI, Issue 7, July 2018
Licensed under Creative Common Page 324
http://ijecm.co.uk/
ISSN 2348 0386
INFLUENCE OF WORK ENVIRONMENT, SUPERVISION, AND
AUDITOR TEAMWORK TO EMPLOYEE PERFORMANCE ON
REPRESENTATIVE OF FINANCE AND DEVELOPMENT
AUDITOR OF DKI JAKARTA, INDONESIA
Sarton Sinambela
Lecturer of Faculty of Economics, University of Mpu Tantular, Jakarta, Indonesia [email protected]
Abstract
This study aims to analyze the influence of work environment, supervision, and auditors
teamwork either individually or simultaneously to the Representative of Finance and
Development Auditor of DKI Jakarta. The sample of this study amounted to 101 employees. The
data collecting technique is using questionnaire with Likert scale 1-5. The hypothesis test
obtained a data that: (1) There is no significant influence of work environment (X1) on employee
performance (Y). Proved by the value of coefficient correlation is 0.670. The value of
significance is 0.121 and t value = 1.565, while t significant = 1.66. Because the sig value. >
0.05 and t value <t statistic so H0 is accepted and H1 is rejected . (2) There is a significant
influence of supervision (X2) on employee performance (Y). Proved by the value of coefficient
correlation is 0.765. The value of significance is 0.011 and t value = 3.482, while t statistic =
1.66. Because sig value <0.05 and t value> t statistic then H0 is rejected and H1 is accepted.
(3) There is significant influence of auditor teamwork (X3) on employee performance (Y).
Proved by the value of coefficient correlation is 0.755. Hypothesis testing obtained that the
value of significance is 0.001 and t value = 2.59, while t statistic = 1.66. Because sig value
<0.05 and t value> t statistic hence H0 is rejected and H1 is accepted. (4) There is a
simultaneous influence of work environment (X1), supervision (X2), and auditor teamwork (X3)
on employee performance (Y). Proved by the correlation coefficient value is 0.80. Significance
test indicated that sig value. 0.00 and F value = 57.359. While F statistic = 2.6984, so that the
sig value <0.05 and F value> F statistic or regression is significant.
Licensed under Creative Common Page 325
INTRODUCTION
To achieves its objectives, every organization is influenced by organizational behavior which is a reflection of the behavior and attitude of every employee who is a member of the organization. The behavior of employee will be reflected from employees attitude, whether the they are satisfied or not satisfied in the work that will effecting the work productivity.
Employee performance in Finance and Development Auditor of DKI Jakarta is certainly influenced by various factors so that management must give attention for organizational goals can be achieved optimally. Factors that affect these include: (1) the work environment; (2) Supervision; (3) conformity between the employee's personality and the type of work provided; (4) teamwork; and (5) employee training and development.
In order to improve employee performance, the management of Finance and Development Auditor of DKI Jakarta needs to follow several steps that can improve the performance of its employees. One of the best ways is to conduct a feedback program through an employee performance survey that assess the services provided by the organization to suSAsort controlling technical tasks. From the data obtained by the researchers from the performance accountability report, it aSAsears that employees are satisfied with the suSAsort services in the field of finance, staffing, and the provision of infrastructure.
Furthermore, keep in mind that working conditions are essential for employee performance that, illustrates how the workplace environment, the lighting of the room, the noise disturbance, the air temperature at work, and other office equipment. A good work environment will improve the performance of the organization. From the data obtained by the author, it suggests that management has paid a well attention to the workplace setting so it improve the employees ability in the work.
Licensed under Creative Common Page 326 enterprises, other agency in which has the Government interest, Regionally Owned Enterprises, in accordance with the prevailing laws and regulations; (7) audit investigation on an indication of irregularities that can harm the state finances, State-owned enterprises, other agency in which has the Government interest, audit of development barriers, and providing audit assistance to investigative agencies and other government agencies; and (8) Implementation of analysis and compilation of Supervision result and quality control.
Other than that, in Government Regulations Number 60 Of Year 2008 about Government Internal Control System (GICS) it is mentioned that BFDS is authorized as an internal supervisor of state financial accountability and guidance of GICS implementation. Representatives of Finance and Development Auditor of DKI Jakarta is a vertical agency working unit as the executive in the region, with DKI Jakarta as the working area which is under direct responsible to the Head of BPKP.
Based on monitoring data on the realization of the Work Program of Annual Monitoring and Development (WPAMD) in 2016 obtained by researchers, the target number of Supervision assignment (SA) in 2016 is 183 SAs and has been realized as many as 156 SAs. Thus, there are still 27 SAs or 14.75% that are not implemented during 2016. From the monthly Assignment Plan (AP) data, it can be seen that there are 2 SAs from target 25 SAs (8.00%) not implemented in AP in March 2016, 2 SAS or 16.67% AP in May 2016, 1 SAS from target 7 Sas (14.29%) not implemented in AP in June 2016, 3 SAs of the 12 Sas (25.00%) not implemented in AP in July 2016, 3 SAs from target 5 Sas (60.00%) not implemented in AP in September 2016, of 5 SAs from target 13 Sas (38.46%) not implemented in AP in October 2016, 4 SAs or 66.67% of target 6 SAs not implemented in November AP, and 7 SAs from target 65 Sas (10.77%) not implemented in AP in December 2016. This shows a lacking in conducive working environment.
In addition, from assignment data issued in 2016, from 392 assignments, there are still 68 assignments (17.35%) that have a late report completion, In addition, from the assignment data issued during the year 2016 of 392 assignments, there are still 68 assignments or 17.35% of late completion of the report, consisting of 39 assignments for WPAMD activities and 29 assignments for non-WPAMD activities. This shows a lacking in Supervision optimalization and a solid teamwork.
Problem Formulation
Based on the problem limitation as described above, then the problems in this research can be formulated, as follows:
Licensed under Creative Common Page 327 2. Analyzing the influence of Supervision on employee performance on the
Representative of Finance and Development Auditor of DKI Jakarta
3. Analyzing the influence of teamwork on employee performance on the Representative of Finance and Development Auditor of DKI Jakarta
4. Analyzing the influence of work environment, Supervision and teamwork simultaneously on employee performance on Representative of Finance and Development Auditor of DKI Jakarta
Objective of the Study
In accordance with the formulation of existing problems, then the goal to be achieved in this study is to:
1. To know how far the influence of work environment on the performance of Employees at the BFDS Representative in DKI Jakarta
2. To know how far the influence of Supervision on the performance of Employees at the BFDS Representative in DKI Jakarta
3. To know how far the influence of teamwork on the performance of Employees at the BFDS Representative in DKI Jakarta
4. To know how far the influence of work environment, Supervision and teamwork simultaneously on the performance of Employees at the BFDS Representative in DKI Jakarta
REVIEW OF RELATED LITERATURE
Definition of Performance
According to Mahmudi (2005:6) is a multidimensional constructs whose measurements vary depending on the complexity of the factors that establish the performance. Based on the opinion of Mahmudi, author defines it as a form outcomes of work, because the work provides a strong linkage to the organization's strategic goals, customer satisfaction, and economic contribution. The definition of performance by Moeheriono (2012: 96) is as follows:
Licensed under Creative Common Page 328 According to Keban (2004:191,192) Performance are defined as follows:
“Performance is an englich verb that refer to "appearance," or "achievement”. Performance only refers to a set of results obtained by an employee during a given period and does not include the personal characteristics of the employee that assessed."
According to Keban (2004:193) Achieving performance results can actually be judged by the subject, whether it is an individual (individual performance), group (group performance), institution (organization performance), and by a program or policy (program or policy performance). According to Mahsun (2006:25) definition of performance is as follows:
“Performance is implementation level of achievement of an activity / program / policy in actualizing of targets, goals, visions and missions contained in an organization‟s strategic planning. Performance terms are often used to refer to achievements or success levels that have been established. This criteria of success is in form of goals or targets that are going to be achieved. Without any purpose or target, the performance of a person or organization is unlikely to be known because there is no benchmark.”
From some experts above it can concluded that the performance is the work of someone who is able to carry out the tasks assigned effort, skills, experience and ability both in managing the time and carrying out the task itself with the responsibility to achieve certain goals.
Factors Affecting Performance
According to Mahmudi (2005: 21) there are 5 factors that affect performance assessment: a. Personal / individual factors, including: knowledge, skill, ability, self confidence,
motivation, and commitment possessed by each individual.
b. Leadership factor : quality in giving encouragement, spirit, direction, and support provided by the manager and team leader
c. Team factor, including: the quality of support and passion provided by a teammate, trust in team members, the solidarity of team members.
d. System factor, including: work system, work facility, or infrastructure provided by the organization, and the performance culture within the organization.
e. Contextual factor, including: pressure and changes of external and internal environment.
Performance Indicator
Licensed under Creative Common Page 329 indicators of skills, experience, and sincerity, (3) efficiency with indicators: materials, tools, methods, and time.
Work Environment
Work environment in an organization is important for employees because the work environment can affect the employees who are in it. A conducive work environment will provide a sense of security and comfort and allow employees to work optimally. If the employee loves his work environment, then the employee will feel at home in the workplace so that work activities become more effective.
According to Sedarmayanti (2011, page.20), „work environment is all tools and materials faced by someone‟s work environment, his method of work, and the arrangement of his work either as an individual or as a group'. A good work environment will reduce a saturation in working. Those comfort of course will have an impact on increased productivity. Thus, the work environment can be defined as a psychological condition that exists within an organizational environment and is considered to have an influence on the behavior of its members.
Work environment Type
Broadly speaking, the work environment is divided into two types, namely (Sedarmayanti 2011, page.26):
a. Physical work environment
The physical work environment in the sense that all circumstances that exist around the workplace can affect employees, either directly or indirectly. The physical work environment is divided into two categories: (1) work environment that directly relates to employees (such as: work centers, chair, table, and so on), and (2) intermediate environment, that also be called a work environment that affects the human condition, for example: temperature, humidity, air circulation, lighting, noise level, mechanical vibration, bad smell, color and so on.
b. Non-physical work environment
Non-physical work environment is all circumstances relating to employment relationships, either with the superiors or relationships with colleagues, or with subordinates.
Factors Effecting Work environment
Factors that influence physical work environment according to Frasser on Hardino Febriansyah (2012), is:
Licensed under Creative Common Page 330 c. Lighting
d. Noise level e. Colour f. Cleanliness g. Workspace Layout
Work environment can be measured through: (1) dimensions of work facilities, with indicators of equipment / facilities arrangement; and (2) dimensions of work infrastructure, with indicators: (a) lighting, (b) temperature, (c) workspace layout.
Definition of Supervision
Supervision is an activity carried out in the form of supervising, controlling and evaluating (Indonesian Dictionary, 2014). According to Gillies (2010), Supervision is one of the principles of leadership. Supervision is done to see the work in progress and fix it in case of bad implementation. According to RCN (2011), Supervision is the process of ensuring the activities are carried out in line with the objectives of the organization, by monitoring the implementation of activities.
Fayol dalam Swanburg (2010), express that Supervision is an examination of whether things happen in accordance with agreed plans, instructions issued, and the determined principles that aim to show deficiencies and errors in order to be corrected and not happen again.
Based on some of the above opinion it can be concluded that Supervision is a supervisory and controlling activity performed by a supervisor to the work performed by subordinates to ensure that the implementation of the work has been optimal and in accordance with standard procedures. Supervision process is a learning and training activity that aims to increase knowledge and skills and provide support to subordinates to improve their competence. Supervision can be measured through: (1) dimensions of policy, with indicators organizational policy; (2) dimension of assignment.
Teamwork
Cooperation is „a complex of willingness and ability to fulfill agreements related to good value and discipline, tolerance to others, be more concerned with the interests of the partner than the self-interest at some point, and the willingness and ability to accept the lack of others‟ (Aris Munandar 2014,page 86).
Licensed under Creative Common Page 331 R. Wayne Pace & Don F. Faules (2013, page.310), mentioned that the groups created as a result of their work are called "teamwork". They also mention that members are a team because the work requires them to work together, where the work team is charged with the responsibility for self-regulation, improve the skills of team members, and refine the processes, products, and/ or services provided by the team. If the work team's functionality really stands alone, then this team is named autonomous team or a self-managed team.
Accoerding to R. Wayne Pace & Don F. Faules (2013, page.315), mentioning the fact that a group or team that voluntarily constructed, by assignment, or by rearrangement of its own work, is not a guarantee that the team members personally will function effectively as a group or team, where this group or team must develop into a positively functioning unit. This is achieved by moving through a number of developmental stages, namely: (1) formation stage; (2) interference stage; (3) normation stage; and (4) implementation stage.
Teamwork can be measured through: (1) job design dimensions, with indicators of member opportunities to use skills and talents; (2) composition dimensions, with indicators: (a) the ability of members, (b) member personalities, and (c) the diversity of members; (3) context dimension, with indicators: (a) resource support, and (b) member support, and (4) synergy dimensions , with indicators: (a) member commitment, and (b) level of member conflicts.
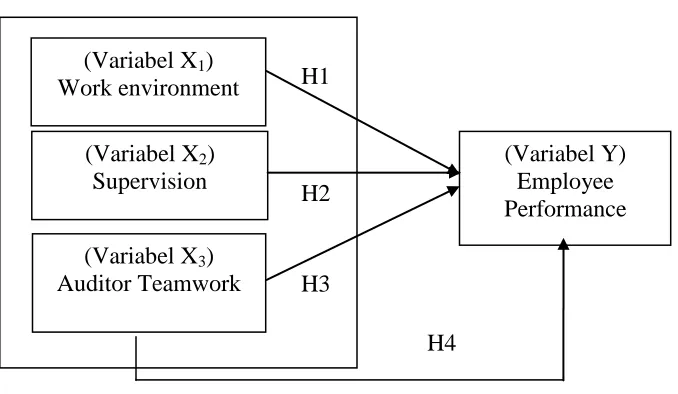
Figure 1. Research Framework
Description of the research framework:
X1 = independent variable1 (Work Environment) X2 = independent variable2 (Supervision) X3 = independent variable3 (Auditor Teamwork) Y = dependent variable(Employee Performance)
(Variabel X
1)
Work environment
(Variabel X
2)
Supervision
(Variabel X
3)
Auditor Teamwork
(Variabel Y)
Employee
Performance
H3
H2
Licensed under Creative Common Page 332
Hypothesis
Based on the theories and phenomena that have been described above, research hypothesis can be formulated, as follows:
Hypothesis 1- Allegedly there is a positive and significant influence work environment on Employee performance in Board of Finance and Development Auditor of DKI Jakarta.
Hypothesis 2- Allegedly there is a positive and significant influence of supervision on Employee performance on Board of Finance and Development Auditor of DKI Jakarta.
Hypothesis 3- Allegedly there is a positive and significant influence of Auditor teamwork on Employee performance on Board of Perwakilan Finance and Development Auditor of DKI Jakarta.
Hypothesis 4- Allegedly there is a positive and significant influence of work environment, Supervision and Auditor teamwork simultaneously on Employee performance on Board of Finance and Development Auditor of DKI Jakarta.
RESEARCH METHODOLOGY
Research Design
This type of study is quantitative research that processed the numerical data by statistical methods. The specification of this research is descriptive that is to discuss facts, circumstances, variables, and phenomena that occur now.
This study will be analyze the influence of one variable to other variables. The variables to be studied consist of four variables, namely: (1) work environment; (2) supervision; (3) auditor teamwork; and (4) employee performance. Of the four variables, employee performance is serve as dependent variable, as the three other variables, namely: work environment, Supervision, and teamwork serve as independent variable.
Research Population
Population in this research is all functional auditor officer of at Representative of Finance and Development Auditor of DKI Jakarta Finance and Development Auditor of DKI Jakarta totaling 101 people and all of them used as research samples, consisting of 27 Senior Auditor, 36 Junior Auditors, First Auditor is 4 people, Auditor Supervisor is 32 people, and Advanced Implementing Auditor is 2 people as objects to be studied.
Research Sample
Licensed under Creative Common Page 333 reason that the results of research is more representative and objective. The population distribution and sample in this study are presented in Table 1.
Table 1. Sample Respondents
No. Auditor Numbers
1 Senior Auditor 27
2 Junior Auditor 36
3 First Auditor 4
4 Auditor Supervisor 32
5 Advanced Implementing Auditor 2
Total 101
Source: Employment Data (May 2017)
Operationalization of Variables
Performance is scores that measure values of employee performance from dimensioning results, as follows:
1) Quality of work Dimensions, with indicators of work completion, support facilities and infrastructure minimization, and achievement of good work.
2) Dimension of work quantity, with suitability of job completion indicators with the number of targets, timeliness, the increasing number of work, and the well job completion.
3) Dimension of responsibility, with the suitability of job completion with instructions, SOP, SPM, discipline, initiative, and creative.
4) Dimensions of teamwork, with indicators of teamwork with superiors and subordinates, and coordination with colleagues.
RESULTS AND DISCUSSION
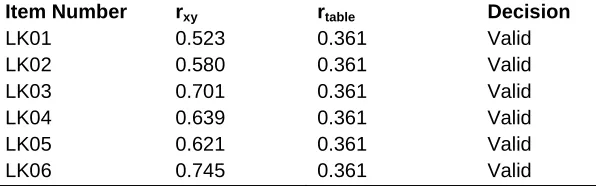
Validity and Reliability Test on Work Environment (X1)
The work environment variable is measured through 14 questions. Using SPSS 23, the validity and reliability tests are conducted.
Table 2. Instruments Validity Test Result Work Environment Variable (X1)
Item Number rxy rtable Decision
LK01 0.523 0.361 Valid
LK02 0.580 0.361 Valid
LK03 0.701 0.361 Valid
LK04 0.639 0.361 Valid
LK05 0.621 0.361 Valid
Licensed under Creative Common Page 334
LK07 0.657 0.361 Valid
LK08 0.683 0.361 Valid
LK09 0.640 0.361 Valid
LK10 0.569 0.361 Valid
LK11 0.635 0.361 Valid
LK12 0.720 0.361 Valid
LK13 0.654 0.361 Valid
LK14 0.626 0.361 Valid
Source: SPSS 23 Data Processing Results
From result of validity test of work environment (X1) it is known that from 14 item question, all question is valid. Therefore, the question about work environment (X1) that distributed to the fixed respondent is 14 points. Results The table above proves that all corrected item-total correlation values for each work environment variable (X1) are above 0.361 so that all questions are valid.
Table 3. Reliability Test Result of Work Environment (X1)
Cronbach's Alpha N of Items Cronbach Table
Decision
.916 14 0,7 Reliable
Source: SPSS 23 Data Processing Results
Based on the results of validity and reliability test above it can be concluded that the work environment (X1) is valid because rxy value is greater than rTable and the data is also reliable and the data is also reliable because the value of Cronbach's alpha 0.916 is greater than 0.70.
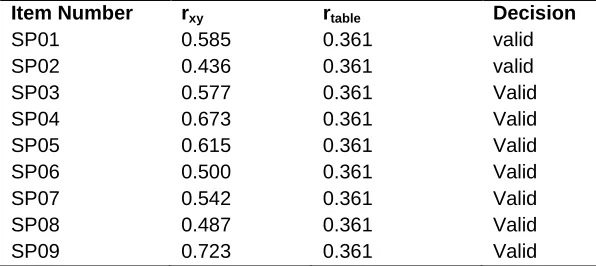
Validity and Reliability Test on Supervision (X2)
Supervision is measured through 14 questions. Using SPSS 23, the validity and reliability test result is:
Table 4. Instruments Validity Test Result Supervision Variable (X2)
Item Number rxy rtable Decision
SP01 0.585 0.361 valid
SP02 0.436 0.361 valid
SP03 0.577 0.361 Valid
SP04 0.673 0.361 Valid
SP05 0.615 0.361 Valid
SP06 0.500 0.361 Valid
SP07 0.542 0.361 Valid
SP08 0.487 0.361 Valid
SP09 0.723 0.361 Valid
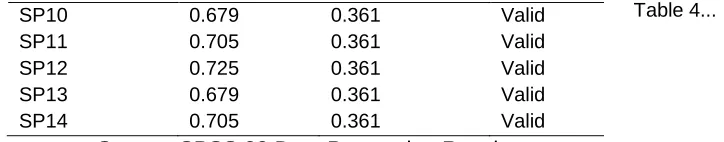
Licensed under Creative Common Page 335
SP10 0.679 0.361 Valid
SP11 0.705 0.361 Valid
SP12 0.725 0.361 Valid
SP13 0.679 0.361 Valid
SP14 0.705 0.361 Valid
Source: SPSS 23 Data Processing Results
From result of validity test of Supervision (X2) it is known that from 14 item question, all question is valid. Therefore, the question about Supervision (X2) that distributed to the fixed respondent is 14 points. Results The table above proves that all corrected item-total correlation values for each Supervision variable (X2) are above 0.361 so that all questions are valid.
Table 5. Reliability Test Result of Supervision (X2)
Cronbach's Alpha
N of Items Cronbach Table
Decision
0.907 14 0,7 Reliable
Source: SPSS 23 Data Processing Results
Based on the results of validity and reliability test above it can be concluded that the Supervision (X2) is valid because rxy value is greater than rTable and the data is also reliable and the data is also reliable because the value of Cronbach‟s alpha 0.907 greater than 0.70.
Validity and Reliability Test on Teamwork (X3)
Supervision is measured through 14 questions.
Table 6. Instruments Validity Test Result Auditor Teamwork Variable (X3)
Item Number rxy rtable Decision
KT01 0.461 0.361 Valid
KT02 0.576 0.361 Valid
KT03 0.472 0.361 Valid
KT04 0.598 0.361 Valid
KT05 0.576 0.361 Valid
KT06 0.568 0.361 Valid
KT07 0.790 0.361 Valid
KT08 0.720 0.361 Valid
KT09 0.790 0.361 Valid
KT10 0.720 0.361 Valid
KT11 0.790 0.361 Valid
KT12 0.720 0.361 Valid
KT13 0.790 0.361 Valid
KT14 0.720 0.361 Valid
Source: SPSS 23 Data Processing Results
Licensed under Creative Common Page 336 From result of validity test of Auditor Teamwork (X3) it is known that from 14 item question, all question is valid. Therefore, the question about Auditor Teamwork (X3) that distributed to the fixed respondent is 14 points. Results The table above proves that all corrected item-total correlation values for each Auditor Teamwork Variable (X3) are above 0.361 so that all questions are valid.
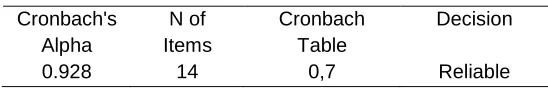
Table 7. Reliability Test Result of Auditor Teamwork Variable (X3) Cronbach's
Alpha
N of Items
Cronbach Table
Decision
0.928 14 0,7 Reliable
Source: SPSS 23 Data Processing Results
Based on the results of validity and reliability test above it can be concluded that the Auditor Teamwork (X3) is valid because rxy value is greater than rTable and the data is also reliable and the data is also reliable because the value of Cronbach‟s alpha 0.928 greater than 0.70.
Validity and Reliability Test on Employee Performance (Y)
Supervision is measured through 14 questions. Using SPSS 23, the validity and reliability test result is:
Table 8. Instruments Validity Test Result Employee Performance (Y)
Item Number rxy rtable Decision
KP01 0.779 0.361 Valid
KP02 0.874 0.361 Valid
KP03 0.641 0.361 Valid
KP04 0.766 0.361 Valid
KP05 0.788 0.361 Valid
KP06 0.815 0.361 Valid
KP07 0.733 0.361 Valid
KP08 0.697 0.361 Valid
KP09 0.553 0.361 Valid
KP10 0.874 0.361 Valid
KP11 0.650 0.361 Valid
KP12 0.779 0.361 Valid
KP13 0.874 0.361 Valid
KP14 0.815 0.361 Valid
Source: SPSS 23 Data Processing Results
Licensed under Creative Common Page 337 the fixed respondent is 14 points. Results The table above proves that all corrected item-total correlation values for each Employee Performance Variable (Y) are above 0.361 so that all questions are valid.
Table 9. Reliability Test Result of Employee Performance (Y) Cronbach's
Alpha
N of Items
Cronbach Table
Decision
0.955 14 0,7 Reliable
Source: SPSS 23 Data Processing Results
Based on the results of validity and reliability test above it can be concluded that the Performance Variable (Y) is valid because rxy value is greater than rTable and data is also reliable and the data is also reliable because the value of Cronbach‟s alpha 0.955 greater than 0.70.
The Classical Assumption Test
The classical assumption test that will be used in this research includes normality test, heteroscedasticity test and multicolinearity test. Classical assumption test is done to determine the condition of existing data in order to determine the most appropriate analysis model used. To obtain an unbiased and efficient regression model.
Normality Data Test
Normality test in this study was conducted with the help of SPSS 23 to test whether the residual variable regression model has a normal distribution. For normality test can see graph P-P histogram plot that compare observation data with distribution which close to normal distribution, this study conducts a normality test on the model of regression equation formed.
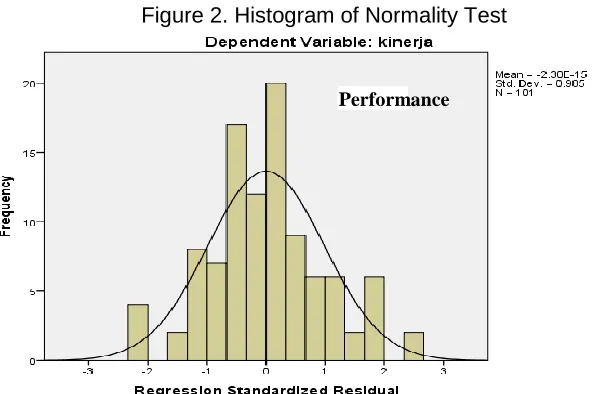
Figure 2. Histogram of Normality Test
Licensed under Creative Common Page 338 Figure 3. Normal P-Plot Graph
Source: SPSS 23 Data Processing Results
In the above picture we can see the residual value of the data is around the line y = x (line 45%) that the histogram gives the normal distribution pattern, because of the data spreading around the diagonal line and following the direction of the diagonal line, it can be concluded that the regression model qualify the assumption of normality.
Researchers also conducted Kolmogorov Smirnov Test (KS) to strengthen the results of the study by testing the normality of residual data. With hypothesis as follows:
𝐻0 : 𝜀𝑖~𝑁 (0; 𝜎2) or
ε
i is normally distributed𝐻1 : 𝜀𝑖 ≁ 𝑁 (0; 𝜎2) or 𝜀𝑖 is not normally distributed
Decision making criteria : Total Ho P-value ≤ 𝛼
By using SPSS 23 data processing to test the dependent variable, the result is as show in the table 10.
Licensed under Creative Common Page 339 Table 10. Kolmogorov-Smirnov Normality Test
One-Sample Kolmogorov-Smirnov Test
Unstandardized Residual
N 101
Normal Parametersa,b Mean .0000000 Std.
Deviation
3.98316839
Most Extreme Differences Absolute .075 Positive .075 Negative -.044
Test Statistic .075
Asymp. Sig. (2-tailed) .184c
a. Test distribution is Normal. b. Calculated from data.
Source: SPSS 23 Data Processing Results
In the table above the value of Z statistic test obtained is 0.075 < z Table (1,96) and its significance value is 0.184 indicating that the significance value is more than alpha (5% or 0.05), so it can be said that the data has been distributed normally because above alpha 0.05 or 5%.
Correlation Analysis
Correlation Analysis of Work Environment (X1) on Employee Performance (Y)
Correlation analysis is conducted to determine whether the work environment variable has relationship with employee performance. Calculation through SPSS 23 with results are listed in the Table below:
Table 11. Correlation Test Result between Work Environment Variable (X1) and Employee Performance (Y)
Correlations
Work environment
Employee Performance Work
environment
Pearson Correlation 1 .670**
Sig. (2-tailed) .000
N 101 101
Employee Performance
Pearson Correlation .670** 1 Sig. (2-tailed) .000
N 101 101
**. Correlation is significant at the 0.01 level (2-tailed).
Licensed under Creative Common Page 340 Based on the table above, the magnitude of correlation coefficient between work environment with employee performance is 0.670. This shows a positive relationship between variables with moderate strength and sig. value of 0.000 <0.05 which means the relationship between variables is significant. Thus, the conclusion is correlation between work environment and employee performance is significant positive moderate relationships.
Correlation Analysis of Supervision (X2) on Employee Performance (Y)
Correlation analysis is conducted to determine whether the Supervision variable has relationship with employee performance. Calculation through SPSS 23 with results are listed in the Table below:
Table 12. Correlation Test Result between Supervision Variable (X2) and Employee Performance (Y)
Correlations
Employee Performance
Supervision
Employee Performance
Pearson Correlation 1 .765**
Sig. (2-tailed) .000
N 101 101
Supervision Pearson Correlation .765** 1 Sig. (2-tailed) .000
N 101 101
**. Correlation is significant at the 0.01 level (2-tailed).
Source: SPSS 23 Data Processing Results
Based on the table above, the magnitude of correlation coefficient between work environment with employee performance is 0.765. This shows a positive relationship between variables with strong correlation and sig. value of 0.000 <0.05 which means the relationship between variables is significant. Thus, the conclusion of the correlation between Supervision and performance is a strong positive relationship.
Correlation Analysis of Teamwork (X3) on Employee Performance (Y)
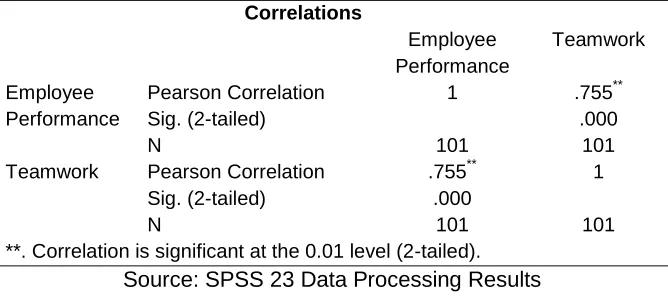
Licensed under Creative Common Page 341 Table 13. Correlation Test Result between Teamwork Variable (X2) and Employee Performance (Y)
Correlations
Employee Performance
Teamwork
Employee Performance
Pearson Correlation 1 .755**
Sig. (2-tailed) .000
N 101 101
Teamwork Pearson Correlation .755** 1 Sig. (2-tailed) .000
N 101 101
**. Correlation is significant at the 0.01 level (2-tailed). Source: SPSS 23 Data Processing Results
Based on the table above, the magnitude of correlation coefficient between work environment with employee performance is 0.755. This shows a positive relationship between variables with strong correlation and sig. value of 0.000 <0.05 which means the relationship between variables is significant. Thus, the conclusion of the correlation between Supervision and performance is a strong positive relationship.
Multiple Linear Regression Analysis
Multiple Linear Regression Analysis used to analyze the relationship between work environment variables, Supervision, and teamwork on employee performance. The model specifications used in this research are as: (i) Y = β0+β1X1+β2X2+β3X3+e
Where,
Y = Employee performance X1 = Work environment X2 = Supervision X3 = Teamwork β0 = Constants
β1 = Regression coefficient of Work environment β2 = Regression coefficient of Supervision β3 = Regression coefficient of Teamwork
e = error
Coefficient of Determination
Licensed under Creative Common Page 342 Table 14. Model Summary
Model R R Square Adjusted R Square
1 .800a .640 .628
a. Predictors: (Constant), Teamwork Auditor, Work environment, Supervision b. Dependent Variable: Employee Performance
The correlation value (r) shows the how tight relationship between the independent variable and the dependent variable. In the Table above the correlation value (r) is 0.800 means there is a strong correlation between the independent variables (work environment, Supervision and teamwork) with the dependent variable (employee performance). While the number of R Square Adjusted is called Coefficient of Determination. The number of Coefficient Determination is 0.628. This means that the independent variables (work environment, Supervision and teamwork) can explain the variation of the dependent variable (employee performance) of 62.8%. While the rest is caused by other causes factors. This suggests that the established model is good enough because the three variables able to explain the variation of dependent variable over 50 percent.
ANOVA Test (F test)
ANOVA Test is conducted to find out whether the independent variables simultaneously affect or not to the dependent variable. To determine the value of F value, the distribution table is searched at α = 5% if sig F statistic ≤ α = 0.05 then H0 is rejected and H1 is accepted, for a model with degree of freedom (df1) = k=3 and (df2)= n-k-1 = 101-3-1 = 97. By testing one side obtained value of F value = 2.6984 while the F statistic can be seen in Table below:
Table 15. Result of Anovaa Test
ANOVAa
Model Sum of
Squares
Df Mean Square
F Sig.
1 Regression 2814.526 3 938.175 57.359 .000b Residual 1586.563 97 16.356
Total 4401.089 100 a. Dependent Variable: Employee Performance
b. Predictors: (Constant), Work environment, Supervision, Teamwork Source: SPSS 23 Data Processing Results
From the result of F value and F statistic then the comparison can be seen as follows: If F statistic > F value, then H0 is rejected and H1 is accepted
Licensed under Creative Common Page 343 While the significance of the influence between variables can be seen on the following criteria: If sig < 0.05 then there is a significant influence
If sig > 0.05 then there is no significant influence
Hypothesis
H0 : β0=β1=β2=β3 =0
(No one variable has an influence / model does not fit) H1 : Minimal ada satu βj≠0
(At least one influential variable, model fit)
Decision Making Criteria: Reject H0 if F statistic > F value or if P-value ≤ α. From the table above obtained the value of F statistic is 57.359, while F value is 2.6984 this means F statistic> F value, so H0 is rejected and H1 is accepted. Thus it can be said that there is a linear relationship of independent variables simultaneously (work environment, Supervision and teamwork) to dependent variables (Performance), in other words the two models that have been formed fit / fit with the value of sig 0.000 <0.05.
T Test
T test is conducted to find out whether the independent variable partially affect the dependent variable. To determine the value of t value, the distribution table is searched at α = 5% if the sig t value ≤ α = 0.05 then H0 is rejected and H1 accepted, (2-tailed) with degrees of freedom (df) = n-k-1 = 101-3-1 = 97 . The 2-tailed testing obtained t statistic= 1.66071, while the value of t value can be seen in Table below:
Table 16. Coefficients t test (Partial)
Coefficientsa
Model Unstandardized
Coefficients
Standardized Coefficients
T Sig. Decision
B Std. Error
Beta
1 (Constant) 2.708 4.851 .558 .578
Work environment .152 .097 .150 1.565 .121 Not sig. Supervision .495 .142 .397 3.482 .001 Positively sig. Teamwork .314 .121 .312 2.593 .011 Positively sig. a. Dependent Variable: Employee Performance
Licensed under Creative Common Page 344 If t value > t statistic, then H0 is rejected and H1 accepted
If t value < t statistic, then H0 is accepted and H1 rejected
While to see the influence of significance between variables can be seen in the following criteria:
If sig. <0.05 then there is a significant influence If sig. >0.05 then there is no significant influence Y = β0 + β1X1 + β2X2 + β3X3 + e
Employee performance = 2.708 + 0.152 work environment + 0.495 Supervision + 0.314 teamwork
From the equation above, it can be concluded that:
a. The constant of 2,708 states that if there is no increase in the value of work environment, Supervision and cooperation variables then the performance worth is 2,708 .
b. Regression coefficient of work environment variable is 0.152 stated that every addition of one work environment value will improve performance as much as 0.152 with assumption other variable constant.
c. Regression coefficient of Supervision variable is 0.495 stated that every addition of one Supervision value will improve performance as much as 0.495 with assumption other variable constant.
d. Regression coefficient of teamwork variable is 0.314 stated that every addition of one teamwork value will improve performance as much as 0.314 with assumption other variable constant.
Discussion on the Result of Hypothesis Test
Hypothesis test 1: Work Environment Has a Positive Significant Influence On Employee
Performance
Table 17. Coefficients Uji t Model Unstandardized
Coefficients
Standardized Coefficients
T Sig. Decision
B Std. Error Beta
1 (Constant) 2.708 4.851 .558 .578 Work
environment
.152 .097 .150 1.565 .121 Not sig.
Licensed under Creative Common Page 345 This is in line with the research conducted by Sutrisno (2013, p.118) states that the work environment is the all facilities and work infrastructure around employees who are doing work that can affect the implementation of work. A good and clean working environment, sufficient light, free from noise and disturbance will provide motivation and sense of comfort for employees in doing the job, but a poor work environment, dirty, dark, stuffy, humid, and so forth will lead to fatigue and lower creativity.
Similar to Hera Wasiati's research (2016, p. 190), this study aims to find out whether the leadership, Work environment, has an influence on Employee Performance in STMIK AKAKOM Yogyakarta with job satisfaction as intervening variable. The data used in the form of primary data obtained through questionnaire. Respondents are non-educative employees at STMIK AKAKOM Yogyakarta with a sample of 58 respondents. The data analysis methods is using descriptive analysis and inferential analysis. Hypothesis testing using t-statistical test and R-Square. The result is leadership have positive and significant influence to job satisfaction, Work environment have positive and significant influence on job satisfaction, leadership and Work environment have a negative and non-significant influence on performance, job satisfaction has a positive and significant influence on Employee Performance.
Supervision Has a Positive Significant Influence On Employee Performance Hypothesis Test 2:
H0 : Supervision has no influence on employee performance
H1 : Supervision has a positive influence on employee performance
The significant is 0.001 < 0.05 so H0 rejected or H1 accepted means Supervision affect performance. This is because the value of t value= 3.482> t statistic = 1.66. It means there is a proportional relationship where if an increase in Supervision will improve performance.
This is in line to the research conducted by Rosalina and Rustiana (2010) states that Supervision is 'action to supervise or direct the completion of work'. Supervision can provide feedback or inputs for employees to make improvements.
Rapina and Hana (2011) revealed that Supervision is' an activity that coordinates the implementation of tasks through effective and efficient 'direct and feedback'.
Licensed under Creative Common Page 346 So in line with research hypothesis, Supervision certainly has a positive influence on the Employee Performance.
Teamwork Has a Positive Significant Influence On Employee Performance
Hypothesis Test 3:
H0 : Teamwork has no influence on employee performance
H1 : Teamwork has a positive influence on employee performance
Significance value 0.011 < 0.05 so H0 rejected or H1 accepted means Supervision affect performance. This is because the value of t value=2,593 > t statistic=1,66. It means there is a proportional relationship where if an increase in teamwork will improve performance.
This is in line with the research conducted by R. Wayne Pace & Don F. Faules (2013, page.310), states that a groups created as a Result of the work itself are called "teamwork". A teamwork is a group of workers responsible for forming a product or dealing with a process within an organization. Teamwork plans the work, completes it, and organizes a number of regular tasks such as scheduling, goal setting, provide a performance feedback, and even hiring new team members and dismissing those who do not contribute enough to the team's work. The team is responsible for production, cost quality, statistical control, and coordination with other teams and departments.
Furthermore mentioned by R. Wayne Pace & Don F. Faules (2013, page.310) that members are a team because the work requires them to work together, where the work team is responsible for self-regulation, enhancing team members' skills, and refining the processes, products, and / or services provided by the team. If the work team's functionality really stands, then this team is named “autonomous team” atau “self-managed team”.
Meanwhile, according to David Rees & Richard McBain (2007, p.124), teams have a same goals and work approaches, where members are interdependent, responsible, and involved in opportunities to build relationships to improve their performance. Building relationships is a building block of a team. So in line with research hypothesis, Teamwork certainly has a positive influence on the Employee Performance.
Work environment, Supervision, Teamwork has a Positive Significant Influence On Employee Performance
Hypothesis Test 4:
Licensed under Creative Common Page 347 H1 : Work environment, Supervision and Teamwork has an influence on employee performance
Significance 0.00 < 0.05 so H0 rejected or H1 accepted means Work environment, Supervision, and Teamwork affects Employee Performance. It means there is a proportional relationship where if an increase in Work environment, Supervision, teamwork simultaneously will increase employee performance.
Employee Performance is the level of achievement or work of a person or teamwork of the targets to be performed or to be done in a certain time, which can be measured through 4 dimensions, namely: quality of work, the amount of work, responsibility, and cooperation
Work environment is everything in the form of facilities and infrastructure both physical and non-physical that is around employees which can affect the execution of the task/ job and increase productivity. Can be measured through 2 dimensions, namely: facilities, and infrastructure.
Supervision is an activity of control or Supervision that conducted regularly on the work implementation of subordinate through guidance, direction, observation and evaluation that effective and efficient so that the work process in accordance with the desired results, can be measured through 4 dimensions, namely: policy, assignment, improvement of competence, and the response of superiors and subordinates.
Teamwork is a work team that has a skill mix that in accordance with a tasks that must be completed and has collective responsibility for work processes within the organization start from planning, completing and reporting the results of the work in which each of its members is involved in a number of opportunities to build relationships and improve their performance, can be measured through 4 dimensions, namely: job design, composition, context, and synergy.
So research Hypothesis on Work environment, Supervision, and Teamwork auditor positive influence on Employee Performance is proven.
CONCLUSION
Based on the Result of data analysis which has been described in the previous chapter, it can be concluded as follows:
Licensed under Creative Common Page 348 of significance = 0.121 and t value=1.565, while t statistic=1,66. Because sig. value > 0.05 and t value < t statistic so H0 is accepted and H1 is rejected.
b. There is a significant influence of Supervision (X2) on Employee Performance (Y) on the Representative of Finance and Development Auditor of DKI Jakarta . It is proved by the value of correlation coefficient between Supervision (X2) on Employee Performance (Y) is 0.765. From Hypothesis testing it was found that the value of significance= 0.001 and t value =3.482, while t statistic=1,66. Because sig. value < 0.05 and t value > t statistic so H0 is rejected and H1 is accepted.
c. There is a significant influence of auditor Teamwork (X3) on Employee Performance (Y) on the Representative of Finance and Development Auditor of DKI Jakarta . It is proved by the value of correlation coefficient between Supervision (X2) on Employee Performance (Y) is 0.755. From Hypothesis testing it was found that the value of significance= 0.001 and t value =2,59, while t statistic=1,66. Because sig. value < 0.05 and t value > t statistic so H0 is rejected and H1 is accepted.
d. There is a significant influence of auditor Work environment (X1), Supervision (X2), and Teamwork (X3) simultaneously on Employee Performance (Y) on the Representative of Finance and Development Auditor of DKI Jakarta . It is proved by the value of correlation coefficient between Supervision (X2) on Employee Performance (Y) is 0.80. Significant coefficients in significance tests are showed by the sig value. 0.00 and F statistic = 57.359, while F value = 2.6984. So that the sig value <0.05 and F hitug> F value or it can be said that the regression is significant
SUGGESTION
Based on the Result of the above research, then to increase Employee Performance on Representative of Finance and Development Auditor of DKI Jakarta , the researcher give some suggestion as follows:
a. The biggest factor affecting Employee Performance is Supervision, in this case it is better to apply Supervision system which increases with increasing workload. This can be applied to the Functional Auditor Officer on the Representative of the Board of Finance and Development Auditor of DKI Jakarta, where the higher achievement target will also increase Employee Performance, thus giving a positive value for each employee to achieve better Employee Performance.
Licensed under Creative Common Page 349 and transcendental values, so it is very important to build a shared vision and mission in the team.
c. The smallest factor affecting Employee Performance is Work environment. In this variable the employees provide the lowest rating regarding work environment in Representative of Finance and Development Auditor of DKI Jakarta , for it is expected to improve and maintain conditions of Work environment and individual characteristics of its employees so that Employee Performance can continue to increase, in this case the equipment of the available office needs to be equipped for the smooth work execution of the employee. Can be done by renewing the old computer, buying data processing equipment such as computers, notebooks, printers, scanners, and others that can support the work.
d. To increase Employee Performance in Representative of Finance and Development Auditor of DKI Jakarta a conducive Work environment is needed, Supervision, and Teamwork is good for creating a performance that oriented on the result or process.
REFERENCES
Arikunto. (2008). Penelitian tindakan kelas. Jakarta: Bumi Aksara
Ashari, Purbayu Budi Santoso. 2005. Analisis statistic dengan Microsoft exel and SPSS. Yogyakarta. Bangun, W 2012, Manajemen sumber daya manusia, Erlangga, Jakarta.
Colquitt, JA, LePine, JA, Wesson, JW 2012, Organizational behavior, McGraw-Hill, New York. Darmawan, D 2013, Prinsip-prinsip perilaku organisasi, Pena Semesta, Surabaya.
Gaspersz, V 2013, All-in-one, integrated total quality talent management; 50 concepts, models and key analyses in total quality, practical human capital, and talent management system, Tri-Al-Bros Publishing, Bogor.
Ghozali, Imam, 2011, Aplikasi analisis multivariate dengan program IBM, SPSS 19, Edisi Kelima, Universitas Diponegoro, Semarang.
Gujarati, Damodar. 2006. Dasar-dasar Ekonometrika. Jakarta : Erlangga
Istijanto 2008, Riset sumber daya manusia;cara mendeteksi dimensi-dimensi kerja karyawan, Gramedia Pustaka Utama, Jakarta.
Kadarisman, M 2014, Manajemen pengembangan sumber daya manusia, Ed.1, Rajawali Pers, Jakarta.
Kaswan 2013, Leadership and teamworking-membangun tim yang efektif and berperformance tinggi melalui kepemimpinan, Alfabeta, Bandung.
Kreitner, R & Kinicki, A 2014, Perilaku organisasi-organizational behavior, Ed.9, Salemba Empat, Jakarta. Mahmudi, (2005). Manajemen Performance Sektor Publik. Yogyakarta : USAS AMP YKPN.
Mahsun, Mohammad. 2006. Pengukuran Performance Sektor Publik. Yogyakarta: Gava Media.
Malayu Hasibuan. 2004. Manajemen Sumber Daya Manusia. Cetakan ke Tujuh, edisi revisi, PT. Bumi Aksara. Jakarta.
Mangkunegara, AP 2010, Perilaku and budaya organisasi, Refika Aditama, Bandung.
Moeheriono. 2012. “Pengukuran Performance Berbasis Kompetensi”. Jakarta: Raja Grafindo Persada.
Licensed under Creative Common Page 350 Muhammad, Firdaus. 2004. Ekonometrika suatu Pendekatan Aplikatif. Jakarta: Bumi Aksara.
Munandar, A 2014, Perilaku organisasi; pendekatan teori and aplikasinya, Mandala Nasional Publishing, Jakarta. Pace, RW & Faules, DF 2013, Komunikasi organisasi-strategi meningkatkan performance perusahaan, Remaja Rosdakarya, Bandung.
Parker, GM 2008, Team players and teamwork; new strategies for developing successful collaboration, John Willey and Sons.Inc., San Fancisco.
Pasalong, Herbani.2013.Kepemimpinan Birokrasi. Bandung : CV.Alfabeta.
Ratminto & Atik S.W. (2005) Manajemen Pelayanan: Pengembangan Model Konseptual, Penerapan Citizen‟s Charter and Standar Pelayanan Minimal. Yogyakarta: Pustaka Pelajar.
Rees, D & McBain, R 2007, People management: teori and strategi (tantangan & peluang), Ed.2, Kencana Prenada Media Group, Jakarta.
Rivai, V 2013, Manajemen sumber daya manusia untuk perusahaan; dari teori ke praktik, Ed.2, Rajawali Pers, Jakarta.
Santoso P.B and Ashari, 2005, Analisis statistik dengan microsoft excel and SPSS, Andi, Yogyakarta.
Sedarmayanti, 2011, Tata Kerja and Produktivitas Kerja: SuatuTinjauan Dari Aspek Ergonomi Atau Kaitan Antara Manusia Dengan Work environmentnya, Cetakan Ketiga, CV.Mandar Maju, Bandung.
Simanjuntak, Payaman J., 2005. Isu and Kebijakan Manajemen Sumberdaya Manusia, Universitas Indonusa Esa Unggul, Jakarta.
Sudaryono 2014, Budaya and perilaku organisasi, Lentera Ilmu Cendekia, Jakarta. Sugiyono, 2010. Statistika untuk Penelitian. Bandung: Alfabeta
Sugiyono. 2012. Metode Penelitian Kuantitatif Kualitatif and R&D. Bandung: Alfabeta.
Sunyoto, D 2012, Teori kuesioner, and analisis data sumber daya manusia (praktik penelitian), Center for Academic Publishing Service, Yogyakarta.
Sutrisno, Edy 2015, ManajemenSumberDayaManusia, Kencana, Jakarta. Suwarto, FX 2010, Perilaku keorganisasian, Universitas Atma Jaya, Yogyakarta.
Syafri, W & Alwi 2014, Manajemen sumber daya manusia dalam organisasi public, IPDN Press, Jatinangor. Wibowo 2015, Perilaku dalam organisasi, Ed.2, Rajawali Pers, Jakarta.
Widodo, Joko 2005. Membangun Birokrasi Berbasis Performance. Jawa Timur: Bayumedia.