Patterns of Cognitive Development in Very Low Birth Weight Children
During the First Six Years of Life
Helene Koller, MS*; Katharine Lawson, PhD*; Susan A. Rose, PhD*; Ina Wallace, PhD‡; and Cecelia McCarton, MD*
ABSTRACT. Background. Cognitive development in
very low birth weight (VLBW, 1500 g) infants typically has been reported based on mean endpoints in cross-sectional studies. These overall group means mask indi-vidual patterns of cognitive development. Given the het-erogeneity of VLBW infants, it is important to identify individual patterns of development and the factors asso-ciated with the different patterns.
Objective. We sought to determine individual pat-terns of cognitive development over the first 6 years in VLBW children and to examine the relative influence of selected biomedical and sociodemographic factors on these patterns.
Method. VLBW infants (N5203) were followed from birth to six years. Cognitive scores were obtained at four yearly intervals, and biomedical and social data were obtained beginning with the neonatal period. Cluster analysis was used to identify individual patterns of cog-nitive development.
Results. Five developmental patterns were identi-fied: average–stable (13% of the sample); average– de-clined to low average (24% of the sample); average– declined to below average (43% of the sample); very low–increased to low average (8% of the sample); and very low–stable (12% of the sample). The patterns could be differentiated by several biomedical factors, including birth weight, gestational age, neonatal health, and 1-year assessments of neurological status and head circumference, as well as by level of maternal education. In particular, abnormal neurological status at 1 year was associated with a pattern of very low stable scores, and a suspicious status was associated with a pattern of improving cognitive development. Maternal education was influential among children born at the upper end of the VLBW range, who had a more favorable set of biomedical factors.
Conclusions. Biomedical factors are of major impor-tance for the cognitive development of VLBW infants, and their influence increases as birth weight declines. Differences in neurological integrity at 1 year were an important indicator of different patterns of cognitive de-velopment, especially for infants at the lower end of the VLBW range.Pediatrics 1997;99:383–389; very low birth weight, cognitive developmental patterns, cluster analy-sis, biomedical risk, sociodemographic risk.
ABBREVIATIONS. LBW, low birth weight; VLBW, very low birth weight; SGA, small for gestational age; NHI, neonatal health index.
Low birth weight (LBW,#2500 g) preterm infants are widely reported to be at increased risk for devel-opmental disabilities, with the risk increasing as birth weight decreases.1– 6Almost universally, the in-creased morbidity reported for LBW children has been based on methods defining various outcomes for them as a group and examining the statistical effects of various factors on these group outcomes. However, LBW infants are also known to be a very heterogeneous group, both in biomedical and socio-demographic characteristics and in developmental outcome. The typical reports of lower cognitive sta-tus, based on mean endpoints, mask important dif-ferences in individual patterns of development. Yet the differentiation of these patterns is crucial, so that we can begin to identify factors that are associated with diverse developmental courses. It is particularly crucial to explore this problem in infants of very low birth weight (VLBW,#1500 g), because medical tech-nical advances have dramatically increased their rates of survival, but they continue to be at very high risk for poor cognitive development.
Only one study7has attempted to identify patterns of individual difference in cognitive development in LBW children, and these researchers examined pat-terns only to the age of 3 years. In that study, only 25% were VLBW; the remainder were relatively heavier infants ($1500 g and#2500 g). They identi-fied five patterns of cognitive development over the first 3 years of life: three patterns declining to aver-age or below averaver-age; one high stable; and one very low stable. Some of these patterns had been hypoth-esized; for example, because LBW children are likely to show lower intelligence scores especially during the first few years of life, a below average stable group was expected. A pattern of increasing scores was also expected, in part because of “catch-up” and also because the evaluation instruments used at the endpoint of age 3 years rely less on the perceptual/ motor skills known to be problematic for many LBW infants. Yet this pattern of upward trend was not found, even though a large portion of these children received intensive intervention. An upward trend might be more likely in children of lower birth weights and higher perinatal risk, who initially have lower scores but who may recover from their early disadvantage, given additional time.
From the *Departments of Pediatrics and ‡Otolaryngology, Division of Behavioral Sciences, Albert Einstein College of Medicine, Bronx, New York. Received for publication Jan 21, 1996; accepted May 28, 1996.
Address correspondence to: Katharine Lawson, PhD, Kennedy Center 222, Albert Einstein College of Medicine, 1300 Morris Park Avenue, Bronx, NY 10461.
The present study focused on VLBW children, us-ing cluster analysis to identify individual patterns of cognitive development. The association of these pat-terns with several important biomedical and socio-demographic factors was then examined. Low birth weight and gestational age are well-recognized bio-medical factors associated with increased risk for developmental delays, and they were associated with patterns of development in the study of LBW children.7These and other biomedical factors would be expected to be even more important for the lower birth weight, higher risk children in the present study. Therefore, birth weight, gestational age, and additional biomedical risk factors were examined. In particular, an index of perinatal medical risk was included, because this might be expected to influence both “catch-up” and extent of medical complications associated with very early birth. Also included were three variables known to be associated with cogni-tive outcome in VLBW children,8 –10but whose effects on patterns of individual differences have not been explored: the infant’s birth weight in relation to its gestational age, that is, whether they were small for gestational age (SGA), and head circumference and neurological status at 1 year of age.
Sociodemographic factors have a well-known im-pact on cognitive outcome. This has been demon-strated both in children of normal birth weight11and in children of LBW.5,10,12,13 Although sociodemo-graphic factors would certainly be expected to have an impact on patterns of cognitive development ob-served in VLBW children, their effects might vary with different combinations of biomedical factors.
Thus, the purpose of the present study is (1) to determine patterns of individual differences in cog-nitive development over the first 6 years of life in VLBW children, and (2) to examine the relative im-pact of selected biomedical and sociodemographic factors on these patterns.
METHODS Subjects
Subjects followed were 203 VLBW infants, 92 boys and 111 girls, born between 1975 and 1989 and recruited from the Neonatal Intensive Care Units of three hospitals in the Bronx that were part of the Department of Pediatrics of the Albert Einstein College of Medicine. Criteria for inclusion in the present study were a birth weight#1500 g and cognitive data at four points in time (1; 2; 3 or 4; and 5 or 6 years of age).
Table 1 presents background data on the study population. The range of birth weights of this group was broad, with 25% weigh-ing #1000 g. One third of the infants were classified as SGA, defined as less than the third percentile.14The degree of neonatal
morbidity was also heterogeneous, as indicated by the Neonatal Health Index (NHI15). The NHI was calculated on the basis of
length of stay in the neonatal intensive care unit, adjusted for birth weight and standardized to a mean of 100, with higher scores indicating better health. This index had the advantage that it could be calculated for every child in the sample, whereas data on specific health problems were missing for some children. (The NHI was significantly related to the presence and severity of various health problems. For example, infants with bronchopul-monary dysplasia had a significantly lower mean NHI than those without bronchopulmonary dysplasia [71 vs 89.7, t5 24.63, df5
173, P,.001]; NHI was significantly correlated with intraventric-ular hemorrhage, coded on a four-point scale, r5.48, P,.001). The children were primarily from minority ethnic and racial back-grounds; 41% of their mothers did not complete high school.
Measures
Cognitive performance was measured using the Mental Devel-opment Index (MDI), of the Bayley Scales of Infant DevelDevel-opment, at 12 and 24 months of age, the Stanford-Binet Intelligence Scale at 4 years of age (the 3-year score was used if the 4-year score was missing, which occurred for 27% of the sample), and the Wechsler Intelligence Scale for Children—Revised at 6 years of age (the Wechsler Preschool and Primary Scale for Intelligence at 5 years was used if the score at age 6 was missing, which occurred for 36% of the sample). These are referred to as IQ 3/4 and IQ 5/6. Combining these ages ensured a cognitive index at each age point (ie, 1; 2; 3/4; and 5/6) for all children in the sample. Scores to age 4 were all corrected for gestational age at birth; scores at ages 5 and 6 were not corrected.
Neurological status was based on examination of the child at 1 year corrected age, using three classifications: (1) abnormal (16% of the sample), a severe abnormality, such as cerebral palsy, global hypotonicity, chronic seizures, hydrocephaly, blindness, or severe sensorineural hearing loss, for which a diagnosis could be estab-lished; (2) suspicious (46% of the sample), some atypical or ques-tionable signs in tone, reflexes, gait, or movement, but for which there is no definitive diagnosis or syndrome; and (3) normal (38% of the sample), based on a completely normal neurologic exami-nation.
Head circumference at 1 year corrected age was dichotomized into groups of#10th percentile (32% of the sample) and.10th percentile, based on separate growth charts for boys and girls.
Data Analysis
Patterns of Cognitive Development
Using the cognitive test scores described above, a hierarchical agglomerative cluster analysis (Ward’s method) was performed to identify relatively homogeneous subsets of children with similar developmental patterns.16,17In the first step of this analysis, each
individual is its own cluster, and each new cluster is formed by the merging of previous clusters; once a cluster is formed, it cannot be split. The cluster solution that best represents the data can be determined by examination of the coefficients in the agglomera-tion schedule, seeking a point where a sizable change occurs and selecting the number of clusters just before that point.18
The clusters were validated in two ways. First, the variables that were internal to the cluster analysis, that is, the cognitive test scores, were used in a discriminant analysis, to determine the percentage of children correctly classified, and in ANOVAs, to compare the mean cognitive scores across the clusters at each age. Second, variables external to the cluster analysis, that is, biomed-ical and sociodemographic characteristics of the children, were compared across the clusters, and discriminant analysis was per-formed to determine the relative contribution of the independent variables to cluster membership.
All analyses were performed using SPSS/PC1programs.
TABLE 1. Baseline Subject Characteristics
N (%) Mean SD
Biomedical
Birth weight 420–1500 g 203 1174.1 227.4 Gestational age 25–37 weeks 203 30.9 2.1 Neonatal Health Index (NHI)*
242.3–1147.3
198 87.2 21.5
Small for gestational age (SGA) 203 (38%) Sociodemographic
Maternal education 203
None beyond elementary school (4%)
Some high school (37%)
High school graduate (33%)
Some college (21%)
College degree or higher (5%) Racial and ethnic background 197
White (9%)
African-American (51%)
Latino (38%)
Other (2%)
RESULTS Patterns of Cognitive Development
Based on the criteria described above, a five-clus-ter solution was selected as best representing the data. The five patterns of cognitive development are illustrated in the Figure, and the mean cognitive scores of the children in the clusters are presented in Table 2. Discriminant analysis indicated that a total of 90% of the sample was correctly classified and that only one cluster was,90%; clusters D and E had the best fit (100% correctly classified).
Three of the clusters had mean IQs within the average range at 1 year; two of these had parallel profiles and one diverged somewhat. Cluster A (13% of the sample), labeled as average–stable, had mean cognitive test scores that remained in the average range and above the standardization mean of 100 throughout the 6 years. Cluster B (24% of the sam-ple), labeled as average– declined to low average, had scores that decreased between 12 and 24 months, and then remained in the low average range, with means around 90. Cluster C (43% of the sample), labeled as average– declined to below average, had a profile of decline similar to that of cluster B, but cluster C started almost 20 points below cluster B and then was ;10 points below after that; thus, cluster C remained.1 SD below the normative mean after 12 months. The last two clusters initially had mean cognitive test scores indicating significant de-lay. Cluster D (8% of the sample) was labeled as very low–increased to low average, because they began with scores .2 SD below the normative mean at 1 year and then steadily increased, ending with a low average mean IQ of 88 at 5/6 years. Cluster E (12% of the sample), labeled as very low–stable, displayed mean cognitive test scores that remained.2 SD be-low the normative mean at every age.
Associations With Patterns of Cognitive Development As indicated in Table 3, the clusters differed sig-nificantly on all the independent variables examined except SGA. Clusters A, B, and C had comparable mean birth weights (;1200 g), significantly higher than clusters D and E. They also had significantly higher percentages of children who were neurologi-cally normal than clusters D and E (partitioning df,19
x2516.25, df51, P,.001). Cluster A, with the best pattern of cognitive development, had a significantly higher level of maternal education than all other clusters combined (x2 5 11.76, df 5 1, P , .001). Cluster B had the highest NHI, significantly higher than that of cluster C, and close to average for their birth weight; their neurological status was the most optimal, significantly better than that of either cluster A (x255.12, df52, P,.05) or cluster C (x258.79, df5 2, P, .025), but their level of maternal educa-tion was not as favorable as that of cluster A (x2 5 5.22, df 5 1, P , .05). In cluster C, the level of maternal education was even less favorable than that of cluster B (x2 5 12.27, df 5 1, P , .001), and the children also had a significantly lower NHI than did children in cluster B. Clusters D and E were similar in very low birth weight, early gestational age, and a high proportion of males, significantly higher than clusters A, B, and C combined (x2512.24, df51, P, .001). However, cluster D also differed from cluster E; the children in cluster D had a significantly better NHI, and fewer had an abnormal neurological status (x2 5 9.92, df 5 2, P , .025) or a subnormal head circumference (#10th percentile; x2 5 4.74, df 5 1, P,.05). Cluster E had indicators of greater biomed-ical risk than every other cluster. The mean birth weight of the children in this cluster was ,1000 g, the NHI was significantly below that of all other clusters, more than two thirds were classified as neurologically abnormal at 1 year, and a similarly large proportion had a subnormal head circumfer-ence at 1 year. (Information on specific neurological diagnoses is based on the 3-year neurological exam-ination; these diagnoses were essentially unchanged for the 5/6-year examination. At 3 years, 20% of the cohort were neurologically abnormal; the diagnosis for 62% was spastic diplegia. Specific diagnoses for abnormal cluster members were the following: clus-ter A, 3 abnormal [3 spastic diplegia]; clusclus-ter B, 2 abnormal [1 hemiplegia and 1 hemiplegia1 seizure disorder]; cluster C, 12 abnormal [6 spastic diplegia, 1 spastic diplegia1porencephalic cyst, 1 triplegia, 2 microcephaly, 1 quadriplegia, 1 severe sensorineural hearing loss]; cluster D, 4 abnormal [3 spastic diple-gia, 1 triplegia]; cluster E, 18 abnormal [5 spastic diplegia, 3 triplegia, 3 quadriplegia, 1 spinal lesion, 2 microcephaly, 2 severe visual deficit, 2 multiple di-agnoses including hypotonia, microcephalia, and sei-zure disorder; and microcephalia, severe visual def-icit, seizure disorder, and spastic diplegia]).
Discriminators of Developmental Patterns
Independent variables used in the discriminant analysis were birth weight, gender, NHI, neurolog-ical status, and maternal education. Omitted from the analysis were (1) SGA, because it was found to be unrelated to cluster membership (see Table 3), (2) head circumference at 1 year, because of miss-ing observations, which disproportionately af-fected some of the clusters, and (3) gestational age, which failed to reach the statistical requirement for entry into the analysis (because the correlation with birth weight was high). Two discriminant functions were obtained (Table 4) that
ated among the five clusters. The first, labeled biomedical, was significant (Wilks’ l 5 .58, P , .0001, after the first function was derived), and the second, labeled sociodemographic, was marginal (Wilks’ l5 .90, P , .09, after the second function was derived). The biomedical function accounted for 84% of the total between-group variability. Ex-amination of the discriminant function coefficients of the independent variables on each function pre-sented in Table 4 indicates that only neurological status contributed positively to the biomedical function (..50) when other variables were held constant. The remaining variables made only
mi-nor contributions. Maternal education and the child’s gender each contributed positively, and at a similar level, to the sociodemographic function, which accounted for 10% of the total between-group variability.
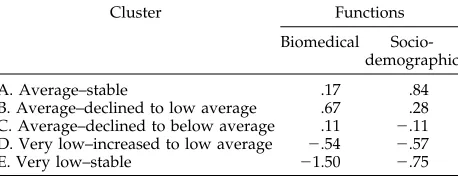
The group means of the five clusters on the two discriminant functions are presented in Table 5. Cluster A (average–stable) was average on the bio-medical function and highest on the sociodemo-graphic function. Cluster B (average– declined to low average) was highest on the biomedical function and average on the sociodemographic function. Cluster C (average– declined to below average) was average on
TABLE 2. Means of the Five Clusters on the 12- and 24-Month MDI Scores, the 3- or 4-Year IQ Scores, and the 5- or 6-Year IQ Scores for Total Sample of Very Low Birth Weight Children (#1500 g)*
Test Total
(N5203)
A. Average–
Stable (N527)
B. Average– Declined to Low Average
(N548)
C. Average– Declined to Below Average
(N588)
D. Very Low– Increased to Low Average
(N516)
E. Very Low– Stable (N524)
MDI-12 91.09620.06 100.3618.7 110.468.6 91.968.4 63.269.0 57.9610.1
MDI-24 82.90617.59 109.6611.8 90.5610.2 79.469.9 77.167.4 54.367.9
IQ 3/4 82.59614.55 102.9612.1 88.269.3 78.869.1 84.465.5 61.369.9
IQ 5/6 85.30615.36 107.0610.7 89.9612.4 82.068.7 87.968.0 62.0610.0
Percentage correct 89.7% 92.6% 93.8% 81.8% 100% 100%
classification†
* All children in the sample were tested at each age. Group differences were tested by one-way ANOVAs, all P5.000; results of posthoc LSD procedures for MDI12: Cluster B.A, C, D, E; Cluster A.C, D, E; Cluster C.D, E; MDI24: Cluster A.B, C, D, E; Cluster B. C, D, E; Clusters C, D.E; IQ 3/4: Cluster A.B, C, D, E; clusters B, D.C, E; Cluster C.E; IQ 5/6: Cluster A.B, C, D, E; Clusters B, D.C, E; Cluster C.E.
† Predicted group membership from discriminant analysis using the four test scores as discriminators.
TABLE 3. Comparisons of the Five Clusters on Biomedical and Sociodemographic Variables*
A. Average–
Stable
B. Average– Declined to Low Average
C. Average–
Declined to Below Average
D. Very Low–
Increased to Low Average
E. Very Low–
Stable
P level
Birth weight N 27 48 88 16 24
M 1238.0 1254.7 1190.4 1031.3 976.7 ,.001†
SD 213.6 202.8 200.9 267.9 211.9
%#1000 g 21% 15% 15% 50% 54%
Gestational Age (GA) N 27 48 88 16 24
M 31.2 31.3 31.1 29.9 29.3 ,.001
SD 2.4 1.7 1.9 2.5 2.3
Small for GA N 27 48 88 16 24
% SGA 33% 31% 41% 44% 46% N.S.
NHI N 27 46 85 16 24
M 89.9 94.3 86.4 87.4 73.4 ,.01
SD 15.2 15.1 24.9 14.7 23.1
Neurological Status N 26 48 88 16 24
% Abnormal 11.5% 2.1% 9.1% 18.8% 70.8% x2575.6‡
% Suspicious 42.2% 35.4% 52.3% 68.8% 20.8% df58
% Normal 42.3% 62.5% 38.6% 12.5% 8.3% ,.0001
Head Circumference N 17 34 69 11 19 x2515.3
df54
%,tenth percentile 18% 21% 32% 27% 68% ,.005
Gender N 27 48 88 16 24 x2515.3
df54
% Male 26% 38% 44% 69% 71% ,.005
Maternal Education N 27 48 88 16 24 x2517.4
df54
%,High School Graduate 11% 35% 49% 38% 63% ,.005
* No significant differences between clusters were found for multiple birth, early intervention, or foster care placement; insufficient data precluded analysis for other variables.
† Mean group differences tested by one-way ANOVAs; results of post-hoc LSD procedures for birth weight: Clusters D, E,A, B, C; gestational age: Cluster E,A, B, C; Cluster D,B, C; NHI: Cluster E,A, B, C, D; Cluster C,B.
the biomedical function and moderately low on the sociodemographic function. Cluster D (very low– increased to low average) was low on both functions. Cluster E (very low–stable) was lowest on both, and especially low on the biomedical function.
DISCUSSION
This study examined the patterns of cognitive de-velopment in a sample of VLBW children, many of whom had poorly educated mothers, placing them at risk for developmental delays on both biomedical and sociodemographic grounds. Five developmental patterns were identified by cluster analysis. The clus-ters were subjected to validation analyses and found to be sufficiently different from one another on the criterion variables to indicate good validity. Their developmental patterns indicated that throughout the first 6 years of life, 37% (clusters A and B) of the children performed consistently in the average range, 12% did consistently poorly (E), and 8% (D) showed a steady improvement. The largest group (43%) (C) declined from average to below average.
With one exception, all the independent variables examined were significantly associated with cluster membership. The exception was SGA. The absence of a relationship between SGA and outcome is probably attributable to the relatively limited birth weight range of the children studied (#1500 g), because a report of the LBW (#2500 g) cohort from which the present sample was drawn has shown SGA to be related to lower cognitive scores.8
Four of the five clusters identified in the present study had counterparts in the Liaw and Brooks-Gunn7study of larger LBW children. Two clusters, C (average– declined to below average) and E (very low–stable), were quite similar to clusters in their study, both in profile (ie, the shape of the curve) and absolute level (ie, the magnitude of the mean test scores). Two other clusters, A (average–stable) and B
(average– declined to low average) were similar in profile to two of their clusters but had lower absolute levels of cognitive performance.
The cluster that had no counterpart in the Liaw and Brooks-Gunn study was Cluster D (very low– increased to low average), which showed a pattern of scores that increased with age. It may be, as was suggested earlier, that this increasing pattern is as-sociated with the greater vulnerability of the present sample and that “catch-up” occurs as the early med-ical complications resolve.
In both studies, the children were comparable in socioenvironmental background, with similar pro-portions of mothers who did not complete high school, and, with one exception, there were similar distributions of maternal education in clusters with similar profiles. The exception was the very low sta-ble cluster, in which 21% of the mothers in the Liaw and Brooks-Gunn study did not finish high school, compared with 63% in the present study. Liaw and Brooks-Gunn suggested that biomedical problems may have overwhelmed the social factors in their very low stable cluster. However, other researchers point to evidence that the combined effects of severe neonatal insult and high social risk can be devastat-ing.5,20,21This appears to have occurred in the present study, in which children with the poorest set of biomedical factors and the lowest level of maternal education had a pattern of persistently very low scores (cluster E).
In general, given the overall comparability in level of maternal education, it appears that the major dif-ferences in patterns of cognitive development be-tween the two studies—the lower absolute levels of cognitive performance in clusters A and B and the emergence of a “catch-up” cluster in the present study—are most likely attributable to the greater biomedical insults experienced by VLBW infants than by LBW infants.
Within the present study itself, there were two interesting contrasts. First, two clusters had simi-larly poor mean cognitive scores at 1 year, but one (cluster E) remained very low throughout, whereas the other (cluster D) improved and eventually at-tained a mean in the low average range by 5/6 years of age. Comparison of these two clusters reveals that although birth weights and gestational ages were similar, the group that improved had better neonatal health, more normal 12-month head circumference, and better neurological status. Particularly striking is the finding that two thirds of those whose scores remained low (cluster E) had clear neurological abnormality at 12 months; in contrast, two thirds of those whose cognitive scores improved (cluster D) were diagnosed as neurologically suspicious, but only 19% had clear neurological abnormality. The group that im-proved across age presents a picture of resilient children whose early depressed development was primarily associated with extreme LBW and gen-eral immaturity of the nervous system but without clear neurological abnormality. By 5/6 years of age, their mean IQ was on a par with that of children born at higher birth weight, greater
ges-TABLE 4. Rotated Standardized Discriminant Function Coef-ficients (N5194)
Discriminator Functions*
Biomedical Sociodemographic
Neurological status at 1 year .84 2.30
Neonatal Health Index (NHI) .22 .06
Maternal education 2.07 .70
Gender .01 .65
Birth weight .26 .46
* The first (biomedical) function was significant (P,.001). The second (sociodemographic) function reached the P,.09 level of significance.
TABLE 5. Group Means of the Five Clusters on the Two Discriminant Functions
Cluster Functions
Biomedical Socio-demographic
A. Average–stable .17 .84
B. Average–declined to low average .67 .28 C. Average–declined to below average .11 2.11 D. Very low–increased to low average 2.54 2.57
tational age, and a far better set of biomedical factors (cluster B). Moreover, 73% of those who had been neurologically suspicious at 1 year were now considered neurologically normal. This is consistent with reports of other researchers22–24that mild hypotonia (classified here as neurologically suspicious) has been found to diminish between infancy and 2 to 3 years of age in preterm children. The second interesting contrast involves two clus-ters that show the inverse picture, namely, both had relatively good mean cognitive scores at 1 year, but one maintained its good standing (cluster A), whereas the other declined (cluster B). The group that maintained its advantage had a relatively good biomedical history and the highest level of maternal education of all the clusters. The group that declined was the least compromised in terms of biomedical factors; however, its relatively benign medical course was apparently not enough to compensate for less favorable sociodemographic factors, namely, that three times as many mothers had not graduated from high school.
Overall, there was a distressingly large number of children who declined in cognitive performance both in the present study (67%) and in the Liaw and Brooks-Gunn7 study of larger LBW children (81%). The degree to which the decline might be spurious, attributable to an inflation of 12-month Bayley scores, as suggested by Liaw and Brooks-Gunn, or attributable to the lower social status of both sam-ples, is not clear. Some researchers have noted that the negative impact of low social status on cognitive development is generally not evident for the first 18 to 24 months,12,25and that may explain the precipi-tous drop seen at 2 years.
Several significant implications can be drawn from this investigation. First, a neurological assessment at 1 year may be an important marker of subsequent patterns of cognitive development, especially among children at the low end of the VLBW range, a group for whom survival rates have increased dramatically in recent years. Cluster E, which was overrepre-sented by children of abnormal neurological status, was characterized by a persistence of very poor test scores. Cluster D, which was overrepresented by children with a suspicious neurological status, man-ifested an improving pattern of cognitive develop-ment; by early school age, most of the children’s suspicious signs had resolved, and the group dis-played cognitive scores in the low average range. Without an investigation of patterns of cognitive de-velopment, the latter group would not have been clearly identified.
Second, a unique pattern (cluster D) and lower absolute levels of cognitive development differenti-ated the present study from a study of larger LBW children.7Given the comparability of maternal edu-cation, the results point to the increased importance of biomedical factors in the cognitive performance of VLBW children, and demonstrate further that the influence of biomedical factors increases as birth weight declines. However, their influence varies, even when birth weights are similar.
Finally, in general, socioenvironmental
condi-tions were found to be less important than biomed-ical factors. However, among the larger VLBW infants, favorable socioenvironmental conditions, as indicated by maternal education, were influen-tial, with a higher level contributing to the main-tenance of optimal cognitive development (cluster A) and a lower level contributing to a decline (cluster B). Again, this differentiation would not have been apparent without an examination of patterns of development.
By determining the various patterns of cognitive development present among VLBW children and ex-amining their correlates, the present study helps to identify the characteristics of the children and their families that are associated with different develop-mental trajectories. Most important, it points up the individual differences in patterns of cognitive devel-opment, with some children remaining relatively sta-ble over time and others demonstrating increases or declines. Such differences are masked in cross-sec-tional studies. The findings make clear that for VLBW children, the role of the pediatrician includes continued developmental surveillance and educa-tional advocacy.
ACKNOWLEDGMENTS
This work was supported by a grant from the National Institute of Child Health and Human Development to the Rose F. Kennedy Center for Research in Mental Retardation and Human Develop-ment (HD01799).
REFERENCES
1. Msall ME, Buck GM, Rogers BT, Merke D, Catanzaro NL, Zorn WA. Risk factors for major developmental impairments and need for special education resources in extremely premature infants. J Pediatr. 1991;119: 606 – 614
2. McCormick MC. Long-term follow-up of infants discharged from neo-natal intensive care units. JAMA. 1989;261:1767–1772
3. Kopp CB, Kaler SR. Risk in infancy: origins and implications. Child Dev. 1989;44:224 –230
4. Hoy EA, Bill JM, Sykes DH. Very low birthweight: a long-term devel-opmental impairment? Int J Behav Dev. 1988;11:37– 67
5. Hunt JV, Bruce AB, Cooper BAB, Tooley WH. Very low birthweight infants at 8 and 11 years of age: role of neonatal illness and family status. Pediatrics. 1988;82:596 – 603
6. Eilers BL, Desai NS, Wilson MA, Cunningham MD. Classroom perfor-mance and social factors of children with birth weights of 1250 grams or less: follow-up at 5 to 8 years of age. Pediatrics. 1986;77:203–208 7. Liaw FR, Brooks-Gunn J. Patterns of low-birth-weight children’s
cogni-tive development. Dev Psychol. 1993;29:1024 –1035
8. McCarton CM, Wallace IF, Divon M, Vaughan HG. Cognitive and neurologic development of the premature, small for gestational age infant through age 6: comparison by birth weight and gestational age. Pediatrics. 1996;98:1167–1178
9. Vohr BR, Garcia-Coll CT. Neurodevelopmental and school performance of very low-birth-weight infants: a seven-year longitudinal study. Pedi-atrics. 1985;76:345–50
10. Hack M, Breslau N. Very low birth weight infants: effects of brain growth during infancy on intelligence quotients at 3 years of age. Pediatrics. 1986;77:196 –202
11. McCall RB, Applebaum, MI, Hogarty PS. Developmental changes in mental performance. Monogr Soc Res Child Dev. 1973;32 (Serial No. 150) 12. Escalona SK. Babies at double hazard: early development of infants at
biologic and social risk. Pediatrics. 1982;70:670 – 676
13. Lee HL, Barratt MS. Cognitive development of preterm low birth weight children at 5 to 8 years old. J Dev Behav Pediatr. 1993;14:242–24 14. Usher R, McLean F. Intrauterine growth of liveborn Caucasian infants at sea level: standards obtained from measurements in 7 dimensions of infants born between 25 and 44 weeks of gestation. J Pediatr. 1969;74: 901–910
preterm infants. Pediatr Res. 1989;25:263
16. Aldenderfer MS, Blashfield RK. Cluster Analysis. Beverly Hills, CA: Sage; 1984
17. Milligan GW, Cooper MC. Methodology review: clustering methods. Appl Psychol Meas. 1987;11:329 –354
18. Green JA. Analyzing individual differences in development: correla-tions and cluster analysis. In: Colombo J, Fagen J, eds. Individual Differ-ences in Infancy: Reliability, Stability, Prediction. Hillsdale, NJ: Erlbaum; 1990:77- 109
19. Maxwell AE. Analysing Qualitative Data. London, England: Methuen; 1967:52– 62
20. Cohen S, Parmelee A, Sigman M, Beckwith L. Antecedents of school problems in children born premature. J Pediatr Psychol. 1988;13:493–508
21. Hack M, Klein NK, Taylor HG. The long-term developmental outcomes of low birth weight infants. The Future of Children. 1995;5:176 –196 22. Ross G, Lipper EG, Auld PAM. Consistency and change in the
devel-opment of premature infants weighing less than 1501 grams at birth. Pediatrics. 1985;76:885– 891
23. Drillien CM. Abnormal neurologic signs in the first year of life in low-birthweight infants: possible prognostic significance. Dev Med Child Neurol. 1972;14:575–584
24. Ellison PH. Neurologic development of the high-risk infant. Clin Peri-natol. 1984;11:41–58
25. McCall RB. The development of intellectual functioning in infancy and the prediction of later IQ. In: Osofsky JD, ed. Handbook of Infant Devel-opment. New York, NY: Wiley; 1979:707–741
ADOLESCENT MEDICINE POSTGRADUATE COURSE
May 14 –16, 1997
Cosponsored by the Children’s Hospital of Boston and Harvard Medical School, Department of Continuing Education, and held at The Inn at Children’s, Boston, MA. Approximately 23 hours credit, Category I ($395 physicians’ tuition fee, $225 residents/fellows in training and other health professionals).
DOI: 10.1542/peds.99.3.383
1997;99;383
Pediatrics
Helene Koller, Katharine Lawson, Susan A. Rose, Ina Wallace and Cecelia McCarton
the First Six Years of Life
Patterns of Cognitive Development in Very Low Birth Weight Children During
Services
Updated Information &
http://pediatrics.aappublications.org/content/99/3/383 including high resolution figures, can be found at:
References
http://pediatrics.aappublications.org/content/99/3/383#BIBL This article cites 20 articles, 7 of which you can access for free at:
Permissions & Licensing
http://www.aappublications.org/site/misc/Permissions.xhtml in its entirety can be found online at:
Information about reproducing this article in parts (figures, tables) or
Reprints
DOI: 10.1542/peds.99.3.383
1997;99;383
Pediatrics
Helene Koller, Katharine Lawson, Susan A. Rose, Ina Wallace and Cecelia McCarton
the First Six Years of Life
Patterns of Cognitive Development in Very Low Birth Weight Children During
http://pediatrics.aappublications.org/content/99/3/383
located on the World Wide Web at:
The online version of this article, along with updated information and services, is
by the American Academy of Pediatrics. All rights reserved. Print ISSN: 1073-0397.