University of Pennsylvania
ScholarlyCommons
Publicly Accessible Penn Dissertations
1-1-2013
In-Depth Analysis of Zero-Length Crosslinking for
Structural Mass Spectrometry
Sira Sriswasdi
University of Pennsylvania, [email protected]
Follow this and additional works at:http://repository.upenn.edu/edissertations
Part of theBioinformatics Commons, and theBiology Commons
This paper is posted at ScholarlyCommons.http://repository.upenn.edu/edissertations/931
For more information, please [email protected].
Recommended Citation
Sriswasdi, Sira, "In-Depth Analysis of Zero-Length Crosslinking for Structural Mass Spectrometry" (2013).Publicly Accessible Penn Dissertations. 931.
In-Depth Analysis of Zero-Length Crosslinking for Structural Mass
Spectrometry
Abstract
The completion of the Human Genome Project revealed the sequence identity of essentially every human protein. However, in most cases, amino acid sequences alone convey little implication on the protein static structures, its dynamic conformational changes, and most importantly, its functions. To fully understand the behaviors and properties of macromolecular complexes, solving their 3D structures is necessary and highly critical. Under this rationale, structural genomics collaborations were initiated aiming to determine high-resolution structures of as many proteins and protein folds as possible, relying mostly on X-ray crystallography and NMR spectroscopy. Yet, very large, highly flexible or disordered, and dynamic protein complexes can exceed the capabilities of these high-resolution techniques. Although computational molecular modeling can be utilized, such structures are highly speculative and often inaccurate unless supported by actual
experimental data. Structural mass spectrometry recently emerged as an alternative method which can provide medium-resolution spatial information capable of complementing computational approaches, and are applicable to heterogeneous samples with potentially no limit on complex sizes. In particular, chemical crosslinking coupled with mass spectrometry, has recently received considerable interest. Most recent progress focused on developing crosslinkers with special properties such as enrichment tags, isotopic labeling sites, or MS-cleavable bonds along with accompanying data analysis strategies and software packages. These crosslinkers insert their spacer arm between proximal amino acid residues, greatly reducing the stringency of the derived distance constraints. In contrast, "zero-length crosslinkers" are crosslinks which do not add any extra atoms to the product crosslinked peptides, therefore providing the tightest possible spatial constraints but rendering enrichment and isotopic labeling strategies inapplicable. As a result, zero-length crosslinking received limited attention and no software tools have previously been specifically developed for it.
In this thesis project, we developed a multi-tiered mass spectrometry data acquisition and computational data analysis strategy along with a dedicated software tool to enhance identification of zero-length crosslinks in complex samples. Label-free comparison and targeted high-resolution mass spectrometry were utilized to filter out the vast majority of non-crosslinked peptides and increase confidence of crosslink identification, compensating for the lack of enrichment techniques and characteristic MS patterns employed by non-zero-length crosslinking methods. Each step from mass spectrometer acquisition parameters to MS/MS spectra evaluation functions was optimized based on zero-length crosslinking datasets of proteins with known crystal structures. Our pipeline was then applied to probe structures and conformational changes of mini-spectrin, a 90 kDa recombinant protein that closely mimics erythrocyte spectrin's dynamic dimer-tetramer equilibrium. Compared to previous analyses performed in our laboratory, the current strategy more than doubled the number of identified crosslinks and significantly reduced analysis time per experiment from months to just several days. Distance constraints derived from mini-spectrin crosslinks were used as inputs in subsequent homology modeling, allowing development of experimentally-verified medium-resolution structures for wild-type mini-spectrin tetramer and both wild-wild-type and hereditary elliptocytosis (HE) mutant mini-spectrin dimers. The structure models, in combination with independent biophysical experiments, illustrated how such distal HE-related mutations destabilized spectrin dimer-tetramer equilibrium by simultaneously lowering thermal stability of tetramer and giving rise to a more-compact, more-stable closed dimer conformation.
Degree Type Dissertation
Degree Name
Doctor of Philosophy (PhD)
Graduate Group
Genomics & Computational Biology
First Advisor David W. Speicher
Second Advisor Shane T. Jensen
Keywords
Crosslinking, Mass spectrometry, Spectrin
Subject Categories Bioinformatics | Biology
IN-DEPTH ANALYSIS OF ZERO-LENGTH
CROSSLINKING FOR STRUCTURAL MASS
SPECTROMETRY
Sira Sriswasdi
A DISSERTATION
in
Genomics and Computational Biology
Presented to the Faculties of the University of Pennsylvania
in
Partial Fulfillment of the Requirements for the
Degree of Doctor of Philosophy
2013
Supervisor of Dissertation Graduate Group Chairperson
_________________________ ________________________
David W. Speicher
Maja Bucan
Professor of Computational and Professor of Genetics
Systems Biology
Dissertation Committee:
Shane T. Jensen, Associate Professor of Statistics
Lyle H. Ungar, Professor of Computer and Information Science
Dennis E. Discher, Professor of Chemical and Biomolecular Engineering
ii
ACKNOWLEDGEMENT
There are many individuals whose contributions are critical toward the success of
this dissertation project. I am grateful for the warm, family-like supervision from my
advisor, Dr. David W. Speicher and his wife, Kaye. The past four and a half years in
Speicher laboratory at the Wistar Institute have been fun, and I have learned a lot of
research and life experiences. Dr. Hsin-Yao Tang and Tom Beer from the proteomics
core facility at the Wistar Institute were big helps teaching me how to use and
troubleshoot the mass spectrometer instruments. Sandra Harper and Peter Hembach
performed all biochemical and biophysical experiments for this project. Tony
Chang-Wong maintained data and software servers and was always a great office-mate. Thanks
to all members in the Speicher laboratory for contributing to the lively workplace
environment.
I would like to thank my committee members: Dr. Shane Jensen, Dr. Lyle Ungar,
Dr. Dennis Discher, and Dr. Ravi Radhakrishnan for their time and effort during the past
three years. Their insights were invaluable in steering the project in the right direction.
This work was supported by US National Institutes of Health grants HL038794
iii
ABSTRACT
IN-DEPTH ANALYSIS OF ZERO-LENGTH CROSSLINKING FOR
STRUCTURAL MASS SPECTROMETRY
Sira Sriswasdi
David W. Speicher, Ph.D.
The completion of the Human Genome Project revealed the sequence identity of essentially every human protein. However, in most cases, amino acid sequences alone convey little implication on the protein static structures, its dynamic conformational changes, and most importantly, its functions. To fully understand the behaviors and properties of macromolecular complexes, solving their 3D structures is necessary and highly critical. Under this rationale, structural genomics collaborations were initiated aiming to determine high-resolution structures of as many proteins and protein folds as possible, relying mostly on X-ray crystallography and NMR spectroscopy. Yet, very large, highly flexible or disordered, and dynamic protein complexes can exceed the capabilities of these high-resolution techniques. Although computational molecular modeling can be utilized, such structures are highly speculative and often inaccurate unless supported by actual experimental data. Structural mass spectrometry recently emerged as an alternative method which can provide medium-resolution spatial
iv
add any extra atoms to the product crosslinked peptides, therefore providing the tightest possible spatial constraints but rendering enrichment and isotopic labeling strategies inapplicable. As a result, zero-length crosslinking received limited attention and no software tools have previously been specifically developed for it.
In this thesis project, we developed a multi-tiered mass spectrometry data
acquisition and computational data analysis strategy along with a dedicated software tool to enhance identification of zero-length crosslinks in complex samples. Label-free comparison and targeted high-resolution mass spectrometry were utilized to filter out the vast majority of non-crosslinked peptides and increase confidence of crosslink
identification, compensating for the lack of enrichment techniques and characteristic MS patterns employed by non-zero-length crosslinking methods. Each step from mass spectrometer acquisition parameters to MS/MS spectra evaluation functions was optimized based on zero-length crosslinking datasets of proteins with known crystal structures. Our pipeline was then applied to probe structures and conformational changes of mini-spectrin, a 90 kDa recombinant protein that closely mimics erythrocyte spectrin’s dynamic dimer-tetramer equilibrium. Compared to previous analyses performed in our laboratory, the current strategy more than doubled the number of identified crosslinks and significantly reduced analysis time per experiment from months to just several days. Distance constraints derived from mini-spectrin crosslinks were used as inputs in subsequent homology modeling, allowing development of experimentally-verified
v
Table of Contents
ACKNOWLEDGEMENT ... ii
ABSTRACT ... iii
Table of Contents ... v
List of Tables ... vii
List of Figures ... viii
Chapter 1: Introduction and Background ... 1
1.1 Structural Mass Spectrometry ... 2
1.2 Chemical Crosslinking ... 4
1.3 Mass Spectrometry ... 10
1.4 Red Blood Cell Membrane Cytoskeleton ... 15
Chapter 2: Identification of Zero-Length Crosslinks in Proteins using Label-Free Quantitation and High-Resolution Fragment Ion Spectra ... 21
2.1 Introduction ... 21
2.2 Results ... 25
2.2.1 Development and Optimization of the Multi-Tiered MS Analysis for Zero-Length Crosslinks ... 25
2.2.2 Analysis of GST and Myoglobin ... 30
2.2.3 Impact of High-Resolution MS/MS Data ... 32
2.2.4 Comparison to StavroX, Crux, pLink, and MassMatrix ... 36
2.2.5 Feasibility of using zero-length crosslinking on 526 kDa spectrin heterodimers and intact red cell membranes ... 45
2.2.6 Graphical Evaluation of Identified Crosslinks ... 50
2.3 Discussion ... 55
2.4 Materials and Methods ... 60
Chapter 3: Solving Medium-Resolution Structures for Wild-Type Mini-Spectrin Dimer and Tetramer ... 69
3.1 Introduction ... 69
3.2 Results ... 71
3.2.1 Refinement of Mini-Spectrin Tetramer Model ... 71
3.2.2 Developing Mini-Spectrin Dimer Model ... 73
3.3 Discussions ... 79
vi
Chapter 4: Probing Large Conformational Rearrangements in Mini-Spectrins Induced by
Hereditary Elliptocytosis-Related αL207P and αL260P Mutations ... 85
4.1 Introduction ... 86
4.2 Results ... 88
4.2.1 Effects of αL207P and αL260P Mutations on Tetramer Assembly ... 88
4.2.2 Homology Modeling of αL207P Closed Dimer ... 92
4.3 Discussion ... 97
4.4 Material and Methods ... 100
Chapter 5: Conclusions and Future Directions ... 104
5.1 Conclusions ... 104
5.2 Future Directions ... 105
5.2.1 Further Improvements to the Crosslink Analysis Strategy ... 105
5.2.2 Application of the Crosslink Analysis Strategy to the Red Cell Membrane ... 108
vii
List of Tables
TABLE 1-1 Recent publications utilizing zero-length crosslinking. ... 9
TABLE 2-1 GST and myoglobin crosslinks identified at FDR of less than 1%. ... 33
TABLE 2-2 Crosslinks involving adjacent peptides on GST. ... 40
TABLE 2-3 Comparison of GST crosslink identifications using alternative software... 43
TABLE 2-4 Spectrin crosslinks. ... 47
TABLE 2-5 Power of high-resolution MS/MS data when applied to large protein complexes. ... 48
TABLE 2-6 The 29 most abundant proteins found in the intact membrane sample. ... 51
TABLE 2-7 The 19 most abundant proteins found in the membrane cytoskeleton. ... 52
TABLE 4-1 αL207P and αL260P mutant tetramer-specific crosslinks. ... 91
viii
List of Figures
FIGURE 1-1 Crosslink-derived Cα-Cα distance constraints. ... 5
FIGURE 1-2 Basic crosslinker design. ... 6
FIGURE 1-3 Power of crosslink-derived distance constraints on molecular modeling. ... 7
FIGURE 1-4 Crosslinking chemistry of EDC. ... 9
FIGURE 1-5 Isobaric interpretations for crosslinking of adjacent peptides. ... 10
FIGURE 1-6 Precursor isolation, peptide fragmentation, and MS/MS spectra generation. ... 12
FIGURE 1-7 Deducing charge states from isotopic envelope pattern. ... 13
FIGURE 1-8 Red cell membrane cytoskeleton. ... 17
FIGURE 1-9 The three-helix bundle secondary structure and spectrin tetramerization site. ... 17
FIGURE 1-10 Spectrin domain structure and dimer-tetramer equilibrium. ... 18
FIGURE 1-11 Schematic of mini-spectrin... 19
FIGURE 1-12 Locations of some common “distal” HE-related mutation sites. ... 20
FIGURE 2-1 Multi-tiered data acquisition and analysis pipeline for zero-length crosslinks. ... 27
FIGURE 2-2 Imperfect label-free comparison. ... 28
FIGURE 2-3 Crosslink analysis using GST. ... 34
FIGURE 2-4 Crosslink analysis using myoglobin. ... 35
FIGURE 2-5 Effect of removing MS/MS peaks with unassigned charge states. ... 37
FIGURE 2-6 Impact of high-resolution MS/MS spectra. ... 38
FIGURE 2-7 Consistency of crosslink identification across software packages. ... 44
FIGURE 2-8 Zero-length crosslink analysis of spectrin. ... 46
FIGURE 2-9 False discovery rates for the intact red cell membrane and isolated membrane cytoskeleton samples. ... 53
FIGURE 2-10 Graphical annotations of candidate crosslinks. ... 55
FIGURE 3-1 Spectrin topography and mini-spectrin tetramer structure. ... 75
FIGURE 3-2Identified inter-strand crosslinks facilitate refinement of the tetramer model. ... 76
FIGURE 3-3 Conformational changes in the closed to open spectrin dimer transition. ... 78
FIGURE 4-1 Differential scanning calorimetry. ... 89
FIGURE 4-2 Analytical gel filtration. ... 91
FIGURE 4-3 Long-range crosslinks unique to the mutant tetramer. ... 93
FIGURE 4-4 Mini-spectrin closed dimer inter-domain crosslinks. ... 94
1
Chapter 1: Introduction and Background
The completion of the Human Genome Project revealed the sequence identity of
essentially every human protein. However, in most cases, amino acid sequences alone
convey little implication on the protein static structures, its dynamic conformational
changes, and most importantly, its functions. To fully understand the behaviors and
properties of macromolecular complexes, solving their 3D structures is necessary and
highly critical. Under this rationale, structural genomics collaborations were initiated
aiming to determine high-resolution structures of as many proteins and protein folds as
possible, relying mostly on X-ray crystallography and NMR spectroscopy. Yet, very
large, highly flexible or disordered, and dynamic protein complexes can exceed the
capabilities of these high-resolution techniques. Although computational molecular
modeling can be utilized, such structures are highly speculative and often inaccurate
unless supported by actual experimental data. Structural mass spectrometry recently
emerged as alternative methods that can provide medium-resolution spatial information
capable of complementing computational approaches, and are applicable to
heterogeneous samples with potentially no limit on complex sizes. In particular, chemical
crosslinking coupled with mass spectrometry, has recently received considerable interest
mainly due to the recent developments of modern mass spectrometers with higher mass
2
1.1
Structural Mass Spectrometry
The use of mass spectrometry (MS) to probe structural information of
macromolecular complexes provides distinct advantages over high-resolution structural
determination techniques due to the fact that MS-based methods are much more tolerant
of heterogeneity and impurities in the samples, can detect dynamic, transient interactions,
and is less limiting in terms of protein complex size and abundance (1-5). Although
MS-based structural techniques provide only medium-resolution spatial constraints, they can
be used to complement computational molecular modeling and other conventional
structural determination methods, facilitating assembly of high-resolution subunit
structures into large complex models (6-7). Structural MS approaches consist of
top-down strategies that provide information on intact macromolecules and bottom-up
approaches which translate modified amino acid sites into solvent accessibility or residue
proximity data, each with its own strengths and weaknesses.
Ion mobility MS (IM-MS) (8-9) is a dominant top-down technique that translates
travel time of protein complex molecules in an electric field into collisional cross sections,
which are related to the shape and size of their 3D structures. IM-MS can be used to
probe the number and relative abundance of distinct, simultaneously occurring
conformations of protein complexes, and is capable of analyzing intact large-scaled
systems (10-12). Limitation of IM-MS includes the facts that the protein complex
integrity has to be stably preserved in gas-phase for analysis by MS and that the method
is only appropriate for detecting whole-complex-scale conformational changes. While
3
limitations, they rely heavily on the performance of downstream analysis strategies to sift
through the data for low abundance modified peptides. For example, hydroxyl radical
footprinting (13-14) modifies amino acid side chains with hydroxyl radicals generated
from hydrogen peroxide or irradiated water molecules, and peptides containing these
modifications are then identified using bottom-up MS. Since only solvent-accessible
regions of the molecule can be penetrated and labeled with hydroxyl radicals, this method
can recognize changes in protein surface topology and identify protein-ligand binding
interface. Complication of this technique centers on the facts that virtually every amino
acid can be modified, though the ranking of relative activity has been established, and a
number of them even result in multiple characteristic modifications (15-17). This
combinatorial expansion in search space can easily jeopardize the quality of peptide
identification. Hydrogen-deuterium exchange (HDX) (18-19) operates under the same
premise as hydroxyl radical footprinting but instead relies on modifying backbone atoms
with deuterium-containing water molecules (D2O as opposed to H2O). HDX is a hybrid
technique that can be used to both detect global changes in deuterium incorporation of
intact protein complexes and identify local solvent-accessible regions via bottom-up MS.
In addition to common drawbacks, HDX also suffers from back-exchange
(deuterium-labeled sites reverting back to hydrogen), requiring rapid MS analysis and restrictive
sample preparation conditions.
Another major bottom-up approach is chemical crosslinking (20-24), which
provides spatial constraints between proximal amino residues by inducing covalent bond
between them. This technique became our method of choice because it can generate
4
most suitable for guiding and validating computational molecular modeling. As a
bottom-up approach, major bottlenecks for chemical crosslinking and zero-length crosslinking in
particular, mainly involve the complexity of downstream data analysis and crosslinked
peptide identification.
1.2
Chemical Crosslinking
The concept of chemical crosslinking has been around since as early as 1971 (25)
but it was not until the mid-1990s that mass spectrometry became available for the
analysis of peptides and proteins, greatly expanding the utility of chemical crosslinking
(26-27). Prior to that, most studies had to rely on gel-based methods to detect mass-shifts
or changes in peptide profiles (28-29). During the past decade, advances in crosslinker
design and mass spectrometry technology allowed chemical crosslinking to be effective
on larger macromolecular complexes and biological systems (30-33).
In its simplest form, chemical crosslinking introduces bifunctional crosslinking
reagents which interact with certain amino acid side chains in order to form a covalent
bond between a pair of proximal residues. When setting up reactions, extreme care must
be taken to ensure that only one crosslink, on average, forms on each molecule of the
protein complex. Over-crosslinking occurs when the native structure of the protein is
significantly altered by too many rigid, unnatural crosslinks, which enable formation of
new artefact crosslinks. Consequently, crosslinking reactions are highly
substoichiometric and yield very low abundance crosslink signals. Next, crosslinked
samples are digested by proteases such as trypsin and subjected to MS analyses, and the
5
interpret crosslinked peptides as distance constraints, the chemistry involved and the
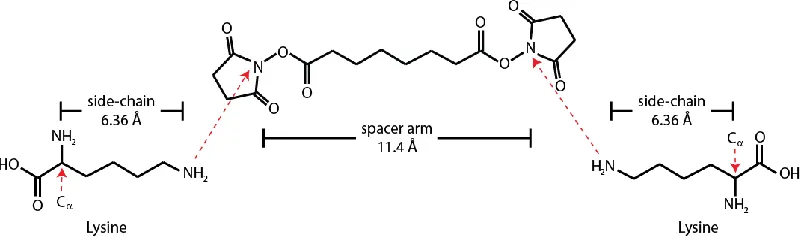
spacer arm length of the crosslinking reagent used must be taken in account. For example,
Disuccinimidyl suberate, or DSS, is a lysine-to-lysine crosslinker having a spacer arm
length of 11.4 Å, and hence, each of the derived crosslinks defines an approximate 25 Å
uncertainty between the alpha carbons of the two lysines involved. This is due to the
length of the spacer arm and the two lysine side chains lengths (FIGURE 1-1).
FIGURE 1-1 Crosslink-derived Cα-Cα distance constraints.
Distance constraint between Cα atoms of the two crosslinked residues can be computed
as the sum of amino acid side chain lengths and the crosslinker spacer arm. The
calculation is approximative since dynamics of the molecules are taken into account. DSS is used for illustration here.
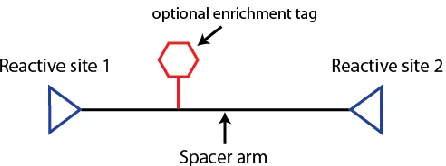
More than a hundred different crosslinkers are currently commercially available
(Thermo Scientific / Pierce, Invitrogen, and Creative Molecules to name a few), most of
them following the same basic design (FIGURE 1-2). Commonly utilized crosslinking
reactivity can be roughly classified into amine-to-amine, carboxyl-to-amine,
photoreactive, and those involving sulfhydryl function group on cysteine. The presence
of a spacer arm allows addition of isotope labeling sites, MS- or chemical-cleavable
6
downstream data analysis, at the expense of longer crosslink distances. To utilize
isotopically labeled crosslinkers, the “heavy” crosslinked sample derived from the
isotopically labeled version the crosslinker and the “light” crosslinked sample derived
from the non-labeled form are mixed at 1:1 ratio prior to MS analysis. As a result, each
true crosslinked peptide appears as a heavy-light pair with roughly similar abundance
while non-crosslinked peptides are present as single species. This discrepancy allows
crosslinked peptide precursors to be selected for further analyses with high specificity.
One such strategy additionally compares fragmentation patterns of the heavy and light
versions of the same crosslink in order to distinguish between linear and crosslinked
fragmented ions (34).
FIGURE 1-2 Basic crosslinker design.
The spacer arm provides a scaffold for incorporating isotope label sites, labile bonds, and enrichment tags.
Crosslinkers with MS-cleavable sites contain labile bonds that dissociate upon
low-energy fragmentation inside the mass spectrometer and cause either the release of
reporter ions to designate crosslink-specific MS/MS spectra (35) or the separation of the
two peptide backbones of a crosslink to generate two MS3 spectra of non-crosslinked
peptides that can be straightforwardly annotated (36). Another class of crosslinkers
7
simultaneously reducing the complexity of the crosslinked samples and raising the
concentration of crosslinked peptides. Some crosslinkers even combine several of these
features (37). The main drawback of crosslinkers that utilize any of the aforementioned
functionalities is the fact that their spacer arm (generally >10 Å) needs to be incorporated
into the crosslinked product, greatly diminishing the power of derived distance
constraints in validating and refining molecular modeling results (FIGURE 1-3). Also, the
lysine-lysine chemistry involved frequently generated stable dead-end and self-loop
products (38), further complicating crosslinked samples.
FIGURE 1-3 Power of crosslink-derived distance constraints on molecular modeling. As more distance constraints are used to restrain molecular modeling of a protein structure, the accuracy of the model (RMSD) greatly improves. Moreover, crosslinks derived from crosslinkers with shorter spacer arm lengths are much more effective. Zero-length crosslinkers correspond to the 9 Å trend. Image adapted from (21).
In contrast, zero-length crosslinkers do not add any extra atoms to crosslinked
products, yielding the most stringent distance constraints.
1-ethyl-3-[3-dimethylaminopropyl]carbodiimidedo (EDC or EDAC), a dominant zero-length
8
peptide bond between primary amines of lysine or the protein N-terminal to carboxyl
groups on glutamate, aspartate, or the protein C-terminal (FIGURE 1-4). However, the
uses of aforementioned enrichment and detection strategies which require incorporation
of parts of the crosslinker molecules into the products become inapplicable. As a result,
relatively few studies utilized zero-length crosslinking and most systems under
investigation were much smaller than 100 kDa equivalent of protein sequence complexity.
Moreover, manual analysis or combinations of multiple software tools were required to
process MS data and identify crosslinks (TABLE 1-1). Although a few software packages
originally developed for non-length crosslinking can be adapted to process
zero-length crosslinking datasets, many of them over-commit to the premise of lysine-lysine
crosslinking chemistry and the common usage of low-resolution MS/MS data (39). For
example, CrossWork (40) strictly operates on built-in definitions of popular lysine-lysine
crosslinkers while MassMatrix (41-42), originally developed for disulfide bond detection,
accepts user-defined crosslinkers but only allows single-residue-to-single-residue
definitions of crosslinking reaction. Only pLink (43) contains an option for ppm-level
mass tolerance for evaluating high-resolution MS/MS spectra.
Most importantly, the fact that EDC-derived crosslinks form via a direct peptide
bond implies that the mass of a crosslink between adjacent peptides of a protein is exactly
the same as the mass of a long, uncleaved linear peptide (FIGURE 1-5). In many cases,
these two isobaric possibilities produce largely indistinguishable patterns of fragmented
b- and y-ions. Not properly considering alternative linear peptide explanations will result
in false positive crosslinks. Since this complication does not occur when crosslinking
9
FIGURE 1-4 Crosslinking chemistry of EDC.
Image adapted from Thermo/Pierce website. EDC, supported by Sulfo-NHS, induces direct amide bond between two amino acid side chains without adding any extra atoms.
Year Complexity (kDa) Software Tools Reference
2010 50 Undisclosed (44) 2010 124 Popitam (45) (46) 2010 81 GPMAW (47) (48)*
2010 91 GPMAW (49)*
2011 16 MS2Links (50) (51) 2011 58 MassMatrix, Protein
Prospector (52) (53)
2011 16 Manual (54)
2012 29 Manual (55)
2012 19 MassMatrix (56) 2012 73 Popitam, xComb (57) (58) 2012 43 xComb, MS2Assign (38) (59) 2013 32 MassMatrix, GPMAW (60) TABLE 1-1 Recent publications utilizing zero-length crosslinking.
10
FIGURE 1-5 Isobaric interpretations for crosslinking of adjacent peptides.
TOP: Long, uncleaved linear peptide. BOTTOM: Crosslinked peptide. The two alternatives differ only by the locations of the highlighted amide bonds, resulting in identical masses.
on the use of decoy crosslinked peptides. To the best of our knowledge, no group has
developed a complete, dedicated data analysis software tool, especially one optimized for
high-resolution MS/MS data, for zero-length crosslinking experiments.
1.3
Mass Spectrometry
MS technology was first invented in 1912 by J.J. Thomson and it was in the late
1980s when soft ionization methods, namely matrix-assisted laser desorption/ionization
(61) and electrospray ionization (62), were developed which permitted MS analysis of
biological molecules including peptides and proteins. About a decade later,
high-resolution, high mass accuracy Fourier transform mass spectrometers, FT-ICR (63) and
the Orbitrap (64), were introduced. Improved mass accuracy in modern instruments
greatly reduces the ambiguities of peptide mass assignments and therefore increases the
confidence of identification (65). However, these improvements come at the cost of
reduced scan speed, sensitivity, and consequently, depth of analysis compared to
11
high mass accuracy and high depth of analysis, hybrid mass spectrometers, such as the
LTQ Orbitrap XL (Thermo Scientific) used in our laboratory, couple an Orbitrap to a
linear ion trap that is fast and sensitive but has low mass accuracy. This setup allows
simultaneous measurements of accurate peptide precursor masses in the high-resolution
mass analyzer (Orbitrap or FT-ICR) while obtaining a large number of MS/MS spectra
with the fast linear ion trap.
Basic instrument setup for a proteomics experiment generally includes a front-end
ultra-performance liquid chromatography (UPLC) which separates peptides based on
their hydrophobicity and continuously feeds them into the mass spectrometer. The point
in time from the sample injection to when a certain peptide eludes from the HPLC
column is called its retention time. At each point in time, the mass spectrometer first
acquires a full MS scan to determine mass-over-charge (m/z) and intensities of all signals,
also called precursor ions. Then, according to the setup parameters, a certain number of
the most abundance precursor ions are selected for fragmentation and MS/MS scans
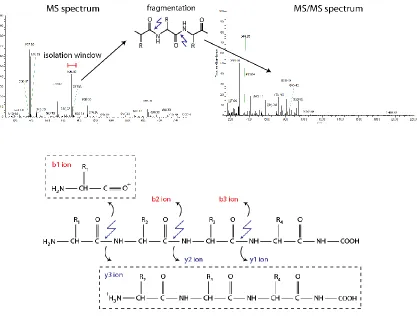
containing product ions were obtained (FIGURE 1-6). In practice, all ions within a small
m/z window (typically ± 1-1.25 m/z unit, called “isolation window”) surrounding a target
precursor are isolated for fragmentation.
To identify peptides from MS/MS spectra, the first step is to determine accurate
masses of the parent peptide precursors that gave rise to those spectra. Even though mass
spectrometer measures only m/z ratios, because each peptide exists as a distribution of
isotopes due to the existences of naturally occurring carbon-13, nitrogen-15, oxygen-18,
12
FIGURE 1-6 Precursor isolation, peptide fragmentation, and MS/MS spectra generation.
TOP: Precursor m/z corresponding to intense peaks in full MS scan are isolated and fragmented, giving rise to MS/MS spectra. BOTTOM: Each peptide bond can be fragmented, resulting in characteristic b-ions and y-ions.
precursor ion can be determined from the m/z spacing between adjacent isotopes
(FIGURE 1-7). Since full MS scans are generally obtained with a high-resolution mass
analyzer, observed precursor masses can be searched against a database of peptide
masses using stringent 5-10 parts per million (ppm) mass tolerance. Once matches are
found, theoretical fragmentation patterns of b- and y-ions are generated and compared to
13
performing the same search on a decoy database composed of reversed or randomized
protein sequences. For the purpose of identifying linear peptides, low-resolution MS/MS
data having mass accuracy on the order of ±0.5 amu or 250-2500 ppm is adequate.
Furthermore, high-performance protein database searches and MS/MS spectra evaluation
algorithms for linear peptides based on low-resolution MS/MS data are well-established
(66-67).
FIGURE 1-7 Deducing charge states from isotopic envelope pattern.
14
However, when it comes to analyzing crosslinking data, multiple challenges arise
that hinder both the detection and the identification of crosslinked peptides:
Crosslinking reactions are intentionally substoichiometric to prevent
over-crosslinking, resulting in < 1% crosslinked to linear peptide ratios.
Crosslinked peptides yield weaker signal in the mass spectrometer due to their
large average size.
Crosslinked peptides generate highly complex MS/MS spectra due to their
combined large size and high charge states (the number of possible fragmented b-
and y-ions is directly proportional to combined peptide size and charge state).
Fragmentation patterns of crosslinked peptides remain largely unknown.
Search space for theoretical crosslinked sequences grows with the square of the
protein complex size, raising the chance of getting indistinguishable isobaric
matches and false positives.
A number of extra functionalities on crosslinking reagents and their accompanying data
acquisition and analysis strategies were invented over the past decade to alleviate the
above bottlenecks. Unfortunately, these techniques are not amendable to zero-length
crosslinkers which add no extra atoms to their crosslinked products. Several reports (
68-69) advocated the use of size exclusion chromatography and strong cation exchange
chromatography by rationalizing that crosslinked peptides are larger and contain more
positive charges than their linear counterparts. However, our own analysis suggested that
there are not enough distinctions in masses and charge states to justify an extra
15
The primary goal of this dissertation was to improve the depth-of-coverage and
confidence of zero-length crosslinks identification by developing a novel multi-tiered MS
data acquisition and data analysis strategy. Also, a dedicated software tool was developed
to improve the throughput and eliminate tedious, manual review of complex MS/MS
spectra. Chapter 2 describes the strategy and software in details, along with their
validations.
1.4
Red Blood Cell Membrane Cytoskeleton
The red blood cell membrane cytoskeleton is responsible for maintaining the
integrity of and providing elasticity for the biconcave-shaped membrane, maximizing
surface area for rapid oxygen-carbon dioxide exchange and allowing the cells to squeeze
through tiny capillaries. The organization structure of the red cell membrane cytoskeleton
were extensively investigated (70-73) and high-specificity purification techniques for
isolating its major components were developed, making red cell membrane cytoskeleton
an ideal, tractable model system for protein structural studies. The fact that cytoskeleton
proteins undergo large conformational rearrangements in response to environmental
stresses (74-75) to sustain the membrane also makes this system attractive for
interrogating the relationship between protein complex structures and functions.
Furthermore, a number of disease-related mutations on cytoskeletal proteins that disrupt
red cell membrane structure were well-characterized, providing excellent opportunities to
translate basic structural biology knowledge into clinically-relevant information.
The key members of the red cell membrane cytoskeleton include spectrin, ankyrin,
16
anti-parallel αβ-heterodimers that can undergo head-to-head association and become
predominantly 1 MDa tetramers and moderately higher-order oligomers which are
anchored to the cell membrane via actin-protein 4.1 junctional complexes at the ends and
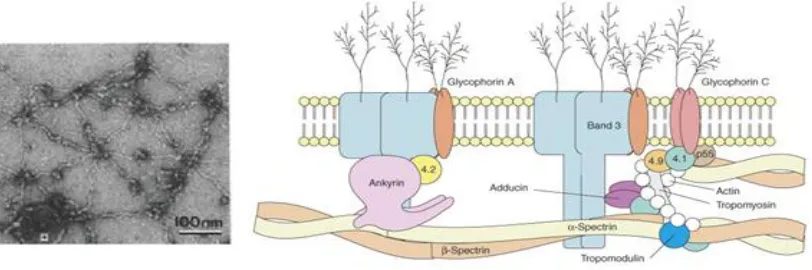
via ankyrin-Band3 complexes in the middle (FIGURE 1-8). Spectrin consists of
homologous ~106 amino acids domains, termed spectrin domains, each assuming a
three-helix bundle tertiary structure (FIGURE 1-9) (76). α-spectrin contains 20 full spectrin
domains, a partial one-third domain at its N-terminal, an SH3 motif, and an EF hand
domain at its C-terminal. β-spectrin contains 16 complete domains, a partial two-third
domain at its C-terminal, an ankyrin binding site (77-79), and an actin binding domain at
its N-terminal. Lateral dimerization of α- and β-spectrin initiates through high affinity
interaction between α20-21 and β1-2 domains (80-81), and is followed by lower affinity
association along the protein lengths(82). Spectrin dimers then enter the equilibrium
between closed dimers where the partial domain α0 folds back and binds to the
complementary partial domain β17 and complete a three-helix bundle structure, open
dimers, and tetramers when two open dimers associate head-to-head (83) (FIGURE 1-10).
A crystal structure for this important binding site (β16-17 and α0-1 domains) was
determined (84), and also represented one of the larger crystal structures of spectrin
17
FIGURE 1-8 Red cell membrane cytoskeleton.
LEFT: Electron microscopy image of the spread erythrocyte membrane cytoskeleton showing hexagonal lattice of spectrin tetramer filaments anchored by actin junctional complexes at the end-points and ankyrin complexes in the middle. Image taken from (85).
RIGHT: Schematic of the side view of the membrane cytoskeleton. Image taken from (86).
FIGURE 1-9 The three-helix bundle secondary structure and spectrin tetramerization site.
TOP: All crystal structures of spectrin-type domains consistently show that each domain adopt an almost identical three-helix bundle tertiary structure, justifying the use of homology modeling with these structures as templates for larger spectrin-type proteins.
18
FIGURE 1-10 Spectrin domain structure and dimer-tetramer equilibrium.
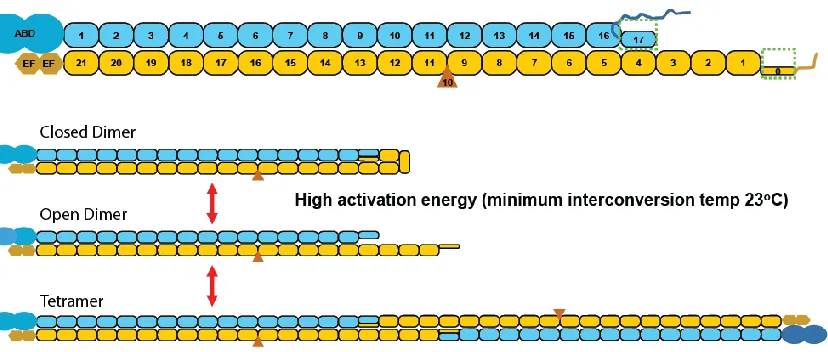
TOP: Spectrin heterodimers consist of laterally associated α- and β-spectrin (yellow and cyan, respectively). Each of α- and β-spectrin is comprised primarily of ~106 residue homologous domains. Other domains include ABD – Actin Binding Domain, and EF – EF hand domain. BOTTOM: Spectrin closed dimer-open dimer-tetramer equilibrium.
Spectrin tetramers possess extreme elasticity which is a major source of
deformability of the red cell membrane, as they are able to transform between an
approximate 700 Å conformation at physiological condition (87-89) and an extended
2000 Å structure under tensile stress or low ionic strength media (88, 90). Spectrin’s
ability to dynamically interconvert between dimer, tetramer, and higher oligomer states is
also believed to provide a considerable contribution to the maintenance of membrane
integrity (91). To shed light on the structural and functional properties of spectrin,
mini-spectrin (92) (FIGURE 1-11), a 90 kDa recombinant protein containing the spectrin
tetramer interface that closely mimics spectrin closed dimer-open dimer-tetramer
19
seven full spectrin domains with the addition of a flexible 16-residue glycine linker to
stabilize lateral αβ association. A preliminary medium-resolution homology model for the
180 kDa mini-spectrin tetramer was previously developed in our laboratory (49).
However, it was supported by only a few crosslinks based on small manually-analyzed
zero-length crosslinking datasets. In order to generate final, experimentally-verified
medium-resolution structures for mini-spectrin dimer and tetramer, in this dissertation,
we utilized our improved zero-length crosslinking strategy in conjunction with homology
modeling. Chapter 3 describes zero-length crosslinking and homology modeling of
mini-spectrin.
FIGURE 1-11 Schematic of mini-spectrin.
TOP: Mini-spectrin consists of 16 domains surrounding the spectrin tetramer binding site.
BOTTOM: Mini-spectrin closely mimics the spectrin dimer-tetramer equilibrium.
Hereditary elliptocytosis (HE) mutations weaken the erythrocyte membrane
cytoskeleton, resulting in deformed elliptical-shaped red blood cells and hemolytic
anemia in severe cases (93). It is estimated that roughly 1 in 2,000 to 4,000 individuals in
20
large number of genetic loci in α-spectrin, β-spectrin and, to a much lesser extent, other
membrane cytoskeleton components, and were found to involve all level of genetic
alteration from point mutations to gene insertions and deletions (93-94). While the
majority of the known mutations are located in the immediate vicinity of the spectrin
tetramer binding site (94), distal mutations such as αL207P and αL260P (95-96) are
located more than 100 Å away from the tetramerization site. These distal mutations
appear to affect the tetramer formation through unknown mechanisms (FIGURE 1-12). In
Chapter 4, we describe structural characterization of mini-spectrins containing these two
HE-related mutations using chemical crosslinking, homology modeling, and several
supporting biophysical experiments. As a result, an experimentally-verified
medium-resolution structure for αL207P closed dimer satisfying a number of mutant-specific
crosslink-derived distance constraints was successfully developed. Subsequent
comparative analysis between the mutant and the wild-type dimer structures illustrates
the utility of zero-length crosslinking in probing large, dynamic conformational
rearrangements. Overall, our data provided insights into the mechanisms of how these
distal HE-related mutations alter the balance of the spectrin dimer-tetramer equilibrium,
consequently destabilizing the red cell membrane cytoskeleton and the membrane itself.
21
Chapter 2: Identification of Zero-Length Crosslinks in
Proteins using Label-Free Quantitation and
High-Resolution Fragment Ion Spectra
In this chapter, we describe our multi-tiered strategy for identifying zero-length
crosslinks. The method utilizes two prevalent proteomics techniques – namely label-free
quantification and targeted tandem mass spectrometry – along with a new software tool,
ZXMiner. Small proteins with known crystal structures – glutathione S-transferase (GST,
25 kDa) and myoglobin (19 kDa) – were used to validate the pipeline and to optimize
computational analysis parameters. The performance of ZXMiner was then compared to
major existing crosslink analysis software using the GST dataset. Furthermore, to
illustrate the feasibility of our current method on large protein complexes, crosslinking of
the 526 kDa spectrin heterodimers, the isolated membrane cytoskeleton (> 1 MDa), and
the intact red cell membrane (> 2 MDa) were performed. Notably, these experiments
represent the largest zero-length crosslinking datasets analyzed to date.
2.1
Introduction
Chemical crosslinking coupled with mass spectrometry (CX-MS) is a valuable
tool for probing protein complexes that complements protein biophysical methods and
high-resolution structural determinations, as it provides distance constraints between
specific protein residues. Particular advantages are that CX-MS can be applied to
22
techniques such as X-ray crystallography and NMR cannot be directly exploited.
Similarly, structural information can be obtained from flexible or disordered proteins or
physiologically-important conformational changes on proteins that are too large for NMR.
Determining proximity for specific amino acid side chains can identify or confirm
protein-protein interactions or support structural model predictions by both distinguishing
between alternative predicted models and providing distance constraints for further model
refinement.
CX-MS emerged as an important experimental tool in the late 1990s (26-27) and
has been applied to diverse biological problems (30-33, 97). The extensive progress in
this field over the past decade has been recently reviewed (20-24, 98-99). Historically,
the biggest challenge in crosslink experiments has been identification of crosslink
products, which are usually present at very low stoichiometry, often produce weak MS
signals, and yield complex MS/MS spectra. The availability of high-resolution MS for
analysis of proteolyzed crosslinked proteins or complexes has been a key advance in the
field (100). Progress has been further facilitated by development of a substantial number
of crosslink reagents that facilitate MS identification of crosslinked products (22),
including incorporation of isotopic labels (101), MS-labile bonds (35-36), and enrichment
tags (37, 102). In addition, a number of software tools have been developed to take
advantage of the unique MS and MS/MS signatures produced by these specialized
crosslinkers. However, the main drawback of crosslinkers that utilize these MS-friendly
properties is that the spacer arm length is usually substantial. This greatly reduces the
stringency, and therefore the value, of the resulting distance constraints (21). Bifunctional
23
connected to only one end or both ends of the crosslinker reagent. The presence of
products from these side reactions further increases the complexity of peptide mixtures
and data analysis.
In contrast, “zero-length” crosslinkers such as EDC, eliminate a water molecule
when a bond is formed between an amine and a carboxyl group, rather than adding any
extra atoms to the crosslinked products. Hence, they yield the most stringent distance
constrains, which are optimal for identifying contact sites in multi-protein complexes and
for aiding computational molecular modeling (21). Another advantage of zero-length
crosslinkers is that they generally do not form stable dead-end and self-loop crosslinked
products. But, the lack of a spacer arm does not allow incorporation of isotope labels or
affinity tags, and relatively few studies have utilized zero-length crosslinkers with the
majority of systems studied having less than 100 kDa of unique protein sequence (48, 51,
53, 56, 58, 60). The unique protein sequence size is the most appropriate measure of data
analysis complexity in a crosslink experiment as complexity scales with the number of
unique peptides and not the actual complex size. That is, a 400 kDa heterodimer is a far
more challenging problem that a 400 kDa complex comprised of 10 copies of a 40 kDa
polypeptide chain.
The most important factor that has restricted the use of zero-length crosslinkers to
relatively small protein sequence-sized problems is the paucity of robust software tools
that have been optimized for zero-length crosslink data. As a result, many prior studies
involving zero-length crosslinks required extensive manual data analysis, which is
undesirable because it is subjective and tedious. Most existing software tools were either
non-zero-24
length crosslink datasets, and the few that are capable of processing zero-length crosslink
datasets do so with critical limitations (39). Also, most existing software tools do not
consider the important fact that a zero-length crosslink between adjacent peptides will
have an identical precursor mass to an incomplete proteolysis of these adjacent peptides,
and the MS/MS spectra are often quite similar. Another issue that is often not fully
considered when interpreting datasets from crosslink experiments is that very low false
discovery rates are essential and maximum depth of analysis is highly desirable.
Accurate crosslink assignment is critical because even a single false positive
identification can be quite detrimental, leading to incorrect assignments of protein-protein
interactions or incorrect distance constraints for molecular modeling that will result in
inaccurate structures. At the same time, failure to assign a significant portion of the
actual crosslinks present in a simple will usually diminish the value of the dataset due to
missed distance constraints. Hence, a dedicated analytical strategy and software tools
that are optimized for zero-length crosslinking is needed to fully realize the potential
offered by these more precise distance constraints.
In this study, we developed software and an analytical strategy that was optimized
for highly accurate identification of zero-length crosslinks. The analytical method
integrated two common proteomics techniques – namely label-free quantitation and
targeted mass spectrometry – into a multi-tiered strategy yielding high-resolution MS/MS
data with high depth-of-analysis for crosslinked peptides. An accompanying software
tool, Zero length Crosslink Miner (ZXMiner), facilitates data acquisition processes and
provides an optimized computational analysis of high-resolution MS/MS data in
25
proteins with known crystal structures. The performance of ZXMiner compared
favorably with alternative software tools currently used for crosslinked peptide analysis.
We demonstrate that good depth of analysis can be achieved with false discovery rates
(FDR) of less than 1%. Importantly, this new method is not significantly limited by size
of protein complex as even intact cell membranes can now be probed by zero-length
crosslinking.
2.2
Results
2.2.1 Development and Optimization of the Multi-Tiered MS Analysis for
Zero-Length Crosslinks
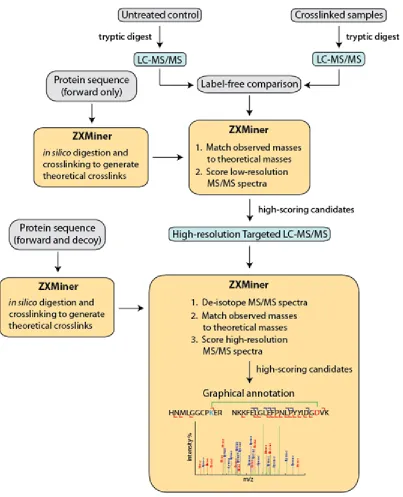
An overview of the multi-tiered LC-MS/MS data acquisition strategy and
associated software for analysis of zero length crosslinks is summarized in FIGURE 2-1.
This approach involves: 1) label-free comparison of crosslinked and control samples, 2)
matching of theoretical crosslinked peptides to putative crosslinks using low-resolution
MS/MS data, 3) targeted mass spectrometry to acquire high-resolution MS/MS data on
potential crosslinks, and 4) automated identification of crosslinked peptides. Individual
steps in the procedure were optimized primarily using standard proteins with known
crystal structures with further testing on larger protein complexes. Because zero-length
crosslinking does not allow incorporation of isotope tags or affinity tags to aid in
identification of crosslinked peptides, we found that label-free comparison of
high-resolution LC-MS data was the most effective method for filtering out many
non-crosslinked precursors. For each protein or protein complex of interest, LC-MS data for
26
that protein (typically multiple reaction times and temperatures). Any precursor signals at
least 10-fold enriched in at least one of the crosslink samples compared to the untreated
control were designated as crosslink candidates. Ideally, all crosslinked peptides would
produce signals that are unique to the crosslinked reactions and completely absent in the
control. But in complex samples, unrelated signals will frequently randomly overlap one
or more peaks in the isotopic envelope, giving a non-zero intensity background level in
the control (FIGURE 2-2). For simplicity, peptide ions either unique to the crosslinked
samples or enriched by at least 10-fold based on the label-free comparison will be
referred to below as “enriched” signals or candidate crosslinks.
The list of candidate crosslinked peptides from the label-free comparison is
subsequently narrowed down by comparing precursor masses enriched in the crosslinked
samples to those of theoretical crosslinks of peptides from the protein(s) analyzed. The
utility of this step is dependent upon the size of the protein or protein complex being
analyzed because the number of theoretical crosslinks increases with the square of the
amount of unique protein sequence, resulting in more random matches between observed
and theoretical precursor masses. For GST (26 kDa unique sequence; 52 kDa
homodimer), about 10% of the enriched signals matched a theoretical crosslink, but for
large protein complexes like red cell spectrin heterodimers (526 kDa unique sequence)
27
FIGURE 2-1 Multi-tiered data acquisition and analysis pipeline for zero-length crosslinks.
28
FIGURE 2-2 Imperfect label-free comparison.
29
the enriched signals matched a theoretical crosslink. Furthermore, while each enriched
signal from GST usually matched a single theoretical crosslink, enriched signals from
spectrin heterodimer matched an average of about 30, and as many as 50 distinct
theoretical crosslinks. This rapid increase in complexity, even when label-free
comparisons were used, illustrated the need for improved data acquisition and data
analysis tools.
Even when moderate-sized proteins were analyzed and a stringent 5 ppm
precursor mass tolerance was applied, most matches between enriched precursor signals
and theoretical crosslinks occurred by chance. Less than 5% of these initial matches were
subsequently identified as true crosslinks, illustrating further refinement of the candidate
crosslinked peptide list was needed. As the initial discovery LC-MS/MS analysis also
produced low-resolution MS/MS spectra, these data were further evaluated by
comparison to the expected fragment spectra of theoretical crosslinked peptides to further
distinguish the best candidate crosslinks. Three fundamental scoring functions were used
to evaluate the quality of such comparisons, including: Peak Coverage, Intensity
Coverage, and Ion Coverage (see Experimental Procedures). The geometric mean of
these three scores (GM score) was used to rank crosslink identifications. Based upon
initial tests, a preliminary GM score threshold for filtering low-resolution MS/MS spectra
was set at 0.4 to ensure high crosslink coverage. Lastly, to ensure that every candidate
crosslink would be targeted at least once in the subsequent high-resolution LC-MS/MS
runs, no more than 80-100 precursors were generally assigned to each 85-min run. To
ensure comprehensive detection of crosslinks in initial evaluations, four targeted
30
subsequent analyses showed that the number of targeted runs could be reduced with
minimal impact on depth of analysis. Another effective way of reducing the number of
required runs and required crosslinked sample was to use a longer gradient so that more
targeted MS/MS acquisitions could be fit into a single run. For example, a 4-hr LC
gradient could easily accommodate 300-400 targeted precursors per LC-MS/MS run on
an Orbitrap XL instrument, and only two targeted 4-hr runs were required for each
spectrin heterodimer sample to analyze all candidates (see below). Also, newer, faster
instruments should be able to accommodate even more targeted precursors per run.
2.2.2 Analysis of GST and Myoglobin
To evaluate our strategy and refine scoring schemes, chemical crosslinking
experiments using EDC/sulfo-NHS were performed on GST and myoglobin, whose
crystal structures are available (PDB: 1GTA and 1YMB, respectively). Using
high-resolution targeted LC-MS/MS data, each putative crosslink was annotated as a true
crosslink or non-crosslink based on alpha Carbon-alpha Carbon (Cα-Cα) distances in the
pertinent crystal structure and review of MS/MS spectra annotations. Also, the influence
of mobile regions in the crystal structures (higher b-factors) and involvement of likely
flexible regions of the molecule such as loops, subunit interfaces, and the protein termini
on crosslinkable residue distances were examined. Based on an typically accepted Cα-Cα
distance limit of 12 Å for zero-length crosslinks (103), crosslinks occurring between
residues whose alpha Carbons are at most 12 Å apart, and where good matches between
observed and theoretical spectra occurred, were labeled as true positive crosslinks. To
further verify these assignments, the fit between expected and observed fragment ions
31
of fully-extended lengths of the side chains of lysine and glutamate or aspartate (K ≈ 6.3
Å, E ≈ 3.8 Å, and D ≈ 2.5 Å) plus an additional 2 Å that might be contributed by
uncertainty due to molecular dynamics in solution, or crystal structure resolution, or both.
Crosslinks whose Cα-Cα distances exceeded 20 Å were automatically labeled as
non-crosslinks, as the high level of molecular flexibility in solution needed to account for
such events seemed unlikely to yield resolvable structures in crystallographic analyses.
Cα-Cα distances between 12 and 20 that involved residues located in regions likely to be
flexible were tentatively considered true positives. By visual inspection of the structure,
each crosslink was also required to occur between residues with a clear path between the
two side chains to qualify as a true positive crosslink, and as noted above, MS/MS
spectra were carefully scrutinized to confirm the assignment as a positive crosslink.
With less than 1% FDR (GM score > 0.38), we identified 25 crosslinked peptides
(counting different methionine oxidation states and charge states) in the GST sample
(TABLE 2-1), all of which were confirmed to be true positives by the annotation and
spectral review criteria described above. These crosslinks correspond to 13 unique
sequences and 10 distinct crosslinked sites on the molecule (FIGURE 2-3A). The fact that
most of the crosslinks were observed at multiple charge states and/or oxidation states of
methionine further supports the reported crosslink assignments. Complete annotation of
the GST datasets also revealed that the GM score derived from high-resolution MS/MS
data is a powerful indicator of true crosslinks (FIGURE 2-3B) that is far superior to scores
from low-resolution data (FIGURE 2-3C). Specifically, the area under the curve for the
corresponding ROC curve is 0.99 for GM score derived from high-resolution data and as
32
Furthermore, all of the true crosslinks with intermediate GM scores (0.2 to 0.4) were also
detected at other charge states or with different methionine modification state where the
GM score was higher than 0.4 (FIGURE 2-3B). For the myoglobin dataset, ZXMiner
identified 15 true positive crosslinks corresponding to 7 unique sequences and 6 different
crosslinked sites (FIGURE 2-4A, TABLE 2-1). The GM score derived from high-resolution
MS/MS data also performed very well on this dataset (FIGURE 2-4B, C) with a perfect
area under the ROC curve of 1.00.
2.2.3 Impact of High-Resolution MS/MS Data
One major limitation of low-resolution MS/MS data that is particularly a problem
for both manual and automated crosslinked peptide assignments is the fact that it is
impossible to confidently identify isotopic envelopes and charge states. Most crosslinked
peptides have charge states of at least +3 and many are +4 or +5 (TABLE 2-1), and
therefore MS/MS spectra of crosslinked peptides generally contain b- and y-ions with
multiple charge states or at least multiple possible charge states. For example,
fragmentation of the +5 precursor ion of a crosslinked peptide can produce b- and y-ions
that are +1, +2, +3, or +4. In low-resolution spectra, the combined uncertainty of charge
state and low mass accuracy for each ion (about ±0.5 amu) results in numerous random
matches between observed and expected fragment ions. High-resolution data acquisition
greatly reduces ambiguity in the MS/MS spectra by both reducing mass error from 0.5 amu to
low ppm levels and allowing isotopic envelopes to be resolved with accurate determination of
33
Unique Sequence
ID
Charge MH+ Crosslink Sequence Cα-Cα Distance GST
1 3,4 2455.2460 YEEHLY[E]R-{MSPILGYW[K]IK 5.5
1# 5 2471.2400 YEEHLY[E]R-{M#SPILGYW[K]IK 5.5
2 4 3508.7050 FELGLEFPNLPYYIDG[D]VK-HNMLGGCP[K]ER 8.7
2# 3 3524.6970 FELGLEFPNLPYYIDG[D]VK-HNM#LGGCP[K]ER 8.7
3 4 3878.9360 HNMLGGCP[K]ER-NKKFELGLEFPNLPYYIDG[D]VK 8.7
3# 4 3894.9140 HNM#LGGCP[K]ER-NKKFELGLEFPNLPYYIDG[D]VK 8.7
4 3,4 3636.7980 KFELGLEFPNLPYYIDG[D]VK-HNMLGGCP[K]ER 8.7
4# 3,4 3652.7920 KFELGLEFPNLPYYIDG[D]VK-HNM#LGGCP[K]ER 8.7
5 3,4 2561.4420 LLL[E]YLEEK-IEAIPQID[K]YLK 9.2
6 4 2717.5410 LLL[E]YLEEK-RIEAIPQID[K]YLK 9.2
7 3 2734.3930 LLLEYLE[E]K-YIAD[K]HNMLGGCPK 11.4
7# 3,4 2750.3840 LLLEYLE[E]K-YIAD[K]HNM#LGGCPK 11.4
8 3,4 2048.0540 [D]F[E]TLK-IAYS[K]DFETLK 11.6
9 5 3318.7510 YIAWPLQGWQATFGGG[D]HPPK-I[K]GLVQPTR 11.8
10 4 1856.0400 LLL[E]YLEEK-YL[K]SSK 12.4
11 3 3068.6050 LP[E]MLK-[K]FELGLEFPNLPYYIDGDVK 12.4
11# 3 3084.6010 LP[E]M#LK-[K]FELGLEFPNLPYYIDGDVK 12.4
12 3 3726.9063 YIAWPLQGWQATFGGGDHPP[K]}-V[D]FLSKLPEMLK 14.6*
13 3 3035.4860 MFE[D]R-[K]FELGLEFPNLPYYIDGDVK 15.8*
Myoglobin
1 4,5 1925.068 LFTGHPETL[E]K-F[K]HLK 6.00
2 4 1327.690 ASE[D]LK-FD[K]FK 8.10
3 4 3778.946 {GLS[D]GEWQQVLNVWGK-[K]GHHEAELKPLAQSHATK 8.50
4 4,5 2339.208 LFTGHPETL[E]K-HL[K]TEAEMK 10.90
4# 3,4 2355.202 LFTGHPETL[E]K-HL[K]TEAEM#K 10.90
5 3,4,5 2757.448 NDIAA[K]YK-GHH[E]AELKPLAQSHATK 11.80
6 4,5 2885.542 NDIAA[K]YK-KGHH[E]AELKPLAQSHATK 11.80
7 3,5 3094.781 V[E]ADIAGHGQEVLIR-HGTVVLTALGGIL[K]K 12.20
TABLE 2-1 GST and myoglobin crosslinks identified at FDR of less than 1%. Asterisks indicate crosslinks involving flexible regions whose Cα-Cα distances
34
FIGURE 2-3 Crosslink analysis using GST.
(A) Locations of identified crosslinks on the crystal structure of GST homodimer (PDB: 1GTA). Lys residues are highlighted in blue and Glu and Asp are in red. Black lines connect the two alpha Carbons of each crosslink. Crosslinks between residues whose Cα-Cα distances are significantly larger than 12 Å were highlighted in orange. (B) Scatter
plot showing the relationship between GM scores derived from high-resolution MS/MS data and Cα-Cα distances for all crosslink candidates in the GST dataset. A few
35
FIGURE 2-4 Crosslink analysis using myoglobin.
36
We considered discarding all peaks with unidentifiable charge states from the analysis to
further reduce uncertainty, but results were very similar to those obtained when ions with
unassigned charge states were retained (FIGURE 2-5). Importantly, the GM scores of
most non-crosslinks were reduced to zero when high-resolution MS/MS spectra was
evaluated, indicating that the majority of the matches between observed and theoretical
ions in the low-resolution scans occurred by random chance for these non-crosslinked
peptides (FIGURE 2-6B).
2.2.4 Comparison to StavroX, Crux, pLink, and MassMatrix
To evaluate the performance of our software developed specifically for
zero-length crosslink datasets, we compared ZXMiner to several common existing crosslink
analysis programs, namely StavroX (104), Crux (105-106), pLink (43), and MassMatrix
(41-42). StarvoX was considered because it had been shown to outperform a number of
other software packages. Crux was chosen since it best represents the concept of adapting
well-established database search algorithms for crosslinking, as it improved upon
prominent alternatives. Furthermore, Crux was developed based on zero-length crosslink
datasets with EDC. pLink was included due to its unique capability to utilize ppm-level
fragment mass tolerance and hence it is most suitable for high-resolution MS/MS data.
Lastly, MassMatrix was pertinent because it was utilized in several recent studies that
utilized zero-length crosslinking (53, 56, 60). One important special situation when
considering zero-length crosslinks is possible crosslinks between adjacent tryptic
37
FIGURE 2-5 Effect of removing MS/MS peaks with unassigned charge states.
Using high-resolution MS/MS information, we can de-isotope the majority of the peaks to determine their charge statesand monoisotopic masses. The remaining peaks can either be removed from further analysis since they are ambiguous and could result in erroneous matches or be retained and allowed to assume all possible charge state assignments. The two alternative strategies were compared using the GST dataset and only minor
38
FIGURE 2-6 Impact of high-resolution MS/MS spectra.
39
Because there is generally not enough MS/MS evidence to reliably distinguish between
these two cases, we expected that including these “adjacent-peptide crosslink”
identifications will result in high false positive rates. Furthermore, it is important to note
that many true adjacent-peptide crosslinks will involve proximal residue positions that
will provide less crucial structural information. In fact, examination of 11
adjacent-peptide crosslinks collectively reported by StavroX and Crux (TABLE 2-2) revealed that
two of them are false positives (Cα-Cα distances > 26.7 Å) and seven others occur
between nearby residues on the protein sequence and in the crystal structure and are
therefore uninformative. Hence, all such crosslinks were excluded for the following
comparisons of different programs in order to be consistent across software packages.
Exact crosslinked site information within an identified crosslinked complex was not
considered here because some programs either do not automatically assign crosslink sites
or do not rank the relative fit of alternative linkages.
GST crosslink datasets were used to compare the performance of ZXMiner
against existing crosslinking analysis software tools. Raw files containing low-resolution
MS/MS data were input into Crux (105-106), StavroX (104), and MassMatrix (41-42).
High-resolution MS/MS runs of the same crosslinked sample were used for pLink (43) as
this is the only program other than ZXMiner that can utilize high resolution MS/MS data.
Raw file format conversions were performed using ProteoWizard v3.0.4472 (107). FDRs
were set to be within 5% in all programs for consistency because this level is
automatically set in some programs and cannot be adjusted. Overall, a total of 15 unique
true crosslink sequences were identified (TABLE 2-3) and 8 of them were reported by at