Cognitive Delay and Behavior Problems Prior
to School Age
WHAT’S KNOWN ON THIS SUBJECT: Children with cognitive delay have been shown to have more behavior problems than typically developing children; however, few studies have investigated this relationship over time or among very young children.
WHAT THIS STUDY ADDS: Our findings provide some of thefirst national, prospective evidence that having a cognitive delay may place children at risk for developing and maintaining behavior problems before school age. Early identification and intervention may improve outcomes for these children.
abstract
OBJECTIVE: To investigate the relationship between cognitive delay (CD) and behavior problems between ages 9 months and 5 years, while adjusting for covariates related to CD.
METHODS:Data were from 4 waves of the Early Childhood Longitudinal Study, Birth Cohort (n = 8000). Children were classified as typically developing (TD) or as having resolved, newly developed, or persistent CD between 9 and 24 months, based on scores from the Bayley Short Form-Research Edition below or above the 10th percentile. Child behav-ior was measured by using the Infant/Toddler Symptom Checklist (ages 9 and 24 months) and the Preschool and Kindergarten Behavior Scales (ages 4 and 5 years); children in the top 10th percentile were considered to have a behavior problem. Hierarchical linear modeling estimated the effect of CD status on children’s behavioral trajectories, adjusted for confounders.
RESULTS:CD resolved for 80.3% of children between 9 and 24 months. Behavior problems at 24 months were detected in 19.3%, 21.8%, and 35.5% of children with resolved, newly developed, and persistent CD, respectively, versus 13.0% of TD children. Behavior problems increased among children with CD over time, and more so among children with persistent CD. By age 5, children with persistent CD had behavior scores moderately (0.59 SD) higher than TD children.
CONCLUSIONS:Behavior problems among children with CD are slightly higher at 9 months, clearly evident by 24 months, and increase as chil-dren move toward school age. Efforts to promote the earliest
identi-fication, evaluation, and service referral may be necessary to improve outcomes for these children.Pediatrics2014;134:e749–e757
AUTHORS:Erika Rose Cheng, PhD, MPA,aMari Palta, PhD,b
Milton Kotelchuck, PhD, MPH,aJulie Poehlmann, PhD,cand
Whitney P. Witt, PhD, MPHd
aHarvard Medical School and Massachusetts General Hospital for Children, Division of General Academic Pediatrics, Center for Child and Adolescent Health Research and Policy, Boston, Massachusetts;bDepartment of Population Health Sciences, University of Wisconsin School of Medicine and Public Health, Madison, Wisconsin;cDepartment of Human Development and Family Studies, Waisman Center, University of Wisconsin, Madison, Wisconsin; anddDivision of Maternal and Child Health Research, Truven Health Analytics, Bethesda, Maryland
KEY WORDS
cognitive delay, behavior problems, early childhood, early intervention, longitudinal
ABBREVIATIONS
BSF-R—Bayley Short Form-Research Edition BSID-II—Bayley Scales of Infant Development CD—cognitive delay
ECLS-B—Early Childhood Longitudinal Study, Birth Cohort EI—early intervention
ITSC—Infant/Toddler Symptom Checklist NCES—National Center for Education Statistics
PKBS-2—Preschool and Kindergarten Behavior Scales–Second Edition
SES—socioeconomic status TD—typically developing
Dr Cheng conceptualized and designed the study, conducted the analyses, and drafted the initial manuscript; Dr Palta assisted with the study design, helped interpret the data, and critically reviewed and revised the manuscript; Dr Kotelchuck critically reviewed and revised the manuscript and contributed to the interpretation of the data; Dr Poehlmann assisted with the study design and reviewed and revised the manuscript; Dr Witt assisted with the study design, acquisition of data,
interpretation of data, drafting of the manuscript, and critically reviewed and revised the manuscript; and all authors approved thefinal manuscript as submitted.
Mounting evidence demonstrates that children with cognitive delay (CD) are more likely to have psychosocial and be-havioral problems than children without CD.1–16Between 30% and 50% of children
and adolescents with CD are estimated to develop mental health disorders, a risk nearly 3 times that of typically developing (TD) children.2 Behavior problems with
CD are associated with increased costs of care,9 social isolation,17 poor academic
achievement,17 parental stress,7 and
residential treatment placement.17
Despite these clinical and societal costs, there are critical gaps in our knowledge about behavior problems among children with CD. Few studies have evaluated very young children with CD, focusing instead on school-aged children and adolescents.2
Moreover, existing data on very young children are drawn predominantly from convenience samples,7,8,10–13 limiting
generalizability. We know of only 1 rele-vant study in a nationally representative sample. Emerson and Einfeld16reported
that 2- to 3-year-old children living in the UK and Australia with developmental delays had more behavioral difficulties than their TD peers. However, differences in social, environmental, and health care resources may preclude generalization of that study to US populations.
Additionally, studies have mostly been cross-sectional. To our knowledge, only 2 longitudinal studies evaluated behavior problems among very young children with CD and both were limited by short follow-up periods and the use of con-venience samples.10,12,18 Baker et al7,10
reported more behavior problems in children with developmental delays than in those without delays between 36 and 48 months; by contrast, Feldman et al12
reported no differences.18
The above studies leave important ques-tions about the dynamics of behavior problems as children with CD age, espe-cially as CD status may change.19Recently,
McManus and Rosenberg20 found that
young children with persistent
develop-mental delays were more likely to use early intervention (EI) services than children whose delays improved, emerged, or worsened. It is unknown whether such dynamics of early childhood CD also affect its association with be-havioral development.
Using a large, national cohort of US chil-dren, we investigated the relationship between CD and behavior problems subsequent over a 3-year period in early childhood. We measured CD at 9 and 24 months, enabling us to examine how the onset and persistence of CD related to behavior problems. We hypothesized that children with indications of CD would have more behavior problems than their TD peers, with differences increasing with age. We also anticipated that the timing and persistence of CD would be associ-ated with different behavioral trajectories.
METHODS
Data Source
Data were from 4 waves of the nationally representative Early Childhood Longitu-dinal Study, Birth Cohort (ECLS-B). The ECLS-B selected a probability sample of the∼4 million children born in 2001, with oversampling of minority groups, twins, and those born at low and very low birth weights, from births regis-tered in the National Center for Health Statistics vital statistics system.21 The
sampling frame excluded births to mothers younger than 15 years and children adopted or deceased before the initial collection wave.22 Data
col-lection occurred between 2001 and 2006 when the children were∼9 months, 24 months, 4 years, and 5 years old.
Restricted data were obtained by approval from the US Department of Education, National Center for Education Statistics (NCES). Unweighted sample sizes were rounded to the nearest 50 to comply with NCES guidelines.21The University
of Wisconsin-Madison Health Sciences Institutional Review Board considered this study exempt from review.
From the original cohort of 10 700, we excluded cases where the (1) biological mother was not the survey respondent (n= 150), and (2) child did not complete the 9- and 24-month cognitive assess-ments (n= 1800). For each child sampled as a twin (n= 1500), we randomly se-lected 1 child from each pair to remain in the sample, leaving 8000 participants. Bivariate analyses found no statistically significant differences between partic-ipants in the original cohort and those in our sample (data not shown).
Measures
Cognitive Delay
CD was defined at ages 9 and 24 months by using the mental scale of the Bayley Short Form-Research Edition (BSF-R),21a
screen-ing instrument comprisscreen-ing a subset of items from the revised Bayley Scales of Infant Development (BSID-II).23BSF-R items
were selected from the BSID-II by using Item Response Theory modeling to ap-proximate full BSID-II results and to facili-tate comparisons of BSF-R and BSID-II scores. The ECLS-B datafile included esti-mated BSID-II scores (predicted number of correct item responses), derived from the BSF-R. Item Response Theory reliability coefficients for the BSF-R mental scale were 0.81 and 0.88, respectively, at 9 and 24 months.24NCES converted raw scores
to age-normed T-scores (mean = 50; SD = 10) by standardizing them relative to the weighted ECLS-B sample. For these scores, the age at administration for preterm children was recorded as chronological age adjusted for weeks preterm.
Consistent with previous research,25–27
we considered falling within the lowest 10th percentile of age-normed scores at either time point to indicate CD. Following Witt et al,28children were further classified as “ever”having CD and as having“resolved,”
“newly developed,”or“persistent”CD.
Child Behavior
Symptom Checklist (ITSC)29and the
Pre-school and Kindergarten Behavior Scales–Second Edition (PKBS-2),30
ad-ministered to mothers.
Seven items from the ITSC were adminis-tered during the 9- and 24-month inter-views, asking how often the child (1) is fussy or irritable, (2) goes easily from a whimper to an intense cry, (3) demands attention andcompany(9months)orisunabletowait for food or toys without crying or whining/ falling apart (24 months), (4) wakes up more than 3 or more times in the night and is unable to go back to sleep (9 months) or is easily distractible or hasfleeting at-tention (24 months), (5) needs a lot of help to fall asleep, (6) is startled by loud sounds (9 months) or tunes out from activity and is difficult to re-engage (24 months), and (7) cries for food or toys (9 months) or can’t shift focus easily from one project or ac-tivity to another (24 months).21,31
A 24-item version of the PKBS-2 was ad-ministered during the 4- and 5-year interviews. Principal-component analy-sis revealed that 9 items loaded on a single construct representing behavior problems. These items asked how often the child (1) was physically aggressive, (2) was angry, (3) was impulsive, (4) was overly active, (5) paid attention (reverse coded), (6) had temper tantrums, (7) had difficulty concentrating (age 4) or was unhappy (age 5), (8) annoyed other children, and (9) destroyed things.
We characterized behavior problems in 2 ways. First, as being above the top 10th percentile cut point, estimated as closely as the discreteness of scores allowed using the weighted distribution of ITSC or PKBS-2 scores at each age. Second, we summed responses to each of the items from the ITSC and the PKSB-2, creating a single variable with higher values indicating worse behavior. Scores were standardized (mean = 10; SD = 1) at each age.
Covariates
Birth certificates provided birth weight in grams (,1500 [very low]; 1500–2499
[low]; 2500–3999 [normal]; and$4000 [high]), plurality (singleton versus twin or triplet), and congenital anomaly diagnoses (ie, spina bifida or Down syndrome).
Covariates at 9 months included gen-der, race/ethnicity (non-Hispanic white; non-Hispanic black; non-Hispanic other race; or Hispanic), family structure (single versus 2-parent household), other children in the household (0, 1, or$2), and socio-economic status (SES). SES was defined by using quintiles of a composite index gen-erated by NCES incorporating caregiver education, labor force participation, and occupation.21 At 24 months, mothers
reported their child’s health insurance (none, only public, or any private), di-agnoses of developmental delay or mental retardation, and EI service utilization.
Analyses
Analyses used SAS 9.2 (SAS Institute, Inc, Cary, NC). Descriptive statistics for risk factors and outcomes were weighted to account for unequal probability sampling. Differences in characteristics between children with CD ever and across CD sub-categories (ie, resolved, newly developed, and persistent versus TD) were tested by weightedx2statistics by using a jackknife procedure with replicate weights.
Hierarchical linear modeling32via SAS
PROC MIXED with continuous standard-ized behavior scores as outcomes was performed to examine change in behav-ior with age. Models werefit with ran-dom slopes and intercepts allowing correlation between individual-level ran-dom effects.33 Fixed effects estimated
average growth trajectories of child be-havior over the study period, character-ized by an intercept (ie, baseline behavior) and slope (ie, linear change in behavior with age). Through interaction effects, we evaluated the degree to which trajectories differed between children with ever CD and TD children and then across CD subcategories. The final models adjusted for covariates and their interactions with age. These analyses
were performed unweighted as a sen-sitivity analysis by using weighted gen-eralized estimating equations yielded almost identical results.
Statisticalsignificanceofhierarchicallinear modeling coefficients was tested by using robust SEs.33 Coefficients represented
predicted standardized mean differences in behavior scores for each variable rel-ative to the reference group, reported as Cohen’s d effect sizes in SD units.34
RESULTS
Table 1 presents weighted descriptive statistics across the 5 CD groups (TD and ever, resolved, newly developed, and persistent CD). In the underlying pop-ulation, 13.7% were estimated to meet our CD criterion at either 9 and/or 24 months of age. Children with ever CD were more likely than TD children to be boys, born at very low or low birth weights, a multiple birth, non-Hispanic black race or His-panic ethnicity, low SES, publicly in-sured, have a congenital anomaly, and live in a single-parent household.
Approximately 20% of children with CD at 9 months remained with CD at 24 months, while 80% resolved. Children with re-solved CD were the most likely to be girls, a multiple birth, and of high SES. Children with persistent CD were the most likely to be born at very low or low birth weights, have a congenital anomaly, be boys, non-Hispanic black, and live with a single parent or 2 or more siblings.
Approximately 85% of children with CD at 24 months had normal cognitive scores at 9 months. These children were the most likely to be born at high birth weights and be of Hispanic ethnicity. They were somewhat more likely to fall in the lowest 2 quintiles of SES than those with persistent delays and considerably more likely than those with resolved delays.
persistently delayed. EI services were used by 2.9% of TD children versus 24.2% of those with persistent CD.
Prevalence of Behavior Problems
Children with CD were more likely to have behavior problems at all ages than
TD children, and differences increased with age (Table 2). Mother-reported ITSC scores at 9 months exceeded the cut point for 13.0% of TD children ver-sus 15.8% of children with CD (P= .01); by 24 months, the differential increased to 13.0% vs 22.1% (P,.0001). Overall
group differences were evident by 24 months, with behavior problems noted for 19.3%, 21.8%, and 35.5%, respectively, of children with resolved, newly de-veloped, and persistent CD (P,.0001).
Across all ages, children with persistent CD were most likely to have behavior
TABLE 1 Birth, Sociodemographic, Family, and Health Care Utilization Characteristics of Children by CD Status, National Estimates From the 2001 ECLS-B
Total CD Status, Ages 9 to 24 mo
TD Ever Pa Resolved Newly Developed Persistent Overallx2P
Total (unweighted) 8000 6550 1450 600 650 200
Birth factors
Birth weight status ,.0001 ,.0001
Very low 0.8 3.3 *** 5.2b
1.4 7.0b
***
Low 4.8 10.7 *** 14.8b
6.6 17.6b
***
Normal 84.5 79.8 *** 76.6b
83.6 70.9b
*
High 9.9 6.2 *** 3.4b
8.5 4.4
Plurality status ,.0001 ,.0001
Singleton birth 98.6 96.5 95.2b 97.6 96.2b
Twin or triplet 1.4 3.5 4.8b 2.4 3.8b
Congenital anomaly .05 .03
Yes 1.2 2.0 3.1b 0.8 3.5b
No 98.8 98.0 96.9b 99.2 96.5b
Sociodemographic and family factors
Child gender ,.0001 ,.0001
Boy 49.5 62.4 52.8b 66.9b 76.1b
Girl 50.5 37.6 47.2b 33.1b 23.9b
Child race/ethnicity ,.0001 ,.0001
Non-Hispanic white 55.7 41.3 *** 53.4 32.8b
40.5b
***
Non-Hispanic black 13.0 17.8 *** 16.1 18.6b
20.6b
**
Non-Hispanic other 7.1 8.2 7.8 8.2 10.2
Hispanic 24.2 32.7 *** 22.7 40.4b
28.8 ***
Child health insurance status ,.0001 ,.0001
Private 61.3 49.4 38.4b
43.9b
55.4b
***
Public 38.2 49.7 *** 55.5b
50.7b
40.4b
***
No insurance 0.5 0.8 6.1b 5.4b 4.2b
Family structure ,.0001 ,.0001
Single-parent household 18.7 24.3 24.5b 22.1b 35.8b
Two-parent household 81.3 75.7 75.5b 77.9b 64.2b
Other children in the household .28 .03
0 41.1 37.1 28.9b 43.9 31.4 **
1 33.8 35.1 41.9b 30.6 33.1b
2+ 25.1 27.9 29.3b 25.5 35.5b *
SES ,.0001 ,.0001
First quintile (lowest) 19.0 25.2 *** 22.6 26.8b 26.2 *
Second quintile 19.0 26.2 *** 19.6 30.7b
27.1 ***
Third quintile 20.3 18.9 16.6 20.8b
17.5 ***
Fourth quintile 21.0 15.4 *** 21.2 10.5b
19.6 ***
Fifth quintile (highest) 20.7 14.4 *** 19.9 11.2b
9.6 ***
Any EI services ,.0001 ,.0001
Yes 2.9 11.4 9.3b
10.6b
24.2b
No 97.1 88.6 90.7b
89.4b
75.8b
Developmental delay diagnosis ,.0001 ,.0001
Yes 3.7 14.1 9.5b 14.4b 31.1b
No 96.3 85.9 90.5b 85.6b 68.9b
Weighted estimates. Percentages may not sum to 100 due to rounding. Unweighted sample sizes were rounded to the nearest 50 in accordance with NCES guidelines. CD was defined by the lowest 10th percentile of the BSF-R mental scale at ages 9 and/or 24 mo, categorized as follows: resolved (CD detected at 9 mo but not at 24 mo); newly developed (CD detected at 24 mo but not at 9 mo); and persistent (CD detected at 9 and 24 mo); versus TD. ***P#.0001; **P#.01; *P#.05 for difference between resolved, newly developed, and persistent CD status.
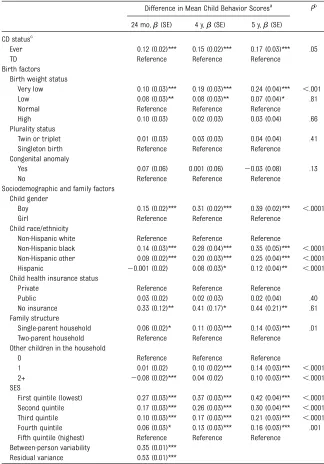
problems. At 24 months and 4 years, children with newly developed CD were more likely to have behavior problems than children with resolved CD.
Longitudinal Results
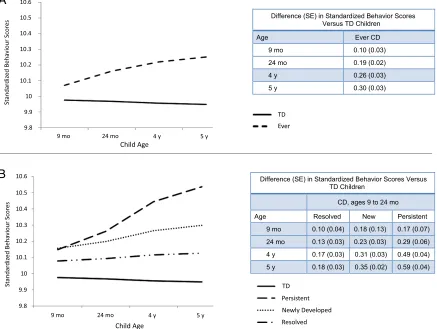
Children with CD ever had slightly higher behavior scores at 9 months, but notably
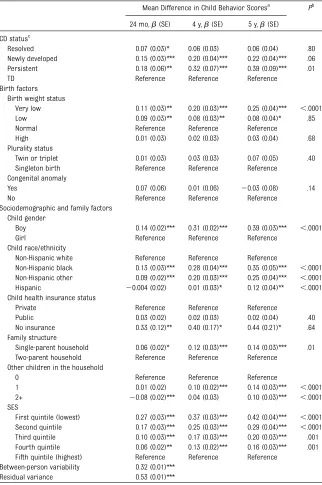
higher behavior scores 24 months than TD children; they also showed signifi -cantly faster increases in behavior scores with age. By age 5, behavior scores among children with ever CD were 0.30 SD higher than TD children (Fig 1). These differences attenuated, but remained statistically significant after adjusting for
covariates (Table 3). The difference at 5 years was similar to that of children born at very low birth weights and those living in single-parent households, but less than that of being boy, of non-Hispanic black or other race, without insurance, or having low SES. Very low birth weight, male gender, race/ethnicity, single-parent
TABLE 2 Prevalence of Behavior Problems Among Children by CD Status, National Estimates From the 2001 ECLS-B
Child Behavior Problems, by Age CD Status, Ages 9 to 24 mo
TD, % Ever, % Pa Resolved, % Newly Developed, % Persistent, % Overallx2P
9 mo (n= 8000) 13.0 15.8 .01 14.3b
16.4b
18.6b
.11
24 mo (n= 8000) 13.0 22.1 ,.0001 19.3b
21.8b
35.5b
,.0001
4 y (n= 7250) 9.0 18.2 ,.0001 13.3b
20.8b
24.1b
,.0001
5 y (n= 5700) 7.5 13.6 ,.0001 12.7b
13.7b
16.9b ,
.0001
Weighted estimates. Percentages may not sum to 100 due to rounding. Unweighted sample sizes were rounded to the nearest 50 in accordance with NCES guidelines. Child behavior problems were defined as falling in the top 10th percentile of ITSC (ages 9 and 24 mo) and PKBS-2 (ages 4 and 5 y) scores.
aPvalue for difference comparing children with ever CD to TD children. bIndicates statistically significant difference from TD children (P#.05).
FIGURE 1
household status, other children in the household, and lower SES predicted greater increases in behavior scores with age.
Behavior scores at 9 months were sta-tistically significantly higher among children with resolved, newly developed, and persistent CD than TD children. By 24 months, the effect sizes (Cohen’s d) for CD group differences ranged between 0.13 and 0.29, which are regarded as small effects.34 Scores increased with
age, especially for the newly developed and persistent CD groups (Fig 1). Chil-dren with persistent CD had behavior scores 0.59 SD greater than TD children by age 5. In the adjusted model (Table 4), the difference in the rate of change in behavior scores for the newly developed group was not statistically significant (P= .06). Persistent CD remained among the strongest predictors of initial levels and subsequent increases in behavior scores, and at age 5, children with per-sistent CD had adjusted behavior scores 0.39 SD higher than TD children.
DISCUSSION
We examined CD in early childhood and its relationship with subsequent be-havior problems by using a large, na-tional cohort of US children. Our results are important on several counts. First, our population-based data clarify that behavior problems among children with indications of CD are prevalent at very early ages. Across all preschool ages, children testing positive for CD by our criteria had worse behavior than their TD peers. This is consistent with previous clinic7,8,10–13 and nationally
representative16studies.
Second, adding to existing clinic-based work,10,12,18behavior problems among
children with CD increased significantly faster than among TD children, particu-larly between 24 months and 5 years of age. Importantly, our rich data set allowed us to examine behavior prob-lems among young children with CD over multiple years and adjust for numerous
potential confounders, providing a more complete view of the developmental course of these problems than pre-viously reported.
Third, CD status as measured changed considerably between 9 and 24 months. Although some changes may be due to
measurement error, especially leading to misclassification of borderline cases, the BSF-R has been reported to have high reliability.24Hence most of the changes,
especially among children with newly developed CD, are likely real, highlighting an important period for interventions
TABLE 3 Fully-Adjusted Model-Based Expected Trajectories of Child Behavior for Children With Ever CD Versus TD Children, Data From the 2001 ECLS-B
Difference in Mean Child Behavior Scoresa
Pb
24 mo,b(SE) 4 y,b(SE) 5 y,b(SE)
CD statusc
Ever 0.12 (0.02)*** 0.15 (0.02)*** 0.17 (0.03)*** .05
TD Reference Reference Reference
Birth factors Birth weight status
Very low 0.10 (0.03)*** 0.19 (0.03)*** 0.24 (0.04)*** ,.001
Low 0.08 (0.03)** 0.08 (0.03)** 0.07 (0.04)* .81
Normal Reference Reference Reference
High 0.10 (0.03) 0.02 (0.03) 0.03 (0.04) .66
Plurality status
Twin or triplet 0.01 (0.03) 0.03 (0.03) 0.04 (0.04) .41
Singleton birth Reference Reference Reference
Congenital anomaly
Yes 0.07 (0.06) 0.001 (0.06) 20.03 (0.08) .13
No Reference Reference Reference
Sociodemographic and family factors Child gender
Boy 0.15 (0.02)*** 0.31 (0.02)*** 0.39 (0.02)*** ,.0001
Girl Reference Reference Reference
Child race/ethnicity
Non-Hispanic white Reference Reference Reference
Non-Hispanic black 0.14 (0.03)*** 0.28 (0.04)*** 0.35 (0.05)*** ,.0001
Non-Hispanic other 0.09 (0.02)*** 0.20 (0.03)*** 0.25 (0.04)*** ,.0001
Hispanic 20.001 (0.02) 0.08 (0.03)* 0.12 (0.04)** ,.0001
Child health insurance status
Private Reference Reference Reference
Public 0.03 (0.02) 0.02 (0.03) 0.02 (0.04) .40
No insurance 0.33 (0.12)** 0.41 (0.17)* 0.44 (0.21)** .61
Family structure
Single-parent household 0.06 (0.02)* 0.11 (0.03)*** 0.14 (0.03)*** .01
Two-parent household Reference Reference Reference
Other children in the household
0 Reference Reference Reference
1 0.01 (0.02) 0.10 (0.02)*** 0.14 (0.03)*** ,.0001
2+ 20.08 (0.02)*** 0.04 (0.02) 0.10 (0.03)*** ,.0001
SES
First quintile (lowest) 0.27 (0.03)*** 0.37 (0.03)*** 0.42 (0.04)*** ,.0001
Second quintile 0.17 (0.03)*** 0.26 (0.03)*** 0.30 (0.04)*** ,.0001
Third quintile 0.10 (0.03)*** 0.17 (0.03)*** 0.21 (0.03)*** ,.0001
Fourth quintile 0.06 (0.03)* 0.13 (0.03)*** 0.16 (0.03)*** .001
Fifth quintile (highest) Reference Reference Reference
Between-person variability 0.35 (0.01)***
Residual variance 0.53 (0.01)***
***P#.0001; **P#.01; *P#.05.
aChild behavior was measured by the ITSC (ages 9 and 24 mo) and the Preschool and Kindergarten Behavior Scales-2nd
Edition (ages 4 and 5). Scores were summed and standardized to population; mean = 10, SD = 1. Higher scores indicate worse behavior.bcoefficients represent the SD difference in behavior scores compared with the reference group.
bPvalue for interaction with child age.
cCD was defined by the lowest 10th percentile of the BSF-R mental scale at ages 9 and/or 24 mo, categorized as ever (CD
aimed at reducing CD. Further, although over 85% of children with CD at 24 months displayed typical cognitive development at 9 months, 20% were
persistently delayed. Birth factors, in-cluding lower birth weights and congenital anomalies characterized persistently delayed children; this was not true for
newly developing cases. There are lim-ited data on the emergence, evolution, and resolution of childhood CD19; our
findings suggest that understanding these dynamics may be critical to inform pre-vention and rehabilitation efforts.
Fourth, the development of behavior problems varied across the timing and persistence of CD. Persistently delayed children fared worst, both in terms of early behavior problems and subsequent changes with age. This may be related to the etiology of persistent CD, as specific syndromes associated with CD (eg, ce-rebral palsy or Down syndrome) have been associated with distinct phenotypic expressions and patterns of childhood behaviors.11,35,36 This group may also
represent those with the most severe manifestations of CD and most accurate CD classification.
Low SES was associated with worse child behavior regardless of CD status. This aligns with previous research37 and
suggests that interventions to amelio-rate children’s behavior problems may need to consider the influence of low SES. Non-Hispanic black race and male gender also had equal or larger asso-ciations with behavior problems than CD. These children may be viewed as particularly important groups for mon-itoring, prevention, and intervention services. Although these variables had stronger estimated associations with behavior than CD, they were likely mea-sured without error, while CD was identified via a screening instrument. More accurate diagnosis of CD may have led to higher associations.
Our data cannot prove that CD is causally related to behavior problems, because both seem to develop together from the earliest ages. It is notable, however, that behavior problems increased most rapidly with age in the group where CD was often due to problems present at birth. Regardless of the causal or tem-poral relationships, the high prevalence of behavior problems among young
TABLE 4 Fully-Adjusted Model-Based Expected Trajectories of Child Behavior for Children With Persistent, Newly Developed, and Resolved CD Versus TD Children, Data From the 2001 ECLS-B
Mean Difference in Child Behavior Scoresa
Pb
24 mo,b(SE) 4 y,b(SE) 5 y,b(SE)
CD statusc
Resolved 0.07 (0.03)* 0.06 (0.03) 0.06 (0.04) .80
Newly developed 0.15 (0.03)*** 0.20 (0.04)*** 0.22 (0.04)*** .06
Persistent 0.18 (0.06)** 0.32 (0.07)*** 0.39 (0.09)*** .01
TD Reference Reference Reference
Birth factors Birth weight status
Very low 0.11 (0.03)** 0.20 (0.03)*** 0.25 (0.04)*** ,.0001
Low 0.09 (0.03)** 0.08 (0.03)** 0.08 (0.04)* .85
Normal Reference Reference Reference
High 0.01 (0.03) 0.02 (0.03) 0.03 (0.04) .68
Plurality status
Twin or triplet 0.01 (0.03) 0.03 (0.03) 0.07 (0.05) .40
Singleton birth Reference Reference Reference
Congenital anomaly
Yes 0.07 (0.06) 0.01 (0.06) 20.03 (0.08) .14
No Reference Reference Reference
Sociodemographic and family factors Child gender
Boy 0.14 (0.02)*** 0.31 (0.02)*** 0.39 (0.03)*** ,.0001
Girl Reference Reference Reference
Child race/ethnicity
Non-Hispanic white Reference Reference Reference
Non-Hispanic black 0.13 (0.03)*** 0.28 (0.04)*** 0.35 (0.05)*** ,.0001
Non-Hispanic other 0.09 (0.02)*** 0.20 (0.03)*** 0.25 (0.04)*** ,.0001
Hispanic 20.004 (0.02) 0.01 (0.03)* 0.12 (0.04)** ,.0001
Child health insurance status
Private Reference Reference Reference
Public 0.03 (0.02) 0.02 (0.03) 0.02 (0.04) .40
No insurance 0.33 (0.12)** 0.40 (0.17)* 0.44 (0.21)* .64
Family structure
Single-parent household 0.06 (0.02)* 0.12 (0.03)*** 0.14 (0.03)*** .01
Two-parent household Reference Reference Reference
Other children in the household
0 Reference Reference Reference
1 0.01 (0.02) 0.10 (0.02)*** 0.14 (0.03)*** ,.0001
2+ 20.08 (0.02)*** 0.04 (0.03) 0.10 (0.03)*** ,.0001
SES
First quintile (lowest) 0.27 (0.03)*** 0.37 (0.03)*** 0.42 (0.04)*** ,.0001
Second quintile 0.17 (0.03)*** 0.25 (0.03)*** 0.29 (0.04)*** ,.0001
Third quintile 0.10 (0.03)*** 0.17 (0.03)*** 0.20 (0.03)*** .001
Fourth quintile 0.06 (0.02)** 0.13 (0.02)*** 0.16 (0.03)*** .001
Fifth quintile (highest) Reference Reference Reference
Between-person variability 0.32 (0.01)***
Residual variance 0.53 (0.01)***
***P#.0001; **P#.01; *P#.05.
aChild behavior was measured by the ITSC (9 and 24 mo) and the Preschool and Kindergarten Behavior Scales-2nd Edition
(ages 4 and 5). Scores were summed and standardized to population; mean = 10, SD = 1. Higher scores indicate worse behavior.bcoefficients represent the SD difference in behavior scores compared with the reference group.
bPvalue for interaction with child age.
cCD was defined by the lowest 10th percentile of the BSF-R mental scale at ages 9 and/or 24 mo, categorized as follows:
children with CD points to the need to devise behavioral interventions for chil-dren with persistent or developing CD.
We were discouraged that only 11.4% of children identified as ever having CD received EI services. Consistent with McManus and Rosenberg,20 EI service
utilization was highest among children with persistent indications of CD; even so,,25% of these children received EI services by 24 months. Rosenberg et al38reported that only 10% of
chil-dren in the ECLS-B who met criteria for Part C received EI services, and Witt et al39 estimated that only 2 in 5 US
children with disabilities and poor psy-chosocial adjustment receive mental health services. Further, developmental and behavioral disorders are under-diagnosed in primary care settings40
with only half of pediatricians using recommended screening tools41despite
American Academy of Pediatrics guide-lines.42 Together with our data, this
reflects a gap in the need for and receipt of effective EI services. Strategies to in-crease developmental screening in
pri-mary care (eg, addressing reimbursement and time and personnel limitations),43
simplifying application procedures,44
and care coordination39may promote
early identification and EI service use among children with CD; future re-search in these areas is warranted.
This study has limitations. First, our child behavior measure may be subject to recall bias. Second, in the absence of diagnostic criteria, we used a cutoff score on a one-time continuous measure to estimate the prevalence of behavior problems. The ECLS-B data set lacked information on the detection and treat-ment of children with CD, which may have influenced ourfindings. Further, our es-timated prevalence and trajectory of behavior problems may be influenced by differential dropout rates. We also limited the scope of these analyses to associations with CD, as determined by a screening tool. Future research should examine more faceted classifications of CD, as well as other critical components of infant development, including early motor skills.
CONCLUSIONS
To date, the association between early CD and the development of behavior problems has not been adequately in-vestigated in the United States. Although there have been cross-sectional7,8,16and
short-term follow-up studies,10,12,18 we
believe ours is thefirst to examine this relationship across multiple years by using a national cohort of US children. Our findings establish, on a pop-ulation-level, that disparities in be-havior problems among children with CD originate at the earliest stages of life. We also found that the timing and persistence of CD influences children’s psychosocial development. These fi nd-ings support early identification, evalu-ation, and EI service referral for children with CD.
ACKNOWLEDGMENTS
We thank Hyojun Park, Dr Stephanie Robert, Dr John Mullahy, and Dr Bridget B. Catlin for their invaluable as-sistance during the preparation of this article.
REFERENCES
1. Einfeld SL, Piccinin AM, Mackinnon A, et al. Psychopathology in young people with intellec-tual disability.JAMA. 2006;296(16):1981–1989 2. Einfeld SL, Ellis LA, Emerson E. Comorbidity of
intellectual disability and mental disorder in
children and adolescents: a systematic review. J Intellect Dev Disabil. 2011;36(2):137–143 3. Crnic K, Hoffman C, Gaze C, Edelbrock C.
Un-derstanding the emergence of behavior prob-lems in young children with developmental delays.Infants Young Child. 2004;17(3):223–235 4. Cadman D, Boyle M, Szatmari P, Offord DR. Chronic illness, disability, and mental and
social well-being:findings of the Ontario Child Health Study.Pediatrics. 1987;79(5):805–813 5. Oeseburg B, Dijkstra GJ, Groothoff JW, Reijneveld
SA, Jansen DEMC. Prevalence of chronic health conditions in children with intellectual disability: a systematic literature review. Intellect Dev Disabil. 2011;49(2):59–85
6. Totsika V, Hastings RP, Emerson E, Lancaster GA, Berridge DM. A population-based
in-vestigation of behavioural and emotional
problems and maternal mental health: associations with autism spectrum disorder
and intellectual disability. J Child Psychol Psychiatry. 2011;52(1):91–99
7. Baker BL, Blacher J, Crnic KA, Edelbrock C. Behavior problems and parenting stress in families of three-year-old children with and
without developmental delays.Am J Ment Retard. 2002;107(6):433–444
8. Merrell KW, Holland ML. Social-emotional behavior of preschool-age children with and without developmental delays.Res Dev
Disabil. 1997;18(6):393–405
9. Einfeld SL, Ellis LA, Doran CM, et al.
Be-havior problems increase costs of care of children with intellectual disabilities. Journal of Mental Health Research in
In-tellectual Disabilities.2010;3(4):202–209 10. Baker BL, McIntyre LL, Blacher J, Crnic K,
Edelbrock C, Low C. Pre-school children with and without developmental delay: behaviour problems and parenting stress over time.J
Intellect Disabil Res. 2003;47(pt 4–5):217–230
11. Baker BL, Neece CL, Fenning RM, Crnic KA, Blacher J. Mental disorders infive-year-old children with or without developmental
delay: focus on ADHD.J Clin Child Adolesc Psychol. 2010;39(4):492–505
12. Feldman MA, Hancock CL, Rielly N, Minnes P, Cairns C. Behavior problems in young children with or at risk for developmental delay.J Child Fam Stud. 2000;9(2):247–261 13. Plomin R, Price TS, Eley TC, Dale PS, Stevenson J. Associations between behaviour problems and verbal and nonverbal cognitive abilities
and disabilities in early childhood. J Child Psychol Psychiatry. 2002;43(5):619–633 14. de Ruiter KP, Dekker MC, Verhulst FC, Koot HM.
Developmental course of psychopathology in youths with and without intellectual disabilities. J Child Psychol Psychiatry. 2007;48(5):498–507 15. Emerson E, Hatton C. Mental health of children
and adolescents with intellectual disabilities in Britain.Br J Psychiatry. 2007;191(6):493–499 16. Emerson E, Einfeld S. Emotional and
without developmental delay: a bi-national perspective. J Child Psychol Psychiatry. 2010;51(5):583–593
17. McIntyre LL, Blacher J, Baker BL. Behaviour/ mental health problems in young adults with intellectual disability: the impact on families. J Intellect Disabil Res. 2002;46(pt 3):239–249 18. Niccols A, Feldman M. Maternal sensitivity and behaviour problems in young children with developmental delay.Infant Child Dev. 2006;15(5):543–554
19. Halfon N, Houtrow A, Larson K, Newacheck PW. The changing landscape of disability in childhood.Future Child. 2012;22(1):13–42 20. McManus BM, Rosenberg SA. Does the
persistence of development delay predict receipt of early intervention services?Acad Pediatr. 2012;12(6):546–550
21. Early Childhood Longitudinal Study, Birth Cohort, Nine-Month Data Collection. Wash-ington, DC: US Department of Education, Na-tional Center For Education Statistics; 2001
22. Snow K, Derecho A, Wheeless S, et al.Early Childhood Longitudinal Study, Birth Cohort (ECLS-B), Kindergarten 2006 and 2007 Data File User’s Manual (2010-010). Washington, DC: National Center for Education Statistics, Institute of Education Sciences, US De-partment of Education; 2009
23. Bayley N. Bayley Scales of Infant De-velopment, 2nd ed. San Antonio, TX: The Psychological Corporation; 1993
24. Andreassen C, Fletcher P.Early Childhood Longitudinal Study, Birth Cohort (ECLS–B) Psychometric Report for the 2-Year Data Collection (NCES 2007–084). Washington, DC: National Center for Education Statistics, Institute of Education Sciences, US De-partment of Education; 2007
25. Dale PS, Price TS, Bishop DVM, Plomin R. Outcomes of early language delay: I.
Pre-dicting persistent and transient language difficulties at 3 and 4 years.J Speech Lang Hear Res. 2003;46(3):544–560
26. Hillemeier MM, Farkas G, Morgan PL, Martin MA, Maczuga SA. Disparities in the prevalence of cognitive delay: how early do they appear? Paediatr Perinat Epidemiol. 2009;23(3):186–198 27. Cheng ER, Poehlmann J, Mullahy J, Witt WP. Cumulative social risk exposure, infant birth weight, and cognitive delay in infancy. Acad Pediatr. 2014; (in press)
28. Witt WP, Gottlieb CA, Hampton J, Litzelman K. The impact of childhood activity limi-tations on parental health, mental health, and workdays lost in the United States. Acad Pediatr. 2009;9(4):263–269
29. DeGangi G, Poisson S, Sickel R, Weirner A. Infant/Toddler Symptom Checklist: A Screen-ing Tool for Parents. Tuscon, AZ: Therapy Skills Builders; 1995
30. Merrell KW. Social-emotional assessment in early childhood.J Early Interv. 1996;20(2): 132–145
31. Early Childhood Longitudinal Study, Birth Cohort, 2-Year Data Collection. Washington, DC: US Department of Education, National Center for Education Statistics; 2003–2004 32. Raudenbush SW, Bryk AS.Hierarchical Lin-ear Models: Applications and Data Analysis Methods, 2nd ed. Newbury Park, CA: Sage Publications; 2002
33. Palta M.Principles in Dealing With Correlated Data. Quantitative Methods in Population Health: Extensions of Ordinary Regression. Hoboken, NJ: John Wiley & Sons, Inc; 2003:120–135 34. Cohen J.Statistical Power Analysis for the
Behavioral Sciences. Florence, KY: Psychol-ogy Press; 1988
35. Dykens EM. Psychopathology in children with intellectual disability.J Child Psychol Psychiatry. 2000;41(4):407–417
36. Eisenhower AS, Baker BL, Blacher J. Pre-school children with intellectual disability: syndrome specificity, behaviour problems, and maternal well-being.J Intellect Disabil Res. 2005;49(pt 9):657–671
37. Reiss F. Socioeconomic inequalities and mental health problems in children and adolescents: a systematic review.Soc Sci Med. 2013;90:24–31
38. Rosenberg SA, Zhang D, Robinson CC. Preva-lence of developmental delays and participation in early intervention services for young chil-dren.Pediatrics. 2008;121(6). Available at: www. pediatrics.org/cgi/content/full/126/6/e1503
39. Witt WP, Kasper JD, Riley AW. Mental health services use among school-aged children with disabilities: the role of sociodemo-graphics, functional limitations, family burdens, and care coordination. Health Serv Res. 2003;38(6 pt 1):1441–1466 40. Sheldrick RC, Merchant S, Perrin EC.
Identi-fication of developmental-behavioral prob-lems in primary care: a systematic review. Pediatrics. 2011;128(2):356–363
41. Radecki L, Sand-Loud N, O’Connor KG, Sharp S, Olson LM. Trends in the use of stan-dardized tools for developmental screening in early childhood: 2002-2009. Pediatrics. 2011;128(1):14–19
42. Developmental surveillance and screening of infants and young children. Pediatrics. 2001;108(1):192–196
43. Halfon N, Regalado M, McLearn KT, Kuo AA, Wright K.Building a Bridge from Birth to School: Improving Developmental and Be-havioral Health Services for Young Chil-dren. New York, NY: The Commonwealth Fund; 2003
44. Szilagyi PG. Health insurance and children with disabilities. Future Child. 2012;22(1): 123–148
(Continued fromfirst page)
www.pediatrics.org/cgi/doi/10.1542/peds.2014-0259
doi:10.1542/peds.2014-0259
Accepted for publication Jun 12, 2014
Address correspondence to Erika Rose Cheng, PhD, MPA, Postdoctoral Fellow, Harvard Medical School, Division of General Academic Pediatrics, Center for Child and Adolescent Health Research and Policy, Massachusetts General Hospital for Children, 100 Cambridge St, 1570-B5, Boston, MA 02114. E-mail: [email protected]. edu
PEDIATRICS (ISSN Numbers: Print, 0031-4005; Online, 1098-4275).
Copyright © 2014 by the American Academy of Pediatrics
FINANCIAL DISCLOSURE:The authors have indicated they have nofinancial relationships relevant to this article to disclose.
FUNDING:Supported by a Science and Medicine Graduate Research Scholars Fellowship from the University of Wisconsin in the College of Agriculture and Life Sciences and the School of Medicine and Public Health, and a dissertation grant from The New York Community Trust, Fahs-Beck Fund for Research and Experimentation, awarded to Dr Cheng. Dr Cheng was additionally supported by a grant from theEunice Kennedy ShriverNational Institute of Child Health and Human Development (NICHD) Research Training in Prevention and Care of Chronic Illness in Childhood (T32HD075727-01; PI: JA Finkelstein).
DOI: 10.1542/peds.2014-0259 originally published online August 11, 2014;
2014;134;e749
Pediatrics
Witt
Erika Rose Cheng, Mari Palta, Milton Kotelchuck, Julie Poehlmann and Whitney P.
Cognitive Delay and Behavior Problems Prior to School Age
Services
Updated Information &
http://pediatrics.aappublications.org/content/134/3/e749 including high resolution figures, can be found at:
References
http://pediatrics.aappublications.org/content/134/3/e749#BIBL This article cites 32 articles, 5 of which you can access for free at:
Subspecialty Collections
rning_disorders_sub
http://www.aappublications.org/cgi/collection/cognition:language:lea Cognition/Language/Learning Disorders
al_issues_sub
http://www.aappublications.org/cgi/collection/development:behavior Developmental/Behavioral Pediatrics
following collection(s):
This article, along with others on similar topics, appears in the
Permissions & Licensing
http://www.aappublications.org/site/misc/Permissions.xhtml in its entirety can be found online at:
Information about reproducing this article in parts (figures, tables) or
Reprints
DOI: 10.1542/peds.2014-0259 originally published online August 11, 2014;
2014;134;e749
Pediatrics
Witt
http://pediatrics.aappublications.org/content/134/3/e749
located on the World Wide Web at:
The online version of this article, along with updated information and services, is
by the American Academy of Pediatrics. All rights reserved. Print ISSN: 1073-0397.