Nat. Hazards Earth Syst. Sci., 12, 97–106, 2012 www.nat-hazards-earth-syst-sci.net/12/97/2012/ doi:10.5194/nhess-12-97-2012
© Author(s) 2012. CC Attribution 3.0 License.
Natural Hazards
and Earth
System Sciences
Efficient dam break flood simulation methods for developing a
preliminary evacuation plan after the Wenchuan Earthquake
Y. Li1,2, J. H. Gong1,2, J. Zhu3, L. Ye1, Y. Q. Song4, and Y. J. Yue5
1State Key Laboratory of Remote Sensing Science, Institute of Remote Sensing Applications, Chinese Academy of Sciences,
Beijing 100101, China
2Zhejiang-CAS Application Center for Geoinformatics, ZheJiang 314100, China 3Southwest-jiaotong University, Chengdu 610031, China
4College of Urban and Environmental Science, Tianjin Normal University, Tianjin 300387, China 5Research Center for Eco-Environmental Sciences, Chinese Academy of Sciences, Beijing 100185, China Correspondence to: J. H. Gong ([email protected])
Received: 14 September 2011 – Revised: 25 November 2011 – Accepted: 28 November 2011 – Published: 11 January 2012
Abstract. The Xiaojiaqiao barrier lake, which was the sec-ond largest barrier lake formed by the Wenchuan Earthquake had seriously threatened the lives and property of the popula-tion downstream. The lake was finally dredged successfully on 7 June 2008. Because of the limited time available to conduct an inundation potential analysis and make an evacu-ation plan, barrier lake informevacu-ation extraction and real-time dam break flood simulation should be carried out quickly, integrating remote sensing and geographic information sys-tem (GIS) techniques with hydrologic/hydraulic analysis. In this paper, a technical framework and several key techniques for this real-time preliminary evacuation planning are intro-duced. An object-oriented method was used to extract hy-drological information on the barrier lake from unmanned aerial vehicle (UAV) remote sensing images. The real-time flood routine was calculated by using shallow-water equa-tions, which were solved by means of a finite volume scheme on multiblock structured grids. The results of the hydraulic computations are visualized and analyzed in a 3-D geo-graphic information system for inundation potential analy-sis, and an emergency response plan is made. The results show that if either a full-break or a half-break situation had occurred for the Chapinghe barrier lake on 19 May 2008, then the Xiaoba Town region and the Sangzao Town region would have been affected, but the downstream towns would have been less influenced. Preliminary evacuation plans un-der different dam break situations can be effectively made using these methods.
1 Introduction
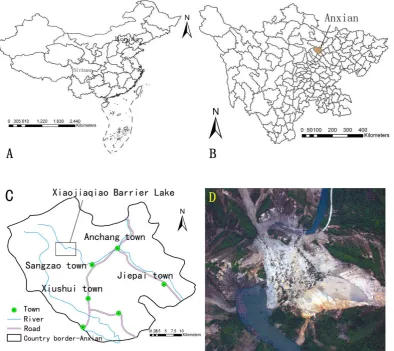
Fig. 1. Location of the study area: (a) Map of China, in which the annotated area is Sichuan province. (b) Map of Sichuan, in which the
annotated area is Anxian. (c) Map of Anxian, in which the annotated area is the Xiaojiaqiao barrier lake. (d) A UAV photo of the Xiaojiaqiao barrier lake.
spatial resolution in cloudy weather. The technology of un-manned aerial vehicle (UAV) remote sensing can quickly de-tect changes in disaster information at the mesoscale without the effect of bad or cloudy weather and with a spatial reso-lution of at least 0.2 m (Li et al., 2009). The UAV played a crucial role in the Wenchuan Earthquake relief operations.
Although UAV remote sensing techniques can conve-niently acquire information about a barrier lake in a timely manner, they are insufficient for providing on their own all of the dynamic information about a key dammed lake. Over the last few decades, the application of GIS (geographic in-formation system) in flood risk mapping has proven to be a valuable tool for visualization, modeling and predictions (Sarkkila, 2001; Longley et al., 2006; Evans et al., 2007; Stanchev et al., 2009). In 3-D GIS, when UAV images are overlayed with high-resolution DEM data, a rich set of the-matic flood data can be extracted and explored. A 3-D dy-namic dam break flood simulation can be carried out under the support of various hydraulic and hydrological modeling
techniques to efficiently assist decision-making and evacua-tion plans. Today, there is a consensus that GIS tools, which can integrate remote-sensing techniques with hydrological and geomorphologic parameters, provide a good platform to combine, manipulate, and analyze information for the rapid and efficient determination of potential flood areas (Youssef et al., 2011). However, few works describe the efficient col-laboration between high-resolution remote sensing informa-tion extracinforma-tion techniques and 3-D virtual flood routine cal-culations and simulation techniques.
Y. Li et al.: Efficient dam break flood simulation methods for developing a preliminary evacuation plan 99
13
Figure 2.
UAV images
Data preprocessing
IKONOS/ CBERS2B HR/
SPOT5
Thematic data (population/
traffic/ household) Image correction\Image mosaic\Image Interpretation Geographic projections and transformations\Resolution consistent
Land cover map Roughness coefficients
Barrier Lake information extraction Dam break flux curve
1:10000 paper relief map
DEM
Hydraulic Parameter
extraction
Overland flood
routine simulation
finite-difference solution
Evacuation
plan making
Spatial and temporal
unit Hydraulic boundary definition Simulation of different situations in 3D GIS Software environment Inundation
area
Inundation
intensity Population
Traffic roads
Residential area
Fig. 2. Technical framework for dam break flood simulation and
preliminary planning.
downstream residents of the Tangjiashan barrier lake. How-ever, these evacuation plans were primarily made qualita-tively or half-quantitaqualita-tively, and they lack the scientific sup-port of dam-burst flood routine simulation. In this paper, an efficient flood simulation and hazard evaluation technique framework that combines high-resolution remote sensing, GIS, virtual reality and hydrological models is presented. Several key techniques are introduced, such as an object-oriented classification method for hydrological information extraction, a dam break flow calculation method, and the cal-culation and simulation of flood routine procedures. All of these techniques worked well in the case study of the Xiao-jiaqiao barrier lake, and a preliminary evacuation plan was developed.
2 Site description and technical framework
An’xian County is located in the southwest of Mianyang City, Sichuan Province, China, between 31◦200N∼31◦500N and 104◦000E∼104◦450E, with an area of 1404 km2. The Xiaojiaqiao dammed lake was located at the upstream of the Chaping River in An’xian County (Fig. 1), and its catch-ment area was approximately 154.81 km2. This lake was the second largest dammed lake formed in the Wenchuan Earth-quake. Because the dam body was made of detritus, it was an
14
Figure 3.
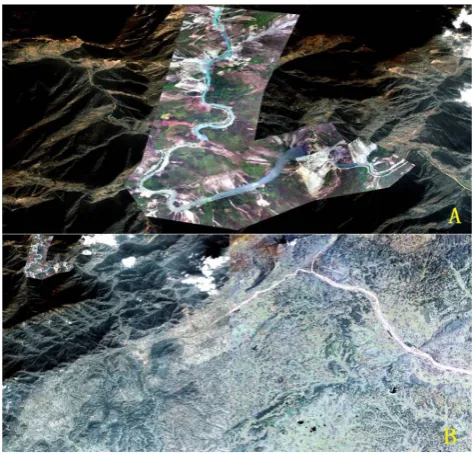
Fig. 3. (a) The UAV remote sensing image after the mosaic. (b) The
IKONOS image.
extremely dangerous dammed lake. As reported by the local water authority, the failure of the Xiaojiaqiao dammed lake would have affected 6 towns (Xiaoba, Sangzao, Anchang, Huangtu, Huahai and Jiepai), 45 villages, 7 communities and the lives of 114 000 people and their property. In addition, six key enterprises and two major traffic arteries were also threatened.
After the earthquake, UAV images with a spatial resolu-tion of 0.2 m were acquired on 19 May 2008. Multisource remote sensing images before and after the earthquake were also collected, including an IKONOS image (26 Decem-ber 2008), a SPOT-5 (10 NovemDecem-ber 2006), and a CBERS2B HR (27 June 2008). A terrain map covering the study area at a scale of 1:10 000 was collected from the Bureau of Sur-veying and Mapping of Sichuan Province. The population, residential region, road and facility data were provided by the Anxian water authority.
The technical framework for the dam break flood simula-tion and preliminary plan making is shown in Fig. 2. Multi-source remote sensing images, DEM and thematic data were coupled with GIS, remote sensing and hydraulic tools to pro-vide a good platform for flood simulation and evacuation planning.
3 Data preprocessing
15
Figure 4.
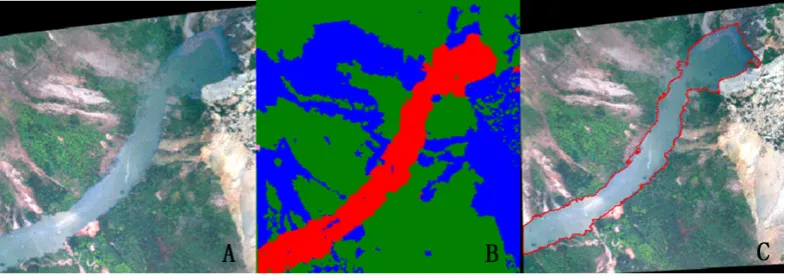
Fig. 4. The boundary extraction of the dammed lake. (a) The original UAV image. (b) The classification results of the UAV image. (c) The
extracted scope of the water region.
The UAV images have a ground resolution of 0.2 m and are obtained by using a non-metric camera. The image sequence number is sorted with strips. The locations of the photos are calculated by the index file. Because the study area is a re-gion containing hills and ravines, it was essential to remove relief displacement. Image orthorectifications for UAV im-ages are implemented using ground control points and the above generated DEM. Then, the SIFT (Scale-Invariant Fea-ture Transform) algorithm is used to find images with the same name as the point of the match between the image and the stitching.
In the geometric correction process, images are corrected to an IKONOS satellite image of 1 m spatial resolution with a geometric error of less than one pixel. The UAV remote sensing image after the mosaic (Fig. 3a) was overlapped with the IKONOS image (Fig. 3b).
Data containing geographic information on the popula-tion, the residential areas, the roads and facilities were pre-processed to obtain standard GIS vector layers, which are ready for inundation analysis.
4 Methodology
4.1 Barrier lake information extraction
UAV remote sensing images contain high-spatial-resolution information about the important targets. The traditional pixel-based remote sensing classification techniques have proven to be unsuitable for information extraction from high-spatial-resolution images. Instead, the object-oriented clas-sification method can fully explore the spectral, spatial and textural attributes of high-spatial-resolution images. This method can extract various characteristics in images, such as vehicles, buildings, roads, rivers, bridges, lakes, and fields. Thus, the object-oriented classification method was herein employed to explore the barrier lake information in the UAV images.
ENVI 4.7EX software was adopted to perform the object-oriented classification. The workflow obeys a segmentation-merge-refine-computing-attributes-classification. In this pa-per, a segmentation threshold of 60 % and a merge threshold of 99 % were adopted. The boundary of the water region could be quickly extracted from the UAV images. Figure 4a shows the original UAV image, and Fig. 4b shows the re-sulting classified UAV image. In this image, the barrier lake region is shown in red; the vegetation plot is shown in green; and the bare land is shown in blue. Figure 4c shows the ex-tracted scope of the water region.
The Xiaojiaqiao barrier lake boundary of 19 May 2008 was obtained, which is shown in Fig. 5a. We can see that points A and B are two river blocks formed by the earthquake-induced landslide and that the Xiaojiaqiao bar-rier lake is formed owing to the obstructions. The area of the extracted dammed lake was overlapped with the DEM data, and the dataset is shown in the 3-D scene (Fig. 5b). The white region represents the dammed lake. The contour line of 765 m was overlapped with the barrier lake, and the out-lines match well. The water depth of each pixel were then calculated according to the outline of the dammed lake and the DEM data. The water depth at the dam of the barrier lake (H0) was 31.5 m. The volume of the dammed lake (W) could be obtained by summing up the calculated volumes of each pixel, and result was approximately 2 800 000 m3. The out-let of the barrier lake (B) was measured by using the spatial measurement function of ArcGIS 9.2, and it was found to be approximately 133 m.
4.2 Dam break flow calculation
The extracted information about the barrier lake, which was introduced in Sect. 4.1, contains the valley width of the dam site (B), the water depth of the dam site (H0), and the volume
Y. Li et al.: Efficient dam break flood simulation methods for developing a preliminary evacuation plan 101
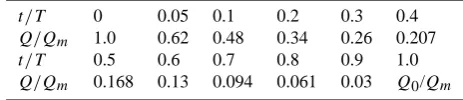
Table 1. The half-experiential data adopted.
t /T 0 0.05 0.1 0.2 0.3 0.4
Q/Qm 1.0 0.62 0.48 0.34 0.26 0.207
t /T 0.5 0.6 0.7 0.8 0.9 1.0
Q/Qm 0.168 0.13 0.094 0.061 0.03 Q0/Qm
Table 2. Flood arrival time at different locations for the Xiaojiaqiao
landslide (Unit: s).
Break Dam failure Flood arrival Flood arrival
Type duration (s) Xiaoba town Sangzao town
Full break 589 2580 4380
Half break 488 3360 6420
adopts a value equal toB. Because the downstream wa-ter was shallow before the collapse, Saint-Venant equations were adopted to calculate the instantaneous peak flow at the breach (Qm).
The calculation of the discharge process line is highly complex, and it can be simplified to four parabolas. The emp-tying time of the dammed lake (T )can be calculated from Eq. (2), whereK is the coefficient with a value equal to 4. According to the half-experiential data (Table 1) published in Technical Guidelines for emergency disposal of landslide lake (Ministry of Water Resources of China, 2009), the dis-charge process line can be obtained withQmandT as
fol-lows:
Qm=
8 27B √ gH 3 2 0 (1)
T=K W
Qm
(2) Supposing the occurrence of full-break situation, according to formulas (1) and (2), the calculation result of the peak flow at the breach (Qm) is 21 810 m3s−1, and the result
of the emptying time of the dammed lake (T ) is 589 s. If the half-break situation occurs (the upper part of the dam breaks, shown in Fig. 6a), then the calculation result ofQm
is 13264 m3s−1, and the result ofT is 488 s. The dam break flux curves for the full-break and half-break scenarios are shown in Fig. 6b.
4.3 Overland flow routing
The finite-difference solution (Liu, 1991) of the Saint-Venant equations is adopted in this study to perform downstream overland flow routing with inputs from the dam break flow calculation. The governing equations are depth-averaged continuity and dynamic wave equations. The simplified nu-merical equations are expressed as Eqs. (3)–(5).
hki++13/2,j+1,2−h k+1 i+1/2,j+1,2
21t +
Mik++12,j+1/2−M k+2 i,j+1/2
1x
+N k+2
i+1/2,j+1−N k+2i+1/2,j
1y =0 (3)
Mi,jk++21/2−Mki,j+1/2
21t =
−g(h
k+1
i+1/2,j+1/2+h k+1
i−1/2,j+1/2)(z k+1 i+1/2,j+1/2−z
k+1 i−1/2,j+1/2)
21x
−gn2i,j+1/2 u¯i,j+1/2 q
(uki,j+1/2)2+(vki,j+1/2)2
h
(hki++11/2,j+1/2+h k+1
i−1/2,j+1/2)/2
i1/3 (4)
Nik=+12/2,j−Nk i+1/2,j
21t =
−g(h
k+1
i+1/2,j+1/2+h k+1
i+1/2,j−1/2)(z k+1 i+1/2,j+1/2−z
k+1 i+1/2,j−1/2)
21y
−gn2i+1/2,j
¯
vi+1/2,j
q
(uk i+1/2,j+h
k+1 i+1/2,j−1/2)2
h
(hki++11/2,j+1/2+hki++11/2,j−1/2)/2i1/3
(5)
where µ and ν=the averaged velocity components along the x- and y-coordinates; t=time; h=water depth;
z=water line;n=roughness rate; andg=gravitational ac-celeration. M and N = the width-averaged flux along the x-and y-coordinates. That is,M=µ×h, andN=ν×h.
The dam break flux is decomposed to 2 dimensions and used as the inflow conditions. This flux changes over time af-ter the barrier lake breaks. Performing overland flow routing often requires a large amount of hydrological and geograph-ical data. Based on the DEM data with 10 m resolution, the same resolution is adopted to perform simulations. The co-ordinate and elevation of each grid was extracted from DEM data. The land-use map is acquired from the classification re-sult of the IKONOS image, and the roughness coefficients of each grid were calculated from land-use information and the table of Manning’s roughness coefficient values (Engman, 1986).
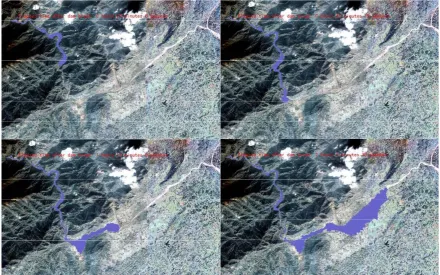
The simulation domain of overland flow routing for the Xiaojiaqiao barrier lake case was discretized with uniform grids having sizes of 10 m×10 m. There were 165 480 grids accounting for 16.55 km2of the downstream lowlands of the Xiaojiaqiao barrier lake. Under different dam failure dura-tions, Figs. 7 and 8 show the simulated results of full break and half break, respectively, for the Xiaojiaqiao barrier lake. In the full-break situation, the flood reaches the town of XiaoBa 43 min after the dam break, while it reaches Sangzao town 1 h and 13 min after the dam break. In the half-failure situation, the flood reaches XiaoBa town at 56 min and Sangzao town at 1 h and 47 min after the dam break.
16
Figure 5.
Fig. 5. (a) Boundary of the Xiaojiaqiao barrier lake on 19 May 2008. (b) The boundary of the dammed lake overlapped with a 765 m contour
line in the 3-D scene.
Table 3. Maximum inundation depths at different locations for the Xiaojiaqiao landslide (Unit: m).
Break Zongcanwusuo Xiaobaxiang Xiaobazhen Shangqing Xiangxi Sangzao
Type fulin cun cun town
Full break 14.56 7.2 6.5 3.64 1.68 0.46
Half break 6.78 2.89 3.61 0.5 0.62 0
Figure 6.
Fig. 6. (a) Half-break situation. (b) Dam break discharge process
line calculation result.
With GIS-assisted inundation potential analysis, people liv-ing downstream will know when to evacuate and where to go once a landslide dam really fails.
5 Inundation potential analysis and evacuation planning
Once the barrier lake is formed and discovered, preparations for emergency actions must be taken before a crisis occurs. An underestimated disaster will result in a great loss of lives and property, while an overestimated disaster will cause un-necessary panic and make the affected region vulnerable to chaos. Flood risk mapping is an essential element of flood risk management and risk communication (Merz, 2010). The
Table 4. Population distribution in inundation areas.
Place name Latitude Longitude Population
Guanxincun 31.595 104.318 2256
Baiguoping 31.620 104.323 861
Zhongxincun 31.587 104.326 1623
Wufucun 31.633 104.311 1573
Zhongfucun 31.630 104.332 623
Huangyangcun 31.622 104.305 1162
Lianghecun 31.599 104.286 1278
Lizhicun 31.591 104.377 1586
Yunfengcun 31.601 104.376 1640
Feilongcun 31.609 104.393 2370
Yuxicun 31.590 104.385 1130
Haishuicun 31.576 104.362 2019
Xiangxicun 31.613 104.366 1909
Shangqingcun 31.605 104.344 830
Qiniucun 31.618 104.337 845
Tongqiancun 31.653 104.350 934
Xiaobazhenfulin 31.597 104.323 313
Sangzao town 31.600 104.358 4650
Anchang town 31.642 104.419 49 333
Zongcanwusuo 31.601 104.314 Unavailable
GIS-assisted inundation potential analysis performed in this study is expected to provide a correct and accurate analysis of the inundation potential and to help people and govern-ment agencies when planning emergency response measures.
Y. Li et al.: Efficient dam break flood simulation methods for developing a preliminary evacuation plan 103
18
Figure 7.
Fig. 7. Flood routing simulation results in 3-D visualization (5.19 full break).
19
Figure 8.
Fig. 8. Flood routing simulation results in 3-D visualization (5.19 half break).
20
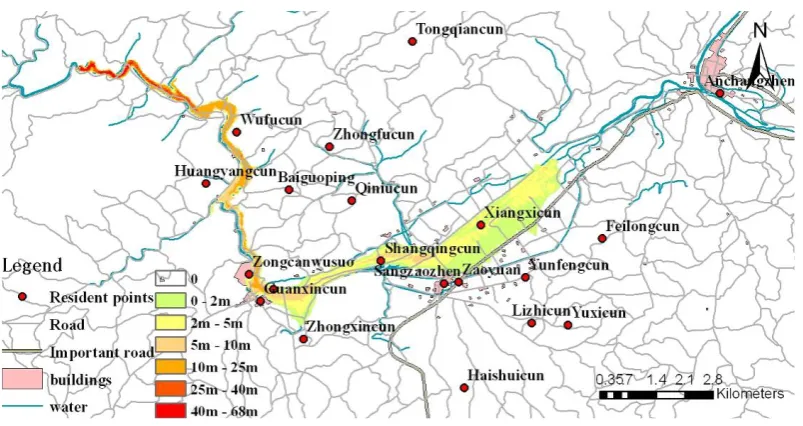
Figure 9.
Fig. 9. Flood inundation potential analysis (5.19 full break).Figure 10.
Fig. 10. Flood inundation potential analysis (5.19 half break).
Different levels of possible inundation areas can be obtained by mapping the simulation results of overland flow routing with various digital data, including streets, rivers, buildings, and counties, in different dam failure scenarios.
The maximum inundation depths at important locations are listed in Table 3. The population distribution in inun-dation areas is listed in Table 4. The depth maps, which are overlapped with elements such as population, resident re-gion, roads and facilities, are shown in Figs. 9 and 10.
It can be seen that in the full-break situation, the residential points Zongcanwusuo (the fifth research institute of general staff headquarters), Xiaobazhenfulin and Anxincun would be completely submerged, and the water depth could reach
14.56 m and 7.2 m, respectively. The villages of Shangqing-cun and XiangxiShangqing-cun are also in the inundation area, and the maximum water depth reaches 3.64 m and 1.68 m, respec-tively. The affected population exceeds 5300. In addition, the population of Zongcanwusuo is unavailable. Sangzao town and the S105 road would also be affected.
In the half-break situation, the maximum water depth at Zongcanwusuo and Xiaobazhenfulin would exceed 2.5 m, while Guanxincun would be less affected. The flood would also reach the villages of Shangqingcun and Xiangxicun, where the water depth would be 0.5 m and 0.62 m, respec-tively, while Sangzao town and the S105 road would be less affected. The affected population is near the value for the
Y. Li et al.: Efficient dam break flood simulation methods for developing a preliminary evacuation plan 105
22
Figure 11.
Fig. 11. Evacuation planning: (a) 5.19 half break (b) 5.19 full break.
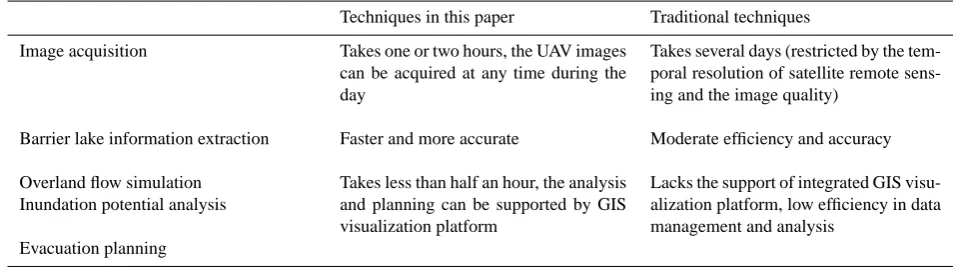
Table 5. Advantages of each step.
Techniques in this paper Traditional techniques
Image acquisition Takes one or two hours, the UAV images
can be acquired at any time during the day
Takes several days (restricted by the tem-poral resolution of satellite remote sens-ing and the image quality)
Barrier lake information extraction Faster and more accurate Moderate efficiency and accuracy
Overland flow simulation Inundation potential analysis
Takes less than half an hour, the analysis and planning can be supported by GIS visualization platform
Lacks the support of integrated GIS visu-alization platform, low efficiency in data management and analysis
Evacuation planning
full-break situation, but the extent of damage is much less because of the shallower submerged depth.
A risk buffering region (300 m) was generated with the in-undation area, and a simple evacuation plan was made ac-cording to the path layer, which is shown in Fig. 11. Fig-ure 11a shows the evacuation plan in the half-break situation, where the population in five places needs to be evacuated: Zongcanwusuo, Guanxincun, Xiaobazhenfulin, Shangqin-cun and XiangxiShangqin-cun. In the half-break situation, the near-est residential points to the 5 places are Zhongxincun and Anchang towns. The refugees would have timely access to these locations via roads and could be effectively relocated.
Figure 11b shows the evacuation plan in the full-break sit-uation. It can be seen that Zhongxincun and Anchang town are also in the risk buffering region. Thus, in this situation, the refugees need to evacuate farther away. This paper adopts path data to provide a plan for the refugees to quickly escape from the dangerous region.
6 Conclusions and discussion
The landslide-induced barrier lake, which occurs as a result of a combination of flooding and landslide, makes the ac-quisition and management of hazard information dangerous, difficult and requires multiple tasks. Today, remote-sensing information acquired and processed in real time can have a great impact in dealing with inaccessible regions. Most works adopt only remote-sensing information for qualitative or half-quantitative hazard evaluation analysis. Few works integrate remote-sensing techniques, hydrological modeling, GIS visualization and analysis to provide experts with new platforms for data management and decision-making. In the evacuation scenarios in the aftermath of Wenchuan Earth-quake, the planning lacked the scientific support of spatial information techniques.
In this study, a technical framework for dam break flood simulation and preliminary plan making is proposed that cou-ples multisource remote sensing images, DEM and thematic data with GIS, remote sensing and hydraulic tools. Using these techniques, a succession of actions, including the dam-break flood routine simulation, inundation potential analysis and evacuation planning can be effectively accomplished
with fine precision. All of these steps, from the acquisition of UAV images to the simulation and analysis of inundation potentials of the dam break, are active and performed au-tomatically. The advantages in each step are shown in Ta-ble 5. From the simulation results, the inundation depths, extent and emergency response time for the downstream res-idents were found to be greatly affected by the dam failure situation. For the sake of safety, it is necessary to make evac-uation plans for the full-break sitevac-uation.
When there is a lack of real dam-break flood routine data, the techniques in this paper provide only an evacuation plan, but the validation is difficult. Meanwhile, periodically updat-ing the DTM data is important for accurate and effective dam break simulation when there is large surface displacement caused by a destructive earthquake such as the Wenchuan earthquake. Thus, the automatic 3-D reconstruction of DTM using UAV remote-sensing images can be combined with the steps in this paper to provide much more accurate and timely information in the future.
Acknowledgements. This research is supported by the National
Natural Science Foundation of China (41101363, 40871181), the Key Knowledge Innovative Project of the Chinese Academy of Sciences 315 (KZCX2-EW-318), and the Basic Research Program of China, 973 Program, No. 2007CB714402.
Edited by: M. E. Contadakis
Reviewed by: P. Anagnostopoulos and M. Vafeiadis
References
Amini, J.: A method for generating floodplain maps using IKONOS images and DEMs, Int. J. Remote Sens., 31, 2441–2456, 2010. Bitelli, G., Camassi, R., Gusella, L., and Mognol, A.: Image change
detection on urban areas: the earthquake case. Proceedings of the 20th International Archives of the Photogrammetry, Remote Sensing and Spatial Information Sciences, 12–23 July 2004, Is-tanbul, Turkey, 692 pp., 2004.
Cheng, G. W., Wang, X. D., He, X. B., Fan, J. H., and Fan, J. R.: Outburst risk of barrier lakes in Sichuan, China, J. Mountain Sci., 5, 189–193, 2008.
Dong, J. J., Tung, Y. H., Chen, C. C., Liao, J. J., and Pan, Y. W.: Logistic regression model for predicting the failure probability of a landslide dam, Eng. Geol., 117, 52–61, 2011.
Ehrlich, D., Guo, H. D., Molch, K., Ma, J. W., and Pesaresi, M.: Identifying damage caused by the 2008 Wenchuan earthquake from VHR remote sensing data, Int. J. Digi. Earth, 2, 309–326, 2009.
Engman, E. T.: Roughness coefficients for routing surface runoff, J. Irrig. Drain. Eng, 112, 39–53, 1986.
Evans, S. Y., Gunn, N., and Williams, D.: Use of GIS in Flood Risk Mapping. National Hydrology Seminar GIS (Geographic Infor-mation Systems) in Hydrology Applications-Modelling-Data Is-sues (Tullamore, Ireland), 1–12, 2007.
Hong, Y., Adler, R., and Verdin, J.: Use of 21st century satellite remote sensing technology in natural hazard analysis, Nat. Haz-ards, 43, 165–166, 2007.
Li, Y., Gong, J. H., Hong, Y., and Song, Y. Q.: An UAV remote sensing image-supporting technique for scenes’ multi-quadtree organization and inter-source dispatch, High Technology Letters (Chinese), 19, 971–976, 2009.
Liu, L. Y., Wu, Y. H., Zuo, Z. L., Chen, Z. C., Wang, X. X., and Zhang, W. J.: Monitoring and assessment of barrier lakes formed after the Wenchuan earthquake based on multitempo-ral remote sensing data, J. Appl. Remote Sens., 3, 031665, doi:10.1117/1.3153915, 2009.
Liu, S. K., Li, X. P., Li, S. G., and Yu, T. Y.: Numerical Simulation of Flood Routing in the Xiaoqinghe Flood Plain, Adv. Water Sci., 2, 188–193, 1991.
Longley, P. A., Goodchild, M. F., Maguire, D. J., and Rhind, D. W.: Geographical Information Systems and Science, John Wiley and Sons LTD, England, 517 pp., 2006.
Merz, B., Kreibich, H., Schwarze, R., and Thieken, A.: Review article “Assessment of economic flood damage”, Nat. Hazards Earth Syst. Sci., 10, 1697–1724, doi:10.5194/nhess-10-1697-2010, 2010.
Ministry of Water Resources of China: Technical Guidelines for emergency disposal of landslide lake, SL 451-2009, available at: http://ishare.iask.sina.com.cn/f/19913587.html (last access: 11 November 2011), 2009.
Sarkkila, J.: Digital terrain modelling for flood analysis and impact assessment in emergency action planning. RESCDAM (Devel-opment of rescue actions based on dam- break flood analysis) Final Report, Appendix 6, available at: http://www.ymparisto.fi/ download.asp?contentid=12412&lan=en, 2001.
Schuster, R. L. and Costa, J. E.: A perspective on landslide dams, in: Landslide Dam: Processes Risk and Mitigation, edited by: Schuster, R. L., American Society of Civil Engineers, Geotech-nical Special Publication, 3, 1–20, 1986.
Shailesh, K. S.: Analysis of uncertainties in digital elevation models in flood modelling, MS thesis, ITC, The Netherlands, 2004. Stanchev, H., Atanas, P., and Margarita, S.: 3-D GIS Model for
Flood Risk Assessment of Varna Bay Due to Extreme Sea Level Rise, J. Coast. Res., 56, 1597–1601, 2009.
Taubenb¨ock, H., Wurm, M., Netzband, M., Zwenzner, H., Roth, A., Rahman, A., and Dech, S.: Flood risks in urbanized ar-eas – multi-sensoral approaches using remotely sensed data for risk assessment, Nat. Hazards Earth Syst. Sci., 11, 431–444, doi:10.5194/nhess-11-431-2011, 2011.
Taylor, P.: A method for generating floodplain maps using IKONOS images and DEMs, Int. J. Remote Sens., 31, 2441–2456, 2010. Youssef, A. M. and Pradhan, B.: Flash flood risk estimation along
the St. Katherine road, southern Sinai, Egypt using GIS based morphometry and satellite imagery, Environ. Earth Sci., 62, 611– 623, 2011.