A comprehensive comparative phylogenomics and demographic evolutionary history of the SARS-CoV-2
Özgül Doğana, Ertan Mahir Korkmaza*, Mahir Budaka, Battal Çıplakb, Hasan Hüseyin
Başıbüyük c
a Department of Molecular Biology and Genetics, Faculty of Science, Sivas Cumhuriyet
University, Sivas, Turkey.
bDepartment of Biology, Faculty of Science, Akdeniz University, Antalya, Turkey
c Department of Gerontology, Faculty of Health Sciences, Akdeniz University, Antalya, Turkey.
*Corresponding author
E-mail: [email protected]
ABSTRACT
A new form of beta coronavirus called severe acute respiratory disease coronavirus type 2 (SARS-CoV-2) causing a recent pandemic outbreak possesses a linear positive ss-RNA genome with a length of 29,903 nt. Here, the genomes of SARS-CoV-2 from 821 samples were characterised for its better understanding of the genomic and evolutionary patterns. The phylogeny of SARS-CoV-2 was reconstructed using concatenated dataset consisting of all
peptide encoding sequences under Bayesian Inference (BI) and Maximum Likelihood (ML) approaches. Comparison of all peptide encoding sequences reveals high divergence of amino acid sequences proportional to divergence of nucleotides, indicating that the viral genomic evolution has not been strictly neutral. The most part of the genome was under neutral evolution, however, the specific sites for peptide encoding sequences were evolved under positive selection. As well as providing reliable evidence on transmission routes of the SARS-CoV-2 outbreak, the phylogenetics and network analyses suggest the sample reported from Guangdong province is likely ancestor of the pandemic virus form. The overall substitution rate of SARS-CoV-2 genome was estimated to be 1.65 x 10⁻³ per site per year, falling within the
range for previously reported RNA viruses. Median estimation of tMRCA from Bayesian coalescent analyses corresponds to 10 September 2019. The exponential growth rate (r), doubling time (Td) and R0 were estimated to be 47.43 per year, 5.39 days and 2.72, respectively. These findings convincingly emphasise that the use of more comprehensive genome data improves robustness and also enhances understanding of the demographic history of the outbreak.
Keywords: coronavirus, origin, substitution rate, positive selection, demographic dynamics
INTRODUCTION
The world is suffering from an ecosystem crisis due to extraordinary population growth and consequent activities of human species. Human populations have experienced a period of explosive growth depending on decreases in external cause mortality during approximately last 250 years following the Industrial Revolution (1). The population of any other species does not increase so rapidly in nature like humans although it is one of the species with the longest generation time. Within the last century, the world population has increased by one billion in each 16 years on average. This continuous growth is closely related to the emergence of modern medicine, and rapid developments in the scientific discoveries which led to technological developments, a relative decrease in competition for food resources and the increased volume of trade as the main results of globalization. The growing human population has also led to anthropogenic impact on the environment promoting continuous and multiple contacts between people, domestic and wild animals. Such contacts were considered as main cause for the emergence and spread of zoonotic infectious diseases in association with crowded settlement (2). Most known examples of the emerging infectious diseases throughout and in various parts of the world include the smallpox, Spanish flu (H1N1 influenza), plague, cholera, Human Immunodeficiency Virus (HIV), hepatitis C, avian flu (H5N1 influenza), swine flu (H1N1 influenza), Severe Acute Respiratory Syndrome Coronavirus (SARS), and Ebola Virus (EBOV) (3–5).
It is known that the emergence and re-emergence of most of the zoonotic infectious diseases are resulted from viruses with RNA as their genetic material, which can rapidly adapt to varying environmental conditions owing to their exceptionally shorter generation times, high mutation rates, frequent recombination and re-assortment events creating novel genotypes from co-circulating strains (quasispecies) (3, 6). The occurrence of the high mutation rates, as high as a million times [10-2 - 10-5 per site per year (7)] greater than their hosts [2,2 x 10⁻⁹ per site per
year (8)], is considered as a beneficial trait for RNA viruses due to prominent enhancement in the ability of their virulence and evolvability. Despite these exceptionally high mutation rates, most of the mutations are expected to be swept away from viral populations via purifying and/or negative selection. On the other hand, the deterministic nature of the natural selection tends to increase the fitness of the populations favouring beneficial mutations through positive selection in time. The balance between these opposed selective forces ultimately shapes the evolution of the viral populations.
transcription processes and non-structural proteins (nsp), S gene encoding spike glycoprotein, E gene encoding envelope protein, M gene encoding membrane glycoprotein, N gene encoding nucleocapsid phosphoprotein and six ORFs encoding peptides with unknown exact functions (12).
The SARS-CoV-2 is a new strain which has rapidly distributed worldwide within approximately three months infecting millions of people. Yet, there are many unknown aspects of the virus strain which prevent to take plausible measurements and assessments for upcoming of pandemic. One aspect appears to be least concerned by healthcare professional is the past and ongoing evolution of the virus strain. This study primarily aims to estimate the evolution and evolutionary drivers of the virus using available 821 total genomes of SARS-CoV-2 which expands significantly the early findings based on limited number of samples (13, 14). Data matrices generated were subjected to appropriate bioinformatics analyses to accomplish the following specific objectives: (i) to determine the place of origin and likely origin strain based on phylogenetic trees, (ii) to estimate the time of origin and the rate of base/amino acid substitutions per individual protein encoding genes and total genome by time estimation analyses, (iii) to characterize the viral genome for base composition, rates of synonymous and nonsynonymous substitutions in connection with presence/absence of selection forces, (iv) to estimate demographic history of virus population based on possible evolutionary drivers, and (v) to determine possible synapomorphic base position states of bat coronavirus and SARS-CoV-2 using a strict phylogenetic approach. Finally, a recent evolutionary history of the virus will be discussed in the light of the results.
MATERIAL and METHODS
Construction of dataset and basic sequence statistics
A dataset of 821 samples was constructed by retrieving the complete genomes of SARS-CoV-2 representing 38 countries from GISAID (13 March SARS-CoV-20SARS-CoV-20; https://www.gisaid.org/) database. All details of the sampling dataset were presented in Table S1. Annotation of the genomes were performed using ORFFinder implemented in Geneious R9 (15) and by comparison with the reference SARS-CoV-2 genome from NCBI (NC045512). Sequences were aligned using MAFFT v7.450 (16) and manually checked by MEGA X (17). The basic sequence statistics such as nucleotide and amino acid identities, nucleotide diversity and nucleotide compositions were estimated by MEGA X.
Model selection, phylogenetic analyses and network reconstruction
under three statistical criteria (AIC, BIC, and DT). The Maximum Likelihood (ML) tree was built using RAxML v8.0.9 (20) using the GTR substitution model with gamma distribution (gamma shape: 0.507).
To deeply investigate the evolutionary relationships and origin of location of the SARS-CoV-2, a median-joining (MJ) network (21) was constructed using a total of 25 human SARS-CoV-2 samples selected from the basal placement of each clade and/or subclade of the phylogenetic tree generated here including the samples from Wuhan (China), supposed to be origin point of the outbreak (10), and bat-RaTG13-CoV was assigned as outgroup (Table S2). The analysis was performed using the whole genome dataset under the Network v.5.0.1.1 (available at http://www.fluxus-technology.com) with the default settings (ε = 0).
Estimation of mutation rates of genome and genes
The individually aligned peptide encoding sequences (10 CDS and 16 nsps synthesised from orf1ab) of SARS-CoV-2 samples were concatenated by SequenceMatrix v.1.7.8 (22). The substitution rate estimation of each peptide encoding sequences and whole genome was conducted in BEAST v1.10.4 (23) using the available dates for samples with a random starting tree on the CIPRES science gateway portal (24). As the dataset were not clock-like (likelihood ratio test: −ln+c -52308.105, −ln−c -49863.927, d.f. = 819, P = 0.0000E+000), the analyses were performed by an uncorrelated relaxed molecular clock model with a lognormal rate distribution under GTR+G model and combined with a coalescent model with an exponentially growing population [frequently preferred for viral outbreaks and suggested by A. Rambaut (http://virological.org/t/phylodynamic-analysis-176-genomes-6-mar-2020/356)]. Four independent analyses were performed using 100 million generations (sampling every 10000 generations) and then these analyses were combined after removal of the burn-in of 10 % using LogCombiner version 1.10.4. The results were assessed to show convergence and ensure effective sample sizes (ESS > 200) in Tracer v1.7. The maximum clade credibility of trees was calculated using TreeAnnotator v1.10.4 (23) after removing a 20% burn-in of the samples.
Demographic analyses
Gene-level selection analyses
To investigate the role of different selective forces in the evolution of each peptide encoding sequences of SARS-CoV-2, the nonsynonymous (dN) and synonymous (dS) substitution rates for each codon, and codons under pervasive and/or episodic positive selection were estimated using the codon-based approaches FUBAR [the Bayesian MCMC-based fast unbiased approximate Bayesian analysis; (28)] and MEME [mixed effects model of evolution; (29)] implemented in HyPhy package (30) on the DataMonkey server (http://www.datamonkey.org/dataupload.php). Significance was assessed by posterior probability > 0.95 (FUBAR) and P-value < 0.05 (MEME). The magnitude categories (conservative, moderate, and radical) and physicochemical properties of the positively selected sites detected in the result of FUBAR and MEME were identified using the modified MM01 model implemented in TreeSAAP v3.2 (31). Eight categories (1-8) were used to represent the magnitude of substitutions, by setting a sliding window of 20 codons and analysing the properties of 31 amino acids (32). Significant positive z-scores (P < 0.001) were accepted as a signal of significant change in function and/or structure.
Comparative distribution of synapomorphies
The molecular synapomorphic changes that define the clades (or branches) of human SARS-CoV-2 and bat-RaTG13-CoV were investigated by generating a new RAxML tree using randomly chosen SARS-CoV-2 genomes of 25 humans and five coronavirus samples [bat-RaTG13-CoV, two pangolin coronavirus (EPI_ISL_410538, _410721) and two SARS-CoV (AY274119, NC004718)] (see Table S3 for sampling). The sequence data and the ML tree file were imported into PAUP 4.0b10 (33). After defining outgroups and selecting maximum parsimony optimality criterion (parsimony settings; character state optimization: DELTRAN), the logfile option was activated (File: ‘Log Output to Disk’). Sequence data was then used to obtain a labelled tree reconstruction and a complete list of synapomorphies (Trees: ‘Describe Trees’ with ‘phylogram’, ‘labelled internal nodes’, and ‘list of synapomorphies’). The resulting logfile listed all synapomorphies of the dataset. The synapomorphic changes were screened and comparatively analysed in terms of total numbers, positions and substitution types (transitions and transversions) across the genome.
RESULTS and DISCUSSION
Basic sequence statistics
sequences of human SARS-CoV-2 was 29,238 nt (without outgroups), of which 832 sites were variable. Of these variable sites 232 were parsimony informative while 600 were singleton
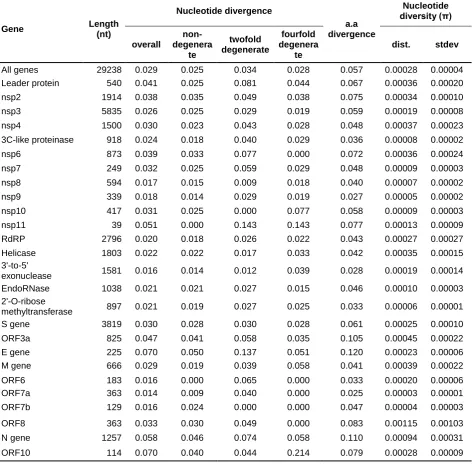
mutations. Divergence indices for both nucleotide (29,238 nt) and amino acid sequences of concatenated dataset (9746 aa) on average were 0.029 and 0.057, respectively (Table 1). Divergences for each gene were also in low levels ranging from 0.014 (nt div.) and 0.025 (aa div.) in orf7a to 0.070 (nt div.) and 0.120 (aa div.) in E gene. Comparison of all peptide encoding sequences revealed that divergences of amino acid sequences were always higher, proportional to that of nucleotide sequences (Table 1). The greater amino acid divergences were mainly resulted from the high incidence of nucleotide substitutions at non-degenerate and twofold degenerate sites (Table 1), indicating that the viral genome may not be experiencing strictly neutral evolution. If the viral genome has been subjected to the strictly neutral evolution, purifying selection would intensively act on substitutions at non-degenerate sites (35). Additionally, compatible with the recent expansion and relatively short history of the virus, the low nucleotide diversity (π) values were observed in each peptide encoding sequences, ranging from 0.00005 in nsp9 to 0.00115 in orf8, with an average of 0.00028 overall mean nucleotide diversity (Table 1).
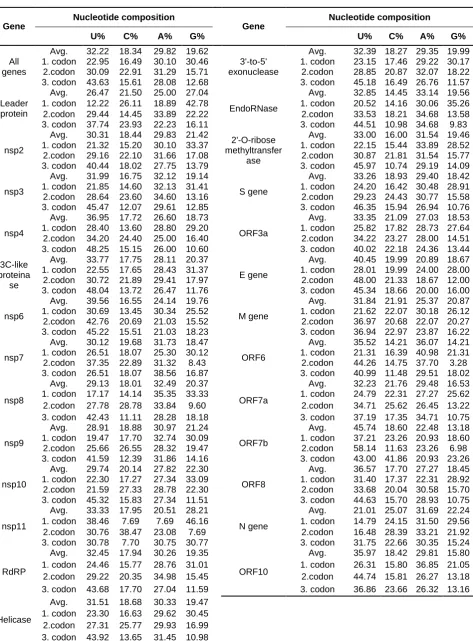
Similar to the previously reported human coronaviruses, SARS-CoV-2 genomes displayed several general patterns in terms of nucleotide composition: preference of (i) U (32.22%) over C (18.34%); (ii) A (29.82%) over G (19.62%); (iii) pyrimidines (50.6%) over purines (49.4%) (Table 2). However, when the codon positions of peptide encoding sequences were analysed separately, a codon bias towards C and G were observed in the first and/or second codon positions of some peptide encoding sequences (Table 2), most probably resulting from the differences between codon preferences.
Phylogeny of SARS-CoV-2
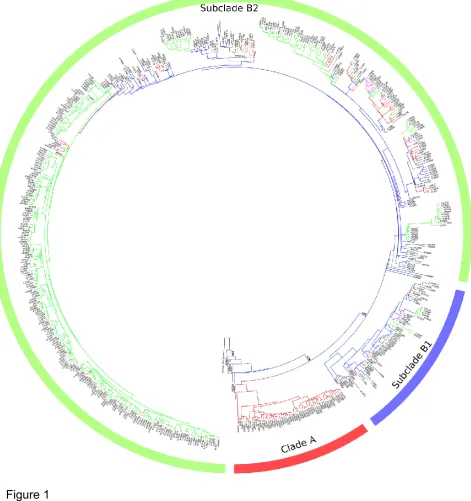
The phylogeny of SARS–CoV-2 was constructed using the concatenated dataset consisting of all peptide encoding sequences (29,238 nt) by both ML under RAxML and Bayesian Inference (BI) under BEAST. The phylogenetic analyses have recovered trees with almost the same
topologies. However, the tree generated under BI approach was more resolved and with higher
node supports, therefore, presented and discussed here (Fig. 1). The phylogeny and network
analyses provided reliable evidence on transmission routes of the SARS–CoV-2 outbreak. The
most basally placed samples were EPI_ISL_413892, _413865, _413855 and _413862 from
Guangdong, a southern coastal province of China. The following basally placed samples were
(i) the sample from Snohomish County (WA, USA) (EPI_ISL_404895) and this was the first
recorded genome/casefrom US (19 January 2020, Providence Regional Medical Center); (ii) the samples from the provinces of Chongqing (EPI_ISL_408478) and Henan
main clades with high support [posterior probability (PP)=1.00] which are denoted clade A and
clade B (Fig. 1). The clade A consisted of samples solely from North America. The clade B
comprising the rest of samples and subdivided into two well-structured subclades (PP=1.00;
Fig. 1), namely “subclade B1” and “subclade B2”. The subclade B1 is the most basal one
including samples mainly from China, as well as from other Asian countries, Australia and
Europe providing information on the first transmission routes of the SARS-CoV-2. The
subclade B2 consisting of samples worldwide indicated event of multiple independent
transmissions from China. The samples from Europe formed the most recent crown cluster of
this subclade. The phylogenetic tree was also largely in congruence with the recently published
by Forster et al. (36) and Bai et al. (37), but provided further insights by including higher number
of samples, some from previously unsampled countries.
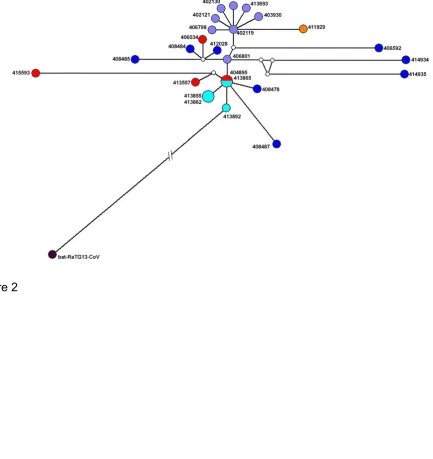
The MJ network revealed that the outgroup bat-RaTG13-CoV sample was connected to the
sample from Guangdong (EPI_ISL_413892) with 1132 mutations, which has basal placement
also in the phylogenetic tree (Fig. 2). Although Wuhan has widely cited as the origin of outbreak
[e.g. (38, 39)],herethe sample from Guangdong were consistently recovered as ancestral in both network and phylogenetic analyses. The previous phylogenetic reconstructions either not
included the Guangdong’s samples (10) or produced outgroup constrained trees assigning Wuhan’s samples as reference taxon [e.g. (36, 40)]. The bat-RaTG13-CoV genome has been regarded as the most recent ancestor of SARS-CoV-2 with the similarity of an average of 96.2% (10), however, the occurrence of more than 1000 mutations supports the assumption
on presumed unknown intermediate host(s) (41). Malayan pangolin was suggested as a potential intermediate host and a recombination event was proposed between pangolin-CoV-like virus and a bat-CoV-RaTG13-pangolin-CoV-like virus for the origin of SARS-CoV-2 (42). The putative ancestral form can be distinguished from the samples of USA (EPI_ISL_404895) and
Guangdong (EPI_ISL_413865) with the occurrence of two mutations in S gene: the
nonsynonymous mutation U21619C changing a leucine to a serine and the synonymous
mutation U24290C. The other samples with basal placements in the tree (EPI_ISL_413855,
_408478, _408487) was also found to be derived from these samples in the network. Similar
to the phylogenetic inference, the network indicated an evidence of two evolutionary
transmission paths (Fig. 2): (i) from EPI_ISL_413557 (USA) to EPI_ISL_415593 (USA)
corresponding to basal samples of the clade A with occurrence of two nonsynonymous
mutations in the sequence encoding helicase (C17654U replacing a proline to a leucine and
A17765G replacing a tyrosine to a cysteine); (ii) from _406801 (Wuhan) to the samples forming
the Clade B with occurrence of one synonymous mutation U17967C in the sequence encoding
3'- to- 5' exonuclease.
Estimation of viral mutation rates has crucial importance for tracing evolutionary paths of the
virus, and assessing various strategies for developing possible vaccines, antibodies and/or
drugs (43, 44). Determination of the changes in the mutation rate and mutational spectra can
also help deeply understand alterations in viral fitness and virulence, and effects of the host
immune system on some virus genotypes (45). The precise mutation rate therefore should be
estimated in both genome and gene levels using comprehensive sampling throughout the
distribution range of viral infection. The genomic SARS-CoV-2 substitution rate was estimated
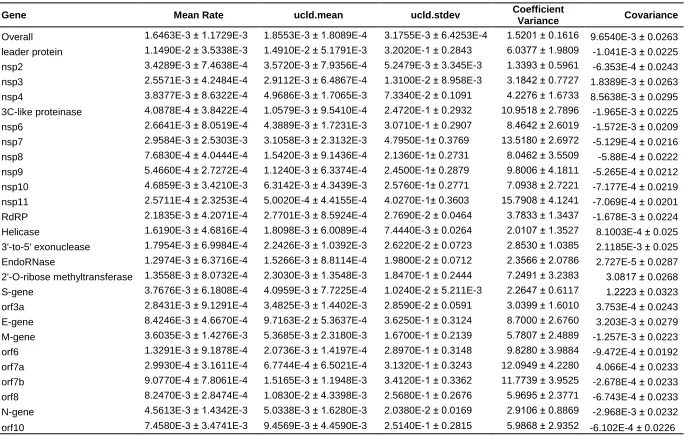
to be 1.65 x 10⁻³ per site per year (s/s/y) (95% HPD = 1.44 – 1.88 x 10⁻³) (Table 3) appears to
fall within the range previously reported RNA viruses (7). This rate is also moderate when
compared to that of other reported coronaviruses (44), but intermedaite to the rates specificic
for SARS-CoV-2, lower than that of Giovanetti et al. (13) and Benvenuto et al. (14) (6.58 × 10
-3 s/s/y), higher than reported by A. Rambaut (http://virological.org/t/phylodynamic-analysis-176-genomes-6-mar-2020/356) (0.80 x 10⁻³ s/s/y) and fall in to range reported by Bai et al. (37) (95% HPD = 1.42 x 10⁻³ - 1.80 x 10⁻³). The estimated substitution rate implied the occurrence
of 4 (3.5 to 4.6) new mutations per month in the SARS-CoV-2 genomes. However, the
estimated substitution rates of peptide encoding sequences of SARS-CoV-2 exhibited
considerable variation, ranging between 9.08 x 10⁻⁴ s/s/y (95% HPD = 3.22 x 10⁻⁵ - 2.40 x 10 -3) in orf7b and 1.15 x 10⁻² s/s/y (95% HPD = 5.11 x 10⁻³ – 1.88 x 10⁻²) in leader protein (Table
3). The sequences encoding structural proteins displayed higher substitution rates than overall
genome, varying from 3.60 x 10⁻³ in M gene to 8.42 x 10⁻³ in E gene (Table 3).
Demographic dynamics of the outbreak of SARS-CoV-2
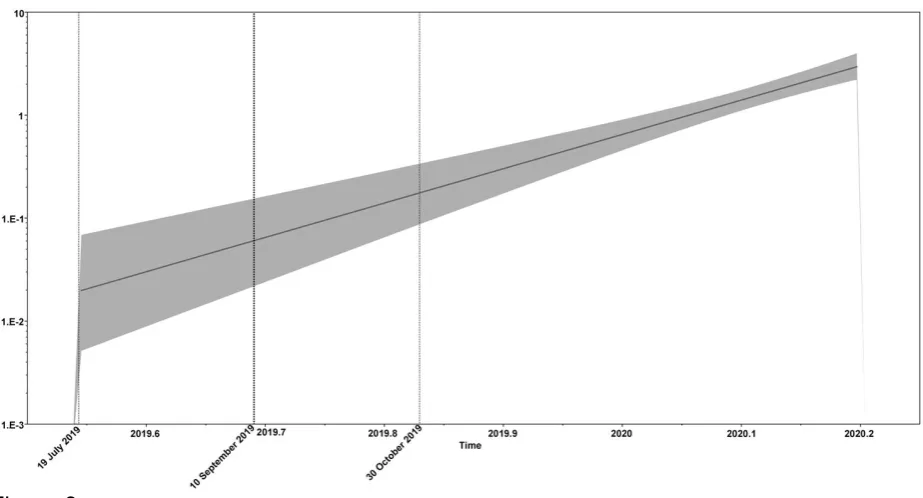
Median estimation of tMRCA from Bayesian coalescent analyses was found as 2019.69 (95% HPD = 2019.54 – 2019.83), corresponding to 10 September 2019 (95% HPD: 19 July 2019 – 30 October 2019) (Fig. 3). The estimated date was not consistent with the date of first reported case of SARS-CoV-2 (46). The tMRCA date was estimated to be middle of November by A. Rambaut based on only 86 genomes, whereas late September by Bai et al. (37) based on 622 genomes. Independent from any epidemiological information, the exponential growth rate (r) from demographic analyses of the genome data were inferred as 47.43 per year (95% HPD = 36.72 – 66.88 per year). Based on the growth rate, the Td of the virus was calculated as 5.39 days (95% HPD = 3.82 – 6.96 days), which is shorter than the rate reported by A. Rambaut (7.2 days). The calculated Td was consistent with the previously reported epidemic doubling times, ranging between 5.0 days (47) and 7.5 days (48). The R0 was estimated to be 2.72 (2.33 - 3.43), was mostly in the similar order of magnitude with the reported estimations (11 and references therein),however, higher R0estimations have also been reported (49, 50).
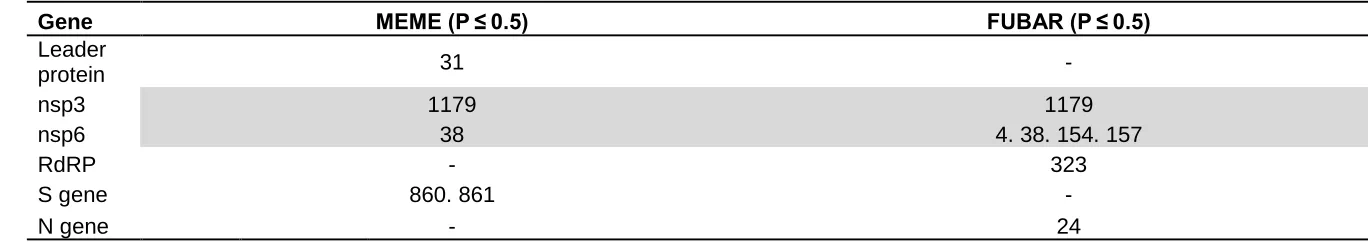
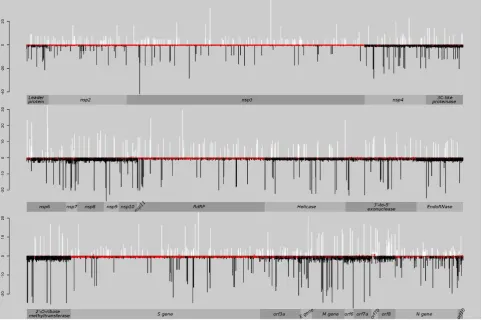
Genomic regions under positive and purifying selection or neutral evolution were visualised estimating the magnitude of dN - dS (Fig. 4). Although the most part of the genome was under purifying selection (dN<dS), the specific sites for peptide encoding sequences were found to be under positive selection (dN>dS) with significant statistical support (Fig. 4, Table 4). Five
sites were detected under episodic positive selection in four peptide encoding sequences by MEME, while only seven sites were found as under pervasive positive selection in four peptide encoding sequences by FUBAR (Table 4). Only two codons in two different peptide encoding sequences (nsp3 and nsp6) were found as positively selected in both approaches, therefore, the TreeSAAP analyses focused only on these two codons. The first one was codon 1179 in the nucleic acid-binding region (NAB) of the replicase protein nsp3, leading to a replacement
between alanine and valine. The positive selection at this codon was reported for the first time.
This codon was coding threonine in pangolin CoV and serine in BetaCoV England 1.
Considering the multiple interactions of NAB with other non-structural proteins such as nsp2,
nsp5, orf3a as well as other domains of nsp3 (51), this substitution seems to be significant due
to altering both chemical [long-range non-bonded energy (EI), polar requirement (Pr), polarity
(p) and solvent accessible reduction ratio (Rα)] and structural [beta structure tendency (Pβ), average number of surrounding residues (Ns)] properties of the relevant protein (Table 4). The
second one was codon 38 in the replicase protein nsp6, locating at the endoplasmic reticulum (ER) and generating autophagosomes (52), with the substitution of leucine to phenylalanine
and indicating a signal of structural change altering the property of Pβ of the protein. The substitution in this codon was also reported by Benvenuto et al. (53) and it seems to be variable
in other coronaviruses as valine, isoleucine and leucine (52).
Comparison of synapomorphies between bat coronavirus and SARS-CoV-2
The phylogenetic tree constructed to identify synapomorphies and list of synapomorphic
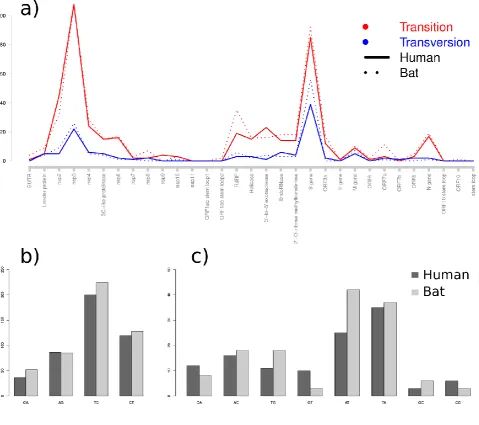
characters were shown in Figure S1 and Table S4, respectively.The ratio of synapomorphic characters to the total number of characters at the branch leading to bat-RaTG13-CoV (2.09%) was relatively similar to that of the branch leading to SARS-COV-2 (1.88%). The proportions
of transitional substitutions (78.4% in bat-RaTG13-CoV and 78.9% in SARS-COV-2) within these synapomorphic characters were apparently higher than transversions (21.6% in bat-RaTG13-CoV and 21.1% in SARS-COV-2) at both branches. Although transitions and transversions dispersed similarly throughout the genomes (Fig. 5a), the distribution of
transition- and transversion-types exhibited differences (Fig. 5b and 5c). Remarkably, A to G
and U to C transitions were observed in high frequencies of 63.03% in bat-RaTG13-CoV and 64.87% in SARS-CoV-2 on average of total transitions (Fig. 5b). The excessive number of
thermodynamically in favour of hypoxanthine cytosine matches, is also known to be a
commonly observed pattern in retroviral and other RNA genomes (54).
CONCLUDING REMARKS
In the present study, a more comprehensive dataset was utilised than the datasets previously published (86 genomes in A. Rambaut; 622 genomes in Bai et al. (37); and 821 genomes in present study). Although some of the analyses presented here partly correspond to those in previous publications some were conducted for the first time, such as the estimation of substitution rates of each peptide encoding sequences, the inference of demographic evolutionary dynamics (R0, Td and r) using genomic data, and definition and comparison of synapomorphies between bat-RaTG13-CoV and SARS-CoV-2.Thus, this study provides more comprehensive information on comparative phylogenomics of SARS-CoV-2 and allow us to reach some basic conclusions.
Firstly, as discussed by Andersen et al. (18), there are two plausible scenarios on the proximal origin of SARS-CoV-2. The first scenario suggests that SARS-CoV-2 has evolved and acquired adaptive traits (mutations in the receptor-binding domain and polybasic cleavage site) in an unknown animal host prior to transmission to human. The second scenario, however, assumed that it has evolved in humans for a period time to gain the adaptive traits before becoming a pandemic form. At present, there is no convincing evidence in favour of either of these, but our results are in line with second scenario providing evidence for the origin of outbreak. Although, Wuhan has frequently been reported as origin place of SARS-CoV-2, our phylogenetic and network analyses strongly suggested that the virus samples from Guangdong province occupies the ancestral position with significant nodal support (Figs. 1 and 2). The Guangdong province is known as the largest import and export centre in China where the Malayan pangolins, a potential intermediate host of SARS-CoV-2, illegally traded (42). This result also challenges the scenarios that the virus transmitted from bats to humans in Wuhan wet market. The second remark is related to origin time of the pandemic form of the SARS-CoV-2. The first cases were announced in December 2019 from China. However, we estimated the date of origin as first half of September 2019, much earlier than the announced date of outbreak. Although, the date of origin estimated here is earlier, but, still close to the date reported by Bai et al. (37). These differences may have resulted from unreported or unidentified asymptomatic cases.
replicase proteins in favour of shortening the Td. The Td estimate of this study (5.39 days; 95% HPD = 3.82 – 6.96 days) was similar to some previously reported epidemiologic Td values [5.0 days; (47)], but shorter than others [7.5 days; (48)]. Based on these values, we assume that virus population has evolved towards shorter doubling time and if this particular positive selection pattern continues on nsp3 and nsp6 then further decline in Td may be expected during the upcoming course of the pandemic.
It is also worthwhile to note the decline in the basic reproduction number, the R0, a reference
parameter for pathogeny of the agent. Although there has been several reports exceeding approximately R0 > 6, the number estimated here, (R0 = 2.72) is amongst the lowest (11 and
references therein) and somewhat indicate declining over the time. One of the obvious reason may be the preventive measures taken worldwide. Therefore, it is recommended that measures must be persistent and strongly implemented so that until the declining tendency in R0 becomes perpetual.
Finally, the findings on tMRCA, growth rate, doubling time and R0 strongly indicate that investigating more comprehensive genome data improves robustness and also enhances
understanding of the demographic history of the outbreak. However, there is still a long way to
go in order to better understand the SARS-CoV-2 and its outbreak.
ACKNOWLEDGEMENTS
This study is dedicated to all healthcare staff and scientists for their diligence and hard work during this SARS-CoV-2 outbreak. We are grateful to the authors and originating and submitting laboratories of the sequences from GISAID’s EpiCOVTM Database. The
bioinformatics analyses were partially performed at TUBITAK ULAKBIM, High Performance and Grid Computing Center (TRUBA resources).
REFERENCES
1. J. Van Bavel, The world population explosion: causes, backgrounds and -projections for the future. Facts, Views Vis. ObGyn 5, 281–291 (2013).
2. S. Cleaveland, D. T. Haydon, L. Taylor, “Overviews of pathogen emergence: Which pathogens emerge, when and why?” in Wildlife and Emerging Zoonotic Diseases: The Biology, Circumstances and Consequences of Cross-Species Transmission, J. E. Childs, J. S. Mackenzie, J. . Richt, Eds. (Current Topics in Microbiology and Immunology,Vol. 315, Springer, 2007), pp. 85–111.
3. R. Carrasco-Hernandez, R. Jácome, Y. López Vidal, S. Ponce de León, Are RNA viruses candidate agents for the next global pandemic? A review. ILAR J. 58, 343–358
(2017).
potential of RNA and DNA viruses. Emerg. Infect. Dis. 22, 2037–2044 (2016).
5. K. E. Jones, et al., Global trends in emerging infectious diseases. Nature 451, 990–993
(2008).
6. P. T. Dolan, Z. J. Whitfield, R. Andino, Mapping the evolutionary potential of RNA viruses. Cell Host Microbe 23, 435–446 (2018).
7. S. Duffy, Why are RNA virus mutation rates so damn high? PLOS Biol. 16, e3000003 (2018).
8. S. Kumar, S. Subramanian, Mutation rates in mammalian genomes. Proc. Natl. Acad. Sci. 99, 803–808 (2002).
9. S. Jiang, et al., A distinct name is needed for the new coronavirus. Lancet 395, 949 (2020).
10. P. Zhou, et al., A pneumonia outbreak associated with a new coronavirus of probable bat origin. Nature 579, 270–273 (2020).
11. D. Wu, T. Wu, Q. Liu, Z. Yang, The SARS-CoV-2 outbreak: What we know. Int. J. Infect. Dis. 94, 44–48 (2020).
12. C. Yin, Genotyping coronavirus SARS-CoV-2: methods and implications. Genomics
(2020) https:/doi.org/10.1016/j.ygeno.2020.04.016.
13. M. Giovanetti, D. Benvenuto, S. Angeletti, M. Ciccozzi, The first two cases of 2019‐
nCoV in Italy: Where they come from? J. Med. Virol. 92, 518–521 (2020).
14. D. Benvenuto, et al., The global spread of 2019-nCoV: a molecular evolutionary analysis. Pathog. Glob. Health 114, 64–67 (2020).
15. M. Kearse, et al., Geneious Basic: an integrated and extendable desktop software platform for the organization and analysis of sequence data. Bioinformatics 28, 1647–9
(2012).
16. K. Katoh, D. M. Standley, MAFFT multiple sequence alignment software version 7: improvements in performance and usability. Mol. Biol. Evol. 30, 772–80 (2013).
17. S. Kumar, G. Stecher, M. Li, C. Knyaz, K. Tamura, MEGA X: Molecular evolutionary genetics analysis across computing platforms. Mol. Biol. Evol. 35, 1547–1549 (2018).
18. K. G. Andersen, A. Rambaut, W. I. Lipkin, E. C. Holmes, R. F. Garry, The proximal origin of SARS-CoV-2. Nat. Med. 26, 450–452 (2020).
19. D. Darriba, et al., ModelTest-NG: A new and scalable tool for the selection of DNA and protein evolutionary models. Mol. Biol. Evol. 37, 291–294 (2020).
20. A. Stamatakis, RAxML version 8: A tool for phylogenetic analysis and post-analysis of large phylogenies. Bioinformatics 30, 1312–1313 (2014).
21. H. J. Bandelt, P. Forster, A. Röhl, Median-joining networks for inferring intraspecific
phylogenies. Mol. Biol. Evol. (1999)
22. G. Vaidya, D. J. Lohman, R. Meier, SequenceMatrix: Concatenation software for the fast assembly of multi-gene datasets with character set and codon information.
Cladistics 27, 171–180 (2011).
23. A. J. Drummond, M. A. Suchard, D. Xie, A. Rambaut, Bayesian phylogenetics with BEAUti and the BEAST 1.7. Mol. Biol. Evol. 29, 1969–1973 (2012).
24. M. A. Miller, W. Pfeiffer, T. Schwartz, The CIPRES science gateway in Proceedings of the 1st Conference of the Extreme Science and Engineering Discovery Environment on
Bridging from the EXtreme to the Campus and beyond - XSEDE ’12, (ACM Press, 2012), p. 1.
25. E. Vynnycky, R. G. White, An introduction to infectious disease modelling (Oxford: Oxford University Press, 2010).
26. R. M. Anderson, R. M. May, Infectious diseases of humans: Dynamics and control (OUP Oxford, 1992).
27. A. W. Byrne, et al., Inferred duration of infectious period of SARS-CoV-2: rapid scoping review and analysis of available evidence for asymptomatic and symptomatic COVID-19 cases. MedRxiv (2020) https:/doi.org/10.1101/2020.04.25.20079889.
28. B. Murrell, et al., FUBAR: a fast, unconstrained bayesian appRoximation for inferring selection. Mol. Biol. Evol. 30, 1196–1205 (2013).
29. B. Murrell, et al., Detecting individual sites subject to episodic diversifying selection.
PLoS Genet. 8 (2012).
30. S. L. Kosakovsky Pond, S. D. W. Frost, S. V. Muse, HyPhy: Hypothesis testing using phylogenies. Bioinformatics 21, 676–679 (2005).
31. S. Woolley, J. Johnson, M. J. Smith, K. A. Crandall, D. A. McClellan, TreeSAAP: Selection on amino acid properties using phylogenetic trees. Bioinformatics 19, 671–
672 (2003).
32. D. A. McClellan, K. G. McCracken, Estimating the influence of selection on the variable amino acid sites of the cytochrome b protein functional domains . Mol. Biol. Evol. 18, 917–925 (2001).
33. D. L. Swofford, PAUP. Phylogenetic analysis using parsimony (and other methods). Version 4. Sinauer Assoc. Sunderland, Massachusetts., 294–307 (2002).
34. E. Minskaia, et al., Discovery of an RNA virus 3′→5′ exoribonuclease that is critically
involved in coronavirus RNA synthesis. Proc. Natl. Acad. Sci. 103, 5108–5113 (2006).
35. T. Gojobori, E. N. Moriyama, M. Kimura, Molecular clock of viral evolution, and the neutral theory. Proc. Natl. Acad. Sci. 87, 10015–10018 (1990).
36. P. Forster, L. Forster, C. Renfrew, M. Forster, Phylogenetic network analysis of SARS-CoV-2 genomes. Proc. Natl. Acad. Sci. 117, 9241–9243 (2020).
(2020) https:/doi.org/10.1101/2020.04.24.058933.
38. Y.-R. Guo, et al., The origin, transmission and clinical therapies on coronavirus disease 2019 (COVID-19) outbreak – an update on the status. Mil. Med. Res. 7, 11 (2020). 39. F. Wu, et al., A new coronavirus associated with human respiratory disease in China.
Nature 579, 265–269 (2020).
40. M. A. Shereen, S. Khan, A. Kazmi, N. Bashir, R. Siddique, COVID-19 infection: Origin, transmission, and characteristics of human coronaviruses. J. Adv. Res. 24, 91–98
(2020).
41. T.-M. Chen, et al., A mathematical model for simulating the phase-based transmissibility of a novel coronavirus. Infect. Dis. Poverty 9, 24 (2020).
42. K. Xiao, et al., Isolation of SARS-CoV-2-related coronavirus from Malayan pangolins.
Nature (2020) https:/doi.org/10.1038/s41586-020-2313-x.
43. R. Sanjuán, M. R. Nebot, N. Chirico, L. M. Mansky, R. Belshaw, Viral mutation rates. J. Virol. 84, 9733–9748 (2010).
44. Z. Zhao, et al., Moderate mutation rate in the SARS coronavirus genome and its implications. BMC Evol. Biol. 4, 21 (2004).
45. M. Vignuzzi, J. K. Stone, J. J. Arnold, C. E. Cameron, R. Andino, Quasispecies diversity determines pathogenesis through cooperative interactions in a viral population. Nature
439, 344–348 (2006).
46. C. Huang, et al., Clinical features of patients infected with 2019 novel coronavirus in Wuhan, China. Lancet 395, 497–506 (2020).
47. L. Ferretti, et al., Quantifying SARS-CoV-2 transmission suggests epidemic control with digital contact tracing. Science 368, eabb6936 (2020).
48. T. K. Tsang, et al., Effect of changing case definitions for COVID-19 on the epidemic curve and transmission parameters in mainland China: a modelling study. Lancet Public Heal. (2020) https:/doi.org/10.1016/S2468-2667(20)30089-X.
49. K. Mizumoto, K. Kagaya, G. Chowell, Early epidemiological assessment of the transmission potential and virulence of coronavirus disease 2019 (COVID-19) in Wuhan
City: China, January-February, 2020. MedRxiv (2020)
https:/doi.org/10.1101/2020.02.12.20022434
50. S. Sanche, et al., High contagiousness and rapid spread of severe acute respiratory syndrome coronavirus 2. Emerg. Infect. Dis. 26 (2020).
51. P. Serrano, et al., Nuclear magnetic resonance structure of the nucleic acid-binding domain of severe acute respiratory syndrome coronavirus nonstructural protein 3. J. Virol. 83, 12998–13008 (2009).
bioinformatics and molecular approaches. J. Virol. 83, 6957–6962 (2009).
53. D. Benvenuto, et al., Evolutionary analysis of SARS-CoV-2: how mutation of non-structural protein 6 (NSP6) could affect viral autophagy. J. Infect. (2020) https:/doi.org/10.1016/j.jinf.2020.03.058.
Figure and Table Legends
Figure 1. Phylogenetic tree of SARS-CoV-2 reconstructed from the concatenated dataset of all peptide encoding sequences using Bayesian Inference. Support values (posterior probabilities) of main clades/subclades are shown. Coloured branches refer to geographic locations: China (blue), America (red), Asia (orange), Europe (green), Australia (pink), Africa (cyan). The sample of bat-RaTG13-CoV was used as outgroup.
Figure 2. Median-joining network constructed using whole genome dataset of 25 SARS-CoV-2 and bat-RaTG13-CoV samples. A detailed explanation on the information about samples was given in Table S2. The marked colours: cyan (Guangdong Province), lilac (Wuhan Province), blue (other Chinese samples), red (America), brown (Asia). The length of links was proportional to the number of mutated nucleotide positions between two circles and open circles indicate missing haplotypes.
Figure 3. Median estimation of tMRCA of SARS-CoV-2 inferred from Bayesian coalescent model using demographic reconstruction option. the dataset was derived from an aligment of all peptide encoding sequences of 821 SARS-CoV-2 samples. An exponentially growing population rate mode of demography and a GTR + G model of substitution were assumed. The x axis is given as units of years, and the y axis is equal to the product of the effective population size. The bold dashed line is the median estimate, and the thick dashed lines display the 95% HPD limits (see text for details).
Figure 4. The codon patterns in terms of the magnitude of dN – dS (nonsynonymous - synonymous substitutions per site) of all peptide encoding sequences of SARS-CoV-2 samples (821 samples) in FUBAR analysis. Neutral and/or nearly neutral evolving codons were shown with red colour (that over there the magnitude of dN-dS is between -1 to +1). The codons subject to positive selection (dN - dS > 1) were shown with white and to purifying selection (dN - dS < 1) were shown with black.
Figure 5. The substitution types and distribution patterns of synapomorphic changes defining the clades (or branches) of human SARS-CoV-2 and bat-RaTG13-CoV. a) The distribution graph of transitions and transversions throughout the genomes, b) the number of
transition-type differences (GA, AG, CT, TC), c) the number of transversion-type differences (CA, AC,
Table 1. Divergence values of each peptide encoding sequences (10 CDS and 16 nsps synthesised from orf1ab) and overall genome of SARS-CoV-2.
Table 2. Nucleotide composition of each peptide encoding sequences (10 CDS and 16 nsps synthesised from orf1ab) and overall genome of SARS-CoV-2.
Table 3. The substitution rate estimations of each peptide encoding sequences (10 CDS and 16 nsps synthesised from orf1ab) and overall genome based on the available dates for samples using an uncorrelated relaxed molecular clock model with an exponentially growing population in BEAST, mean values ± standard deviations.
Table 1.
Gene Length
(nt) Nucleotide divergence a.a divergence Nucleotide diversity (π) overall non-degenera te twofold degenerate fourfold degenera te
dist. stdev
All genes 29238 0.029 0.025 0.034 0.028 0.057 0.00028 0.00004
Leader protein 540 0.041 0.025 0.081 0.044 0.067 0.00036 0.00020
nsp2 1914 0.038 0.035 0.049 0.038 0.075 0.00034 0.00010
nsp3 5835 0.026 0.025 0.029 0.019 0.059 0.00019 0.00008
nsp4 1500 0.030 0.023 0.043 0.028 0.048 0.00037 0.00023
3C-like proteinase 918 0.024 0.018 0.040 0.029 0.036 0.00008 0.00002
nsp6 873 0.039 0.033 0.077 0.000 0.072 0.00036 0.00024
nsp7 249 0.032 0.025 0.059 0.029 0.048 0.00009 0.00003
nsp8 594 0.017 0.015 0.009 0.018 0.040 0.00007 0.00002
nsp9 339 0.018 0.014 0.029 0.019 0.027 0.00005 0.00002
nsp10 417 0.031 0.025 0.000 0.077 0.058 0.00009 0.00003
nsp11 39 0.051 0.000 0.143 0.143 0.077 0.00013 0.00009
RdRP 2796 0.020 0.018 0.026 0.022 0.043 0.00027 0.00027
Helicase 1803 0.022 0.022 0.017 0.033 0.042 0.00035 0.00015
3'-to-5'
exonuclease 1581 0.016 0.014 0.012 0.039 0.028 0.00019 0.00014
EndoRNase 1038 0.021 0.021 0.027 0.015 0.046 0.00010 0.00003
2'-O-ribose
methyltransferase 897 0.021 0.019 0.027 0.025 0.033 0.00006 0.00001
S gene 3819 0.030 0.028 0.030 0.028 0.061 0.00025 0.00010
ORF3a 825 0.047 0.041 0.058 0.035 0.105 0.00045 0.00022
E gene 225 0.070 0.050 0.137 0.051 0.120 0.00023 0.00006
M gene 666 0.029 0.019 0.039 0.058 0.041 0.00039 0.00022
ORF6 183 0.016 0.000 0.065 0.000 0.033 0.00020 0.00006
ORF7a 363 0.014 0.009 0.040 0.000 0.025 0.00003 0.00001
ORF7b 129 0.016 0.024 0.000 0.000 0.047 0.00004 0.00003
ORF8 363 0.033 0.030 0.049 0.000 0.083 0.00115 0.00103
N gene 1257 0.058 0.046 0.074 0.058 0.110 0.00094 0.00031
Table 2.
Gene
Nucleotide composition
Gene
Nucleotide composition
U% C% A% G% U% C% A% G%
All genes
Avg. 32.22 18.34 29.82 19.62
3'-to-5' exonuclease
Avg. 32.39 18.27 29.35 19.99
1. codon 22.95 16.49 30.10 30.46 1. codon 23.15 17.46 29.22 30.17
2.codon 30.09 22.91 31.29 15.71 2.codon 28.85 20.87 32.07 18.22
3. codon 43.63 15.61 28.08 12.68 3. codon 45.18 16.49 26.76 11.57
Leader protein
Avg. 26.47 21.50 25.00 27.04
EndoRNase
Avg. 32.85 14.45 33.14 19.56
1. codon 12.22 26.11 18.89 42.78 1. codon 20.52 14.16 30.06 35.26
2.codon 29.44 14.45 33.89 22.22 2.codon 33.53 18.21 34.68 13.58
3. codon 37.74 23.93 22.23 16.11 3. codon 44.51 10.98 34.68 9.83
nsp2
Avg. 30.31 18.44 29.83 21.42
2'-O-ribose methyltransfer
ase
Avg. 33.00 16.00 31.54 19.46
1. codon 21.32 15.20 30.10 33.37 1. codon 22.15 15.44 33.89 28.52
2.codon 29.16 22.10 31.66 17.08 2.codon 30.87 21.81 31.54 15.77
3. codon 40.44 18.02 27.75 13.79 3. codon 45.97 10.74 29.19 14.09
nsp3
Avg. 31.99 16.75 32.12 19.14
S gene
Avg. 33.26 18.93 29.40 18.42
1. codon 21.85 14.60 32.13 31.41 1. codon 24.20 16.42 30.48 28.91
2.codon 28.64 23.60 34.60 13.16 2.codon 29.23 24.43 30.77 15.58
3. codon 45.47 12.07 29.61 12.85 3. codon 46.35 15.94 26.94 10.76
nsp4
Avg. 36.95 17.72 26.60 18.73
ORF3a
Avg. 33.35 21.09 27.03 18.53
1. codon 28.40 13.60 28.80 29.20 1. codon 25.82 17.82 28.73 27.64
2.codon 34.20 24.40 25.00 16.40 2.codon 34.22 23.27 28.00 14.51
3. codon 48.25 15.15 26.00 10.60 3. codon 40.02 22.18 24.36 13.44
3C-like proteina
se
Avg. 33.77 17.75 28.11 20.37
E gene
Avg. 40.45 19.99 20.89 18.67
1. codon 22.55 17.65 28.43 31.37 1. codon 28.01 19.99 24.00 28.00
2.codon 30.72 21.89 29.41 17.97 2.codon 48.00 21.33 18.67 12.00
3. codon 48.04 13.72 26.47 11.76 3. codon 45.34 18.66 20.00 16.00
nsp6
Avg. 39.56 16.55 24.14 19.76
M gene
Avg. 31.84 21.91 25.37 20.87
1. codon 30.69 13.45 30.34 25.52 1. codon 21.62 22.07 30.18 26.12
2.codon 42.76 20.69 21.03 15.52 2.codon 36.97 20.68 22.07 20.27
3. codon 45.22 15.51 21.03 18.23 3. codon 36.94 22.97 23.87 16.22
nsp7
Avg. 30.12 19.68 31.73 18.47
ORF6
Avg. 35.52 14.21 36.07 14.21
1. codon 26.51 18.07 25.30 30.12 1. codon 21.31 16.39 40.98 21.31
2.codon 37.35 22.89 31.32 8.43 2.codon 44.26 14.75 37.70 3.28
3. codon 26.51 18.07 38.56 16.87 3. codon 40.99 11.48 29.51 18.02
nsp8
Avg. 29.13 18.01 32.49 20.37
ORF7a
Avg. 32.23 21.76 29.48 16.53
1. codon 17.17 14.14 35.35 33.33 1. codon 24.79 22.31 27.27 25.62
2.codon 27.78 28.78 33.84 9.60 2.codon 34.71 25.62 26.45 13.22
3. codon 42.43 11.11 28.28 18.18 3. codon 37.19 17.35 34.71 10.75
nsp9
Avg. 28.91 18.88 30.97 21.24
ORF7b
Avg. 45.74 18.60 22.48 13.18
1. codon 19.47 17.70 32.74 30.09 1. codon 37.21 23.26 20.93 18.60
2.codon 25.66 26.55 28.32 19.47 2.codon 58.14 11.63 23.26 6.98
3. codon 41.59 12.39 31.86 14.16 3. codon 43.00 41.86 20.93 23.26
nsp10
Avg. 29.74 20.14 27.82 22.30
ORF8
Avg. 36.57 17.70 27.27 18.45
1. codon 22.30 17.27 27.34 33.09 1. codon 31.40 17.37 22.31 28.92
2.codon 21.59 27.33 28.78 22.30 2.codon 33.68 20.04 30.58 15.70
3. codon 45.32 15.83 27.34 11.51 3. codon 44.63 15.70 28.93 10.75
nsp11
Avg. 33.33 17.95 20.51 28.21
N gene
Avg. 21.01 25.07 31.69 22.24
1. codon 38.46 7.69 7.69 46.16 1. codon 14.79 24.15 31.50 29.56
2.codon 30.76 38.47 23.08 7.69 2.codon 16.48 28.39 33.21 21.92
3. codon 30.78 7.70 30.75 30.77 3. codon 31.75 22.66 30.35 15.24
RdRP
Avg. 32.45 17.94 30.26 19.35
ORF10
Avg. 35.97 18.42 29.81 15.80
1. codon 24.46 15.77 28.76 31.01 1. codon 26.31 15.80 36.85 21.05
2.codon 29.22 20.35 34.98 15.45 2.codon 44.74 15.81 26.27 13.18
3. codon 43.68 17.70 27.04 11.59 3. codon 36.86 23.66 26.32 13.16
Helicase
Table 3.
Gene Mean Rate ucld.mean ucld.stdev Coefficient
Variance Covariance
Overall 1.6463E-3 ± 1.1729E-3 1.8553E-3 ± 1.8089E-4 3.1755E-3 ± 6.4253E-4 1.5201 ± 0.1616 9.6540E-3 ± 0.0263
leader protein 1.1490E-2 ± 3.5338E-3 1.4910E-2 ± 5.1791E-3 3.2020E-1 ± 0.2843 6.0377 ± 1.9809 -1.041E-3 ± 0.0225
nsp2 3.4289E-3 ± 7.4638E-4 3.5720E-3 ± 7.9356E-4 5.2479E-3 ± 3.345E-3 1.3393 ± 0.5961 -6.353E-4 ± 0.0243
nsp3 2.5571E-3 ± 4.2484E-4 2.9112E-3 ± 6.4867E-4 1.3100E-2 ± 8.958E-3 3.1842 ± 0.7727 1.8389E-3 ± 0.0263
nsp4 3.8377E-3 ± 8.6322E-4 4.9686E-3 ± 1.7065E-3 7.3340E-2 ± 0.1091 4.2276 ± 1.6733 8.5638E-3 ± 0.0295
3C-like proteinase 4.0878E-4 ± 3.8422E-4 1.0579E-3 ± 9.5410E-4 2.4720E-1 ± 0.2932 10.9518 ± 2.7896 -1.965E-3 ± 0.0225
nsp6 2.6641E-3 ± 8.0519E-4 4.3889E-3 ± 1.7231E-3 3.0710E-1 ± 0.2907 8.4642 ± 2.6019 -1.572E-3 ± 0.0209
nsp7 2.9584E-3 ± 2.5303E-3 3.1058E-3 ± 2.3132E-3 4.7950E-1± 0.3769 13.5180 ± 2.6972 -5.129E-4 ± 0.0216
nsp8 7.6830E-4 ± 4.0444E-4 1.5420E-3 ± 9.1436E-4 2.1360E-1± 0.2731 8.0462 ± 3.5509 -5.88E-4 ± 0.0222
nsp9 5.4660E-4 ± 2.7272E-4 1.1240E-3 ± 6.3374E-4 2.4500E-1± 0.2879 9.8006 ± 4.1811 -5.265E-4 ± 0.0212
nsp10 4.6859E-3 ± 3.4210E-3 6.3142E-3 ± 4.3439E-3 2.5760E-1± 0.2771 7.0938 ± 2.7221 -7.177E-4 ± 0.0219
nsp11 2.5711E-4 ± 2.3253E-4 5.0020E-4 ± 4.4155E-4 4.0270E-1± 0.3603 15.7908 ± 4.1241 -7.069E-4 ± 0.0201
RdRP 2.1835E-3 ± 4.2071E-4 2.7701E-3 ± 8.5924E-4 2.7690E-2 ± 0.0464 3.7833 ± 1.3437 -1.678E-3 ± 0.0224
Helicase 1.6190E-3 ± 4.6816E-4 1.8098E-3 ± 6.0089E-4 7.4440E-3 ± 0.0264 2.0107 ± 1.3527 8.1003E-4 ± 0.025
3'-to-5' exonuclease 1.7954E-3 ± 6.9984E-4 2.2426E-3 ± 1.0392E-3 2.6220E-2 ± 0.0723 2.8530 ± 1.0385 2.1185E-3 ± 0.025
EndoRNase 1.2974E-3 ± 6.3716E-4 1.5266E-3 ± 8.8114E-4 1.9800E-2 ± 0.0712 2.3566 ± 2.0786 2.727E-5 ± 0.0287
2'-O-ribose methyltransferase 1.3558E-3 ± 8.0732E-4 2.3030E-3 ± 1.3548E-3 1.8470E-1 ± 0.2444 7.2491 ± 3.2383 3.0817 ± 0.0268
S-gene 3.7676E-3 ± 6.1808E-4 4.0959E-3 ± 7.7225E-4 1.0240E-2 ± 5.211E-3 2.2647 ± 0.6117 1.2223 ± 0.0323
orf3a 2.8431E-3 ± 9.1291E-4 3.4825E-3 ± 1.4402E-3 2.8590E-2 ± 0.0591 3.0399 ± 1.6010 3.753E-4 ± 0.0243
E-gene 8.4246E-3 ± 4.6670E-4 9.7163E-2 ± 5.3637E-4 3.6250E-1 ± 0.3124 8.7000 ± 2.6760 3.203E-3 ± 0.0279
M-gene 3.6035E-3 ± 1.4276E-3 5.3685E-3 ± 2.3180E-3 1.6700E-1 ± 0.2139 5.7807 ± 2.4889 -1.257E-3 ± 0.0223
orf6 1.3291E-3 ± 9.1878E-4 2.0736E-3 ± 1.4197E-4 2.8970E-1 ± 0.3148 9.8280 ± 3.9884 -9.472E-4 ± 0.0192
orf7a 2.9930E-4 ± 3.1611E-4 6.7744E-4 ± 6.5021E-4 3.1320E-1 ± 0.3243 12.0949 ± 4.2280 4.066E-4 ± 0.0233
orf7b 9.0770E-4 ± 7.8061E-4 1.5165E-3 ± 1.1948E-3 3.4120E-1 ± 0.3362 11.7739 ± 3.9525 -2.678E-4 ± 0.0233
orf8 8.2470E-3 ± 2.8474E-4 1.0830E-2 ± 4.3398E-3 2.5680E-1 ± 0.2676 5.9695 ± 2.3771 -6.743E-4 ± 0.0233
N-gene 4.5613E-3 ± 1.4342E-3 5.0338E-3 ± 1.6280E-3 2.0380E-2 ± 0.0169 2.9106 ± 0.8869 -2.968E-3 ± 0.0232
Table 4.
Gene MEME (P ≤ 0.5) FUBAR (P ≤ 0.5)
Leader
protein 31 -
nsp3 1179 1179
nsp6 38 4. 38. 154. 157
RdRP - 323
S gene 860. 861 -
N gene - 24
Gene Codon Exchange
Property and category of the change (P ≤ 0.001)
Average number of surrounding
residues
Beta-structure tendencies
Long-range non-bonded
energy
Polar requirement
Polarit y
Solvent accessible
reduction ratio
nsp3 1179 A↔V 5 6 5 2 3 5
Supplementary Files
Supplementary Figures
Figure S1. The phylogenetic tree reconstructed for defining synapomorphies at the clades (or branches) leading to human SARS-CoV-2 and bat-RaTG13-CoV. The sampling list used in the reconstruction of the tree was presented in Table S3.
Supplementary Tables
Table S1. Detailed description of the sampling list retrieved from GISAID database.
Table S2. A summary of the sampling list used in the network reconstruction of SARS-CoV-2
TableS3. A summary of the sampling list used in the phylogenetic tree reconstructed for defining synapomorphies at the clades (or branches) leading to human SARS-CoV-2 and bat-RaTG13-CoV