ISSN: 2231-5381
http://www.ijettjournal.org
Page 4352Study And Implementation Of Drive Test For
Development Of GSM Network
Richa Budhiraja1, Jitendra Singh Jadon2
Amity Institute of Telecom Engineering and Management, Amity University, Sector-125, Noida – 201301, INDIA
Abstract— Even though mobile radio systems deliver more and
more performance data there is always a need to measure the performance of the network in the field. These measurements can either be part of the deploying new network sites inorder to meet coverage, capacity and quality requirements, optimization of the network, benchmarking of performance, trouble shooting, or to verify the performance after an upgrade or reconfiguration of the network. These measurements are performed through Drive Test and RF survey. Drive testing is principally applied in
both the planning and optimization stage of
network development. The paper focuses on the procedure of drive test and its importance in network planning.
Index Terms— Drive Test, network quality, KPI, GSM, network Planning
I.INTRODUCTION
With the rapid growth of the wireless industry, GSM (Global System for Mobile communications) networks are rolling out and expanding at a high rate. The industry is also becoming intensely competitive. In this environment, high quality of service is a competitive advantage for a service provider. A lot of effort is made by a network operator to monitor the networks and maintain current, comprehensive and accurate status of its quality. This status, together with new traffic demand data is used by the operators to improve their network and adjust its operation. Drive tests are the most common measurement tool used by operators, to probe the quality status and solve network problems.
Drive Testing is a method of measuring and assessing the coverage, capacity and Quality of Service (QoS) of a mobile radio network [1]. It is conducted for checking the coverage criteria of the cell site with the RF drive test tool. The data collected by drive test tool in form of Log files are assessed to evaluate the various RF parameters of the network. The technique consists of using a motor vehicle containing mobile radio network air interface measurement equipment that can detect and record a wide variety of the physical and virtual parameters of mobile cellular service in a given geographical area.
By measuring what a wireless network subscriber would experience in any specific area, wireless carriers can make directed changes to their networks that provide better coverage and service to their customers.
Drive test equipment typically collects data relating to the network itself, services running on the network such as voice or data services, radio frequency scanner information and GPS information to provide location logging.
II.DATA ACQUIRED FROM DRIVE TEST
The dataset collected during drive testing field measurements can include information such as
Signal intensity Signal quality Interference Dropped calls Blocked calls Anomalous events Call statistics Service level statistics QoS information Handover information Neighbouring cell information GPS location co-ordinates
III.TYPES OF DRIVE TEST
Drive testing can broadly be categorized into two distinct topics:
A.Pre Swap Drive Test
The Pre Swap Drive Test will be carried out on pre-defined routes in pre-defined cities using industry standard drive test tools and at network level. The Drive Test routes and the cities must be discussed and agreed before the start of the project. The result from the pre-swap drive testing will be used as the reference level for verification of the performance of the radio network after the Swap has been completed. The Pre Swap drive test report will include statistical reports about the received downlink signal strength & RxQuality, Call Setup Success Rate, Handover Success Rate and Call Drop Rate. The results of the Pre Swap Drive Test will be documented in the form of Network Quality Index (NQI).
B.Post Swap Drive Test
ISSN: 2231-5381
http://www.ijettjournal.org
Page 4353 form of Network Quality Index (NQI). Cartographic plots forthe received downlink signal strength & Rx Quality can also be provided if the digital maps are available. The network performance verification results are presented in a form of Network Quality Index (NQI), which is used for benchmarking the network performance. The objective of the radio network performance benchmarking procedure is to compare the radio network performance objectives as per the NQI target from the Pre Swap Drive Test. The data from the Post Swap Drive Test is evaluated and presented in a separate test report including the resulting NQI figures for each service area category in order to show that the requirements according to the Pre Swap Drive Test NQI Target have been fulfilled [5].
These are further classified as - Network Benchmarking, Optimization & Troubleshooting, Service Quality Monitoring. The resulting produced by drive testing for each of these purposes is different.
Network Benchmarking - For network benchmarking, sophisticated multi-channel tools are used to measure several network technologies and service types simultaneously to very high accuracy, to provide directly comparable information regarding competitive strengths and weaknesses. Results from benchmarking activities, such a comparative coverage analysis or comparative data network speed analysis, are frequently used in marketing campaigns. Drive testing to gather networking benchmarking data is the only way mobile network operators can collect accurate competitive data on the true level of their own and their competitors technical performance and quality levels.
Optimization & Troubleshooting - Optimization and troubleshooting information is more typically used to aid in finding specific problems during the rollout phases of new networks or to observe specific problems reported by consumers during the operational phase of the network lifecycle. In this mode drive testing data is used to diagnose the root cause of specific, typically localized, network issues such as dropped calls or missing neighbour cell assignments.
Service Quality Monitoring - Service quality monitoring typically involves making test calls across the network to a fixed test unit to assess the relative quality of various services using Mean opinion score (MOS). Quality monitoring focuses on the end user experience of the service, and allows mobile network operators to react to what effectively subjective quality degradations by investigating the technical cause of the problem in time-correlated data collected during the drive test. Service quality monitoring is typically carried out in an automated fashion.
IV.EQUIPMENT USED IN DRIVE TEST
A conventional drive-test system is comprised of a test mobile phone, software to control and log data from the phone, and a Global Positioning System (GPS) receiver for position information.
1. TEMS Handset (complete with Charger, Headset, Data Cable) and USB Hub
2. Laptop (installed TEMS Investigation) and Adapter 3. GPS (Ext Antenna and Data Cable)
4. Inverter and Terminal
5. Scanner for GSM (Ext Antenna GPS and RF, Data Cable) 6. Battery and Charger etc
V.DEFINE THE TEST METHODS AND TEST ROUTES
A. Test Methods
Before the single site verification starts, it is necessary to communicate with the client and make clear the test methods. The test methods mainly involve with the following parts[4]:
1. Calling methods adopted by CS service
Two modes are used for conducting the test:
i. Idle mode - the MS is ON but a call is not in progress ii. Dedicated mode - the MS is ON and a call is in progress.
The call made for drive test is either a short call or log call. Usually, combination of two calling methods will be adopted for the test, for example, Idle + short call, Idle + long call, or Idle + short call + long call. Each test method has different emphases.
Each mode has a specific purpose which is explained in the table below.
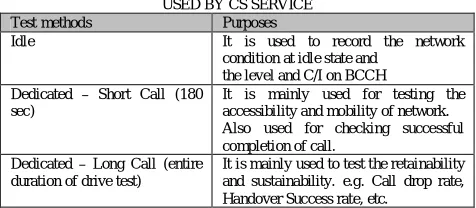
TABLE 1 CALLING METHODS WHICH ARE FREQUENTLY USED BY CS SERVICE
Test methods Purposes
Idle It is used to record the network condition at idle state and
the level and C/I on BCCH Dedicated – Short Call (180
sec)
It is mainly used for testing the accessibility and mobility of network. Also used for checking successful completion of call.
Dedicated – Long Call (entire duration of drive test)
It is mainly used to test the retainability and sustainability. e.g. Call drop rate, Handover Success rate, etc.
For short calls, it is necessary to confirm some information with the client, including the length of a short call, the interval between two short calls, and the length of waiting time when a call is originated abnormally or a call drop occurs. For short calls or idle state, it is necessary to confirm whether the test is based on fixed BCCH.
2. Test methods for PS service
If EGPRS service is commissioned for a network, PS service performance test should be done upon site verification. The most common test items include attaches, PDP activation, FTP download/upload, ping test, and so on. Drive test for PS Service is carried in packet mode.
B. Definition of Test Routes
The choice of test routes varies with different scenarios of site verification. The test scenarios are usually divided into two categories, that is, urban areas and suburban areas. This classification is based on distribution density of sites and the surrounding radio environment [2].
ISSN: 2231-5381
http://www.ijettjournal.org
Page 4354 a. The test routes should cover the roads which are coveredby different sectors of the sites to be tested. Besides, the main streets around the base stations should also be included.
b. The test routes should reach the areas covered by cells which are around the base stations to be tested so as to ensure that the actual coverage area of the site and its handover functions can be verified.
c. The design of test routes should take into consideration the local customs of travel so as to reduce the waiting time at traffic lights.
2. Suburban areas - The main features of test routes in suburban areas are as follows:
a. The test routes should cover the roads which are covered by different sectors of the sites to be tested.
b. The test routes should reach the overlapping areas of surrounding neighbor cells so as to ensure that the actual coverage area of the site and its handover functions can be verified.
c. For isolated sites, the normal coverage area of the site should be got through the test.
VI. ANALYSIS OF DRIVE TEST DATA
The drive test data is collected through data collecting software like TEMS. This sections deals with the parameters that are collected by TEMS software [3].
A. Radio Parameter
The different parameters in the Radio parameters window are shown in the figure 1.
Figure 1 Radio parameters
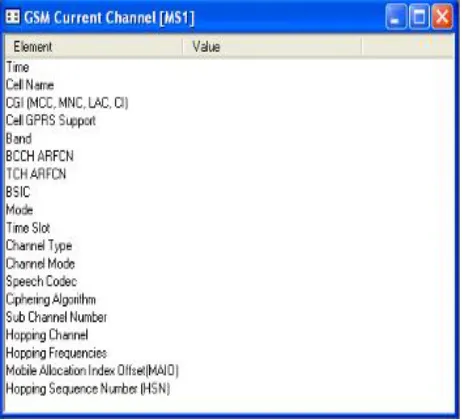
B. Current Channel
The figure below shows the different parameters in the current channel window of TEMS software [5].
Figure 2 Current Channels
C. Serving + Neighboring window
The figure shows the parameters of the serving plus neighboring window [6]:
Figure 3 Serving Neighbours
VII. PRACTICAL SURVEY
A.RF survey for a Site
TABLE 2 SITE DETAILS
Site Details
S.NO Anchor Id Anchor
Name Site Name
1 DLA3176 Indus Palam Vihar
TABLE 3 SITE DETAILS PROVIDED
SITE DETAILS PROVIDED AS PER DATABASE
Latitude Longitude Site Address
28.5046 77.0691
Plot No. 4196, Sector 23-A, Palam Vihar, Gurgaon
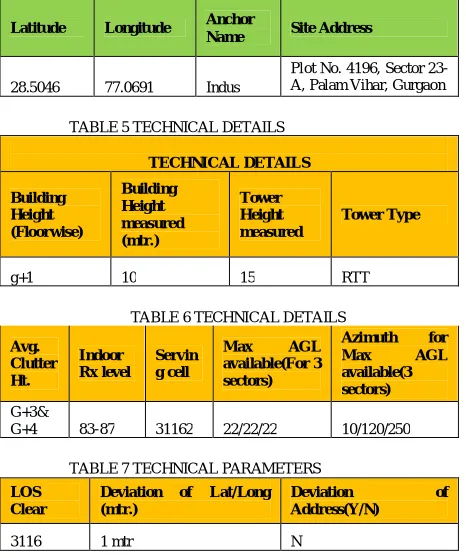
TABLE 4 SITE DETAILS AS PER SURVEY
ISSN: 2231-5381
http://www.ijettjournal.org
Page 4355 Latitude Longitude AnchorName Site Address
28.5046 77.0691 Indus
Plot No. 4196, Sector 23-A, Palam Vihar, Gurgaon
TABLE 5 TECHNICAL DETAILS
TECHNICAL DETAILS
Building Height (Floorwise)
Building Height measured (mtr.)
Tower Height measured
Tower Type
g+1 10 15 RTT
TABLE 6 TECHNICAL DETAILS
Avg. Clutter Ht.
Indoor Rx level
Servin g cell
Max AGL available(For 3 sectors)
Azimuth for Max AGL available(3 sectors)
G+3&
G+4 83-87 31162 22/22/22 10/120/250
TABLE 7 TECHNICAL PARAMETERS
LOS Clear
Deviation of Lat/Long (mtr.)
Deviation of Address(Y/N)
3116 1 mtr N
After collecting the required information form the BTS and the OMC-R, the drive test is started. The equipment is set up in a vehicle and long calls as well as short calls are generated. A long call is a call which is generated as well as terminated by the user himself. A short call is a pre programmed call generated by the system for a very small duration, say 10 seconds or more. A long call is used to measure the handover success rate as well as the Rx quality, while CSSR and Rx level are measured on a short call. The drive test is done over a distance of 3 km or more from the starting point. Various parameters are observed and recorded during the drive test.
The drive test procedure is as follows:
Tool may be setup for two mobiles, one for Long call and another for short calls (duration: 2 min). In the route map following are to be enabled for Analysis.
Rx Level RX Quality
Survey Markers (like CSSR, DCR & H/O Symbols) Cell site Database.
All statistics for the Calls in the Point -1 to be enabled.
Conduct the Drive Test – covering all sectors by observing the following Parameters:
Rx Level Rx Quality
Interference on BCCH & Hopping Frequencies. Call setup failure reasons
Observe whether the nearest sector is serving or not.
The data, as per the requirements are observed and recorded. The data is analyzed for performance. The design is validated and based on the data analysis, the percentage of good network and bad network is concluded.
1. Drive Test result for a site in Idle Mode
Figure 4 Line Chart of MS1
Figure 5 Radio Parameters of MS1
ISSN: 2231-5381
http://www.ijettjournal.org
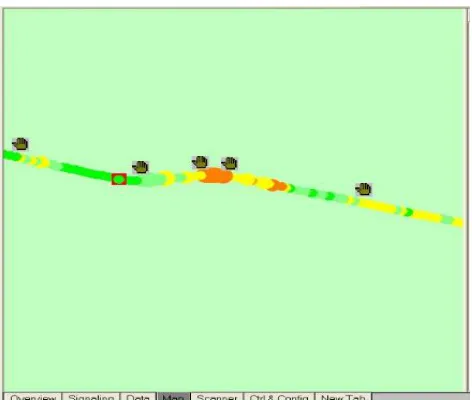
Page 4356 Figure 7 Parameters of Neighbouring ChannelFigure 8 Screenshot depicts drive testing result in idle mode on TEMS software. The dark green patches depict a strong received signal.
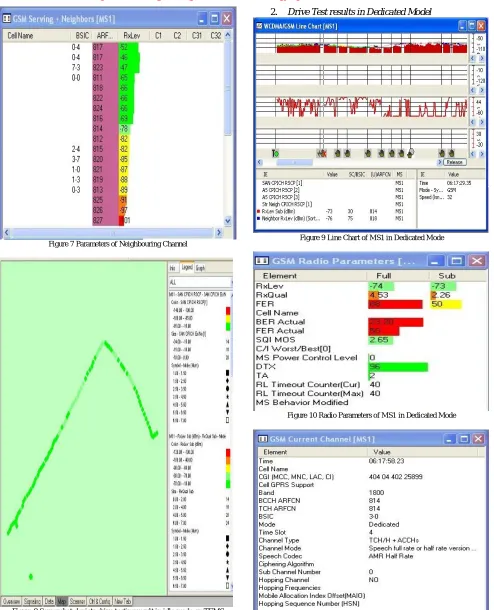
2. Drive Test results in Dedicated Model
Figure 9 Line Chart of MS1 in Dedicated Mode
Figure 10 Radio Parameters of MS1 in Dedicated Mode
ISSN: 2231-5381
http://www.ijettjournal.org
Page 4357 Figure 12 Parameters of Neighbouring channel in Dedicated ModeFigure 13 Screenshot depicts drive testing result in dedicated mode on TEMS software. The dark green patches depict a strong received signal.
The hand symbol represents handover taking place.
VIII. CONCLUSION
This paper entails the basics of conducting a drive test of a GSM development network. Different modes, types and procedures used to carry out a drive test are explained briefly. Also, the practical approach to conduct the test has been described. The overall objectives of any RF design depend on a number of factors that are determined by the needs and expectations of the customer and the resources made available to the customer. Analyses made through the information of data collected in the field represent a true picture of network conditions, and can be used in decision making in several areas, from planning and design through optimization and maintenance of the system, always with the goal of maximizing Quality, Capacity and Coverage in the Network.
REFERENCES
[1] Amaldi, A. Capone, and F. Malucelli, “Radio planning and coverage optimization of 3G cellular networks,” Journal of Wireless Networks, vol. 14, no. 4, pp. 435– 447, August 2008.
[2] A. Mishra, Fundamentals of cellular network planning and optimisation: 2G / 2.5G / 3G.. Evolution to 4G. Wiley-Interscience, 2004.
[3] TEMS investigation user’s manual, 11.0, Ascom- 2010. [4] Drive Test Overview by Mustafa Bin Amar.
[5] Syed Imran Basha, Idrish Shaik, “Reducing Handover Failure Rate by RF Optimization”, International Journal of Engineering and Innovative Technology (IJEIT) Volume 2, Issue 11, May 2013.