ESTIMATION OF SHOULDER LANE UTILIZATION ON EXPRESSWAY
MIDBLOCK SECTION
Pornnarong Lueanpech1, Terdsak Rongviriyapanich2
1,2 Department of Civil Engineering, King Mongkut’s University of Technology North Bangkok, Bangkok,
Thailand
Received 5 September 2018; accepted 30 October 2018
Abstract: During the peak hour, drivers are occasionally allowed to use the shoulder lane on
the Kanjanapisek Expressway to provide additional space and reduce travel delay. Based on the observation, we found a significant number of vehicles regularly used the shoulder lane both during the peak and off-peak period. Concentrate on midblock section, we found the use of shoulder lane during the free flow traffic condition. The consequence of inconsistent lane utilization on midblock section affects the stability of traffic flow and creates a bottleneck on the expressway. This study aimed to investigate the characteristic of shoulder lane utilization behavior, identified significant parameters affecting shoulder lane utilization behavior and compared the empirical data with simple linear regression and sigmoid function. In this study, the empirical data of 5 expressway midblock sections on the Kanjanapisek Expressway was chosen for study area. Traffic stream data collections were gathered from image processing traffic detection system. The result indicated that the shoulder lane utilization behavior has unique characteristic in different flow condition. The most influenced factors that contributes to shoulder lane utilization was the total density. Linear and sigmoid function were compared to establish relationship between the influenced factor and the shoulder lane utilization. In term of modelling, the sigmoid function provided good estimates of shoulder lane utilization on expressway midblock section of the Kanjanapisek Expressway. These results should contribute
to a better understanding of discretionary lane selection behavior.
Keywords:shoulder lane utilization, expressway, midblock, discretionary lane selection.
1 Corresponding author: [email protected]
1. Background
According to a policy for geometric design of highway and street (AASHTO, 2011) recommended that the shoulder lane in expressway should be designed wider than the shoulder of a typical urban road. It should be approximately 2.40-3.00 meters wide depending on the number of regular lane. Following the left-handed driving rule in Thailand, the shoulder lane on expressway
The observation of expressway network in the Bangkok Metropolitan and vicinity areas which are operated by the Expressway Authority of Thailand (EXAT) found a significant number of vehicles using the shoulder lane as a regular lane especially during the rush hour. The most common location for shoulder lane use on expressways were both the ramp junction and the midblock section. Although the using of shoulder lane both for travelling or overtaking tend to increase capacity of the expressway especially on demanded period but it is more likely to create bottleneck and accident. Obviously, lane width of the shoulder lane was usually narrower than the regular lane which potentially to collided with the barrier along the expressway or the vehicle in the adjacent lanes. Furthermore, shoulder lane use will obstruct the rescue operation in case of emergency and violated to the Thai Traffic law regulation under the Land Traffic Act (Royal Thai Police Department, 1979) which stated that the shoulder lane has been preserved as extra space to escape from ordinary traffic and provide an emergency access for rescue operation and definitely its prohibited for using as regular traffic lane.
On the other hand, the common approach of traffic management to alleviate the recurrent traffic congestion which primarily cause by the exceed demand over capacity of the road network consist of; (1) the construction or expansion of infrastructure to increase the
capacity (Mirshani et al., 2007) and (2) the
management of existing infrastructure to maximum efficiency. In term of application, we found the widely use of shoulder lane as a temporary lane during the peak period in the
western counties (Duret et al., 2012). Several
studies stated that this kind of application gained more benefit to road network by
reducing congested duration and accident rate. It is more cost effective compared to the construction of the new infrastructure (Berger and Maurer, 1999), (Kellermann, 2000), (Nezamuddin, 2011).
Even though the success and benefits of temporary shoulder use in the several western countries are highlighted but the application of such system on expressway network need to essentially consider on many factors. Especially, when we are dealing with various driving behavior and the distinct of laws regulation, the application of shoulder lane as extra space on the Expressways in Thailand is likely to produce the contrasting results. This study aims to investigate the characteristic of shoulder lane utilization behavior, identified significant parameter effect to shoulder lane utilization behavior and compared the empirical data with simple linear regression and sigmoid function on the Kanjanapisek Expressway. The result will contribute to a better understanding of discretionary lane change behavior of vehicle on multilane expressway in Thailand.
2. Literature Review
capacity on 3 lanes freeway section in Italy. The result indicated that the driver possibly moved to inner lane once the f low rate increased and the unbalance lane utilization caused by driving regulation and poor lane discipline. In case of capacity analysis, the result shown that the estimated capacity of test section was lower than ideal value as given in the Highway Capacity Manual (HCM, 2010).
(Gunay, 2004) studied the lane utilization in Turkish highway indicated that one of reason which created the imbalance lane utilization was the road geometry; the poor road surface, poorly maintenance and the unclear of lane marking or existed of studs on lane lines. This kind of situation will potentially lead the vehicle to losing of safety and it also made
trouble to the traffic management. (Xiao et
al., 2014) studied of the lane utilization on
long continuous highway and concluded that the lane utilization inf luenced by highway geometry and revealed that the straight section of highway likely gained high utilization on median lane and highly on-ramp volume probably increased the lane utilization on shoulder lane. (Knoop
et al., 2010) studied the lane utilization of
freeway and indicated that lane utilization will be fluctuated on the ramp area which contrasting with the output from (Amin and Bank, 2005).
The lane selection behavior of vehicles in road network is related to the lane change maneuver and lane utilization which is much more complex in mixed traffic conditions. The relationship among the traffic stream parameter also explained the lane utilization, based on the observation of
3 lane freeway in Toronto by (Hurdel et al.,
1997) highlighted that each lane contains different capacity and the shoulder lane has
lower capacity than middle lane or medium
lane. (Carter et al., 1999) demonstrated the
variation of lane utilization by considering the lane discipline rules, amount of heavy vehicle and the location of on and off ramps. The result showed that the lane utilization relates to the lane location, capacity, speed and density. The distinct driving attitude also created the imbalance lane utilization, (Gunay, 2007) developed the car following model based on lateral distance between vehicle and indicated that movement of following vehicle was formulated with the off-centre effects from leading vehicle.
(Choudhury et al., 2008) presented the
cooperate lane changing model which allows drivers to merge in mandatory and discretionary situation and the important parameters of the model was the vehicle trajectory data.
The driving environment was one of the influenced factor to the lane utilization, (Hollis and Evan, 1976), (Turner, 1983), (Fwa and Li, 1995) concluded that one of major factor affecting lane utilization was the volume of the trucks in road network. (Gunay and Erdemir, 2011) found that the vehicles prefer to stay behind or lead ahead based on flow rate and density when headway of vehicle close to leading vehicle, they were forced to move side by side. (Bangarraju
et al., 2016) explored the none-lane based
significantly different between Germany and North America.
The lane utilization or lane flow distribution model has been proposed by different authors. (Wu, 2009) predicted the lane utilization on multilane freeway in Germany by modifying the lane-change probability model proposed by (Heidamann, 1994), (Okura and Somasundaraswaran, 1996) based on exponential regression model
and focusing on capacity. (Knoop et al.,
2010) explained that the lane utilization as a function of traffic density. (Lee and Park, 2010) developed the lane utilization model on basic freeway segment in Virginia by applying a series of polynomial. (Duret
et al., 2012) studied the lane utilization on
multilane freeway in France and identified linear relationship with total flow. (Samoili
et al., 2013) investigated the variation of flow
and density in San Diego, California and explored the dynamic relationship with nonparametric locally weighted regression as a function of total density. (Lueanpech and Rongviriyapanich, 2017) developed a nonlinear regression model using a Generalized Additive Model (GAM) to estimate the shoulder lane utilization on expressway in Thailand and indicated that the influence factor affects to shoulder lane utilization include speed different between adjacent lane and percentage of heavy vehicle.
The shoulder lane is a part of road design and typically expected for clearance zone and emergency issues. Many cases of traffic mitigation usually done by providing extra space for vehicle and it also effected to the
lane utilization. (Moriyama et al., 2011)
studied effect on lane utilization and capacity in case of adding an auxiliary lane to the climbing section on the Chuo Expressway. It was found that during the test date the utilization on adding auxiliary lane was significantly increased, slightly increased on traffic capacity and potentially alleviated the traffic congestion.
This study focuses on the shoulder lane utilization behav ior on ex pressway midblock section which seem to be discrete circumstances. The modeling of shoulder lane utilization based on simple linear regression and sigmoid function were constructed and compared with the empirical data of 5 expressway midblock sections on the Kanjanapisek Expressway
3. Methodology
3.1. Case Study Setup
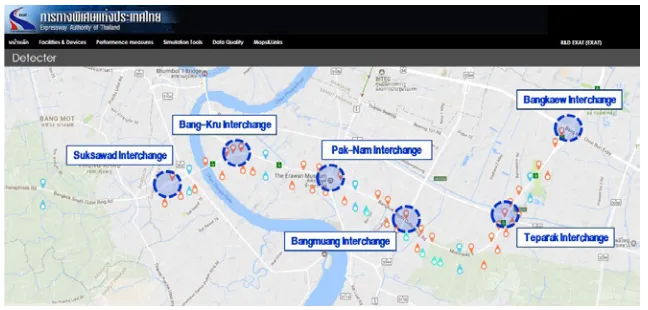
Fig. 1.
The Kanjanapisek Expressway and Detector Location
Source: EXAT ITS database system, Expressway Authority of Thailand, 2017
3.2 Traffic Data Collection
The traffic data collection for this research collected by 10 image processing traffic detectors which are installed on gantry structure 6 meters above the expressway surface. The spacing of each image processing traffic detector system (IDS) approximately every 5 kilometers located at the midblock section and typically captured
the traffic measurement on the shoulder lane, lane 1 (left most lane), lane 2 (middle lane) and lane 3 (right most lane) Fig. 2 illustrated the configuration of image processing traffic detectors. The seven days data from June 11-17 in 2017 were downloaded from the EXAT ITS database system. In pursuance to describe the dynamics of traffic conditions, the dataset in this study were aggregated in 5 minutes intervals.
Fig. 2.
3.3. Lane Utilization
The expression of lane utilization could be indicated as the distribution of macroscopic variable of traffic to each lane on multilane expressway. This idea was approached to lane usage, lane split and lane ratio. This study considered the utilization based on total flow
rate (qt) especially flow rate on shoulder lane
(qs), meanwhile the shoulder lane utilization
(SLU) was the ratio between flow rate value on shoulder lane and the total flow rate of the freeway section. The equation was used to calculate the shoulder lane utilization in this study as below, Eq. (1):
(1)
Where qS is the flow rate on shoulder lane
(pcu/hr) and qt is the total flow rate of the
freeway section (pcu/hr)
3.4. Model Development
The model development in this study, we were applied the simple linear regression and sigmoid function to examine the relationship between independent parameter and shoulder lane utilization as well as to identify the influences parameter contribute to shoulder lane utilization. This study focuses on a random response for variable
Y (the shoulder lane utilization) from a set
of random variables X1, X2,…,Xn (the related
traffic parameter).
In term of linear relationship, the simple linear regression was used as a method
to estimate E(Y/X1,X2,…,Xn) through the
standard linear regression technique. The equation of simple linear regression was used to estimate the shoulder lane utilization in this study as below Eq. (2):
(2)
where; β0 is the constant term usually
obtained by least squares; β1 is the linear
coefficient obtained by least squares;
X is the influences parameter contribute to
shoulder lane utilization
The sigmoid function was applied to analyze the nonlinear relationship between independent parameter and shoulder lane utilization as well as to estimate the appropriate coefficient using lease square method. The equation of sigmoid function was used in this study as below Eq. (3):
(3)
where; θ is the sigmoid function coefficient;
X is the parameter affecting shoulder lane
utilization;
The modeling functions in the IBM SPSS Statistic are used for statistical analysis. The correlation analysis and backward stepwise technique were adopted to identify the significant parameter and the elimination criteria in this study was considered the Pearson correlation coefficient and statistic
p-value of each predictor. In this study the
Table 1
The Predictor Parameters used in this Study
Categories Predictor Parameters Abbreviation
Traffic Stream Parameter Total Flow RateAverage Speed
Total Density
Tflow
Tspeed Tdensity
Relative Parameter from Adjacent Lane Relative SpeedRelative Flow
Relative Density
Rflow Rspeed
Rdensity
Driving Environmental Percentage of Truck or Heavy VehicleAverage Headway HWavg
%Truck
Benefit from Using of Shoulder Lane Travel Time saving TTsaving
4. Results and Discussions
4.1. Lane Utilization Characteristic on
Expressway Midblock Section
The lane utilization was the result of lane selection behavior which depends on numerous factors (HCM, 2010) and each lane in the same direction regularly had unique characteristics (Lighthill and Whitham, 1955), (Richards, 1956). According to the physical properties of the Kanjanapisek Expressway, we could be classified the midblock section within the study area for 3 categories included; (1) the straight section, (2) the curve section and (3) the grade section. The average value of lane utilization on the Kanjanapisek
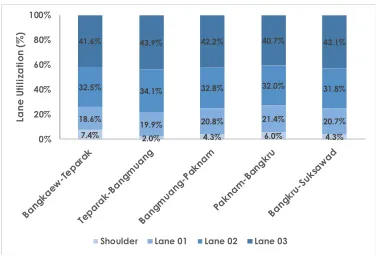
Expressway revealed that the seven days data collection found the unbalance lane utilization on each section. The highest lane utilization was 43.9% on the median lane (lane 3) followed by the middle lane (lane 2) and the left-most lane (lane 1) respectively. In case of shoulder lane utilization, the results notified that the maximum value of shoulder lane utilization was 7.4% occurred on the Bangkaew-Teparak section; the straight section followed by the PakNam-Bangkru section and the PakNam-Bangkru-Suksawad which is the grade section respectively. In the case of shoulder lane utilization on the curve section, this study found the use of shoulder lane only 2.0%. The average lane utilization on expressway midblock section were illustrated in Fig. 3
7.4% 2.0% 4.3% 6.0% 4.3% 18.6% 19.9% 20.8% 21.4% 20.7% 32.5% 34.1% 32.8% 32.0% 31.8% 41.6% 43.9% 42.2% 40.7% 43.1%
0% 20% 40% 60% 80% 100%
La
ne
U
tiliz
a
tio
n (
%
)
Shoulder Lane 01 Lane 02 Lane 03
Fig. 3.
4.2. Shoulder Lane Utilization on
Expressway Midblock Section
Even though the shoulder lane on the Kanjanapisek Expressway was prohibited but lack of law enforcement and the demand management especially within the rush hour caused the using of shoulder lane remained. In the traffic operator and police officer point of view, during the rush hour both organizations were agreed to occasionally allow drivers using the shoulder lane to provide an additional space for demanded vehicles and reduce travel delay. The average value of shoulder lane utilization on the Kanjanapisek Expressway during the time of day from 6:00AM-6:00PM (12 hours) revealed that the seven days data collection found the fluctuation of shoulder lane utilization during the time of day on each section. The highest shoulder lane utilization was on the 9:00-12:00AM (Off-Peak period) followed by the 3:00-6:00PM (PM Peak period) and the 6:00-9:00AM (AM Peak period) respectively, and the most of shoulder lane utilization was occurred on the Bangkaew-Teparak section followed by the PakNam-Bangkru section and the
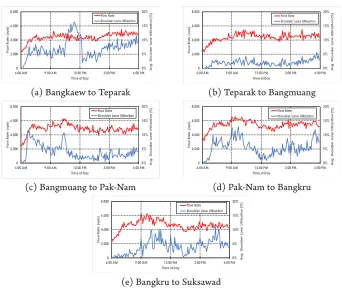
Bangkru-Suksawad respectively. Average shoulder lane utilization on expressway midblock section during the time of day were illustrated in Fig. 4.
The assumption of this study introduced that the using of shoulder lane will perform once traffic demand exceeded capacity and should be occurred based on mandatory circumstance facilitated by traffic operator. Comparing between the shoulder lane utilization and total f low rate in each expressway section during the time of day, if we classified the flow rate based on total flow level to 3 categories included high-flow level (more than 5,000 pcu/hr), medium-flow level (3,000-5,000 pcu/hr) and low-medium-flow level (lower that 3,000 pcu/hr). The seven days data collection notified that the using of shoulder lane occurred in all flow level and according to the empirical data, most of shoulder lane utilization were appeared in the medium-flow level (3,000-5,000 pcu/ hr). Average shoulder lane utilization on expressway midblock section classified by time of day and flow rate were illustrated in Fig. 5.
0% 5% 10% 15% 20%
06:00:00 09:00:00 12:00:00 15:00:00 18:00:00
A vg . S hou ld er L an e Ut ili za tion (% )
Time of Day
(a) Bangkaew to Teparak
0% 5% 10% 15% 20%
6:00 AM 9:00 AM 12:00 PM 3:00 PM 6:00 PM
A vg . S hou ld er L an e Ut ili za tion (% )
Time of Day
(b) Teparak to Bangmuang
0% 5% 10% 15% 20%
6:00 AM 9:00 AM 12:00 PM 3:00 PM 6:00 PM
A vg . S hou ld er L an e Ut ili za tion (% )
Time of Day
(c) Bangmuang to Pak-Nam
0% 5% 10% 15% 20%
6:00 AM 9:00 AM 12:00 PM 3:00 PM 6:00 PM
A vg . S hou ld er L an e Ut ili za tion (% )
Time of Day
0% 5% 10% 15% 20%
6:00 AM 9:00 AM 12:00 PM 3:00 PM 6:00 PM
A vg . S hou ld er L an e Ut ili za tion (% )
Time of Day
(e) Bangkru to Suksawad Fig. 4.
Average Shoulder Lane Utilization on Expressway Midblock Section during the Time of Day
0% 5% 10% 15% 20% 0 2,000 4,000 6,000 8,000
6:00 AM 9:00 AM 12:00 PM 3:00 PM 6:00 PM A
vg . S hou ld er L a ne Ut ili za tion (% ) Fl o w R at e ( vph )
Time of Day Flow Rate Shoulder Lane Utilization
(a) Bangkaew to Teparak
0% 5% 10% 15% 20% 0 2,000 4,000 6,000 8,000
6:00 AM 9:00 AM 12:00 PM 3:00 PM 6:00 PM A
vg . S hou ld er L a ne Ut ili za tion (% ) Fl o w R at e ( vph )
Time of Day Flow Rate Shoulder Lane Utilization
(b) Teparak to Bangmuang
0% 5% 10% 15% 20% 0 2,000 4,000 6,000 8,000
6:00 AM 9:00 AM 12:00 PM 3:00 PM 6:00 PM A
vg . S hou ld er L a ne Ut ili za tion (% ) Fl o w R at e ( vph )
Time of Day Flow Rate Shoulder Lane Utilization
(c) Bangmuang to Pak-Nam
0% 5% 10% 15% 20% 0 2,000 4,000 6,000 8,000
6:00 AM 9:00 AM 12:00 PM 3:00 PM 6:00 PM A
vg . S hou ld er L a ne Ut ili za tion (% ) Fl o w R at e ( vph )
Time of Day Flow Rate Shoulder Lane Utilization
(d) Pak-Nam to Bangkru
0% 5% 10% 15% 20% 0 2,000 4,000 6,000 8,000
6:00 AM 9:00 AM 12:00 PM 3:00 PM 6:00 PM A
vg . S hou ld er L a ne Ut ili za tion (% ) Fl o w R at e ( vph )
Time of Day Flow Rate Shoulder Lane Utilization
(e) Bangkru to Suksawad Fig. 5.
4.3. Relationship of Shoulder Lane
Utilization and Related Parameters
The lane selection behavior which randomly occurred when motorists were demanding to avoid obstacles or overtaken the lower speed car in the same direction and its involved with numerous factors. In this study, we were focusing on the related parameters contribute to the shoulder lane utilization and in this study the promising parameters were classified to 4 categories as below:
• Categories 1 : The Traffic Stream Parameters
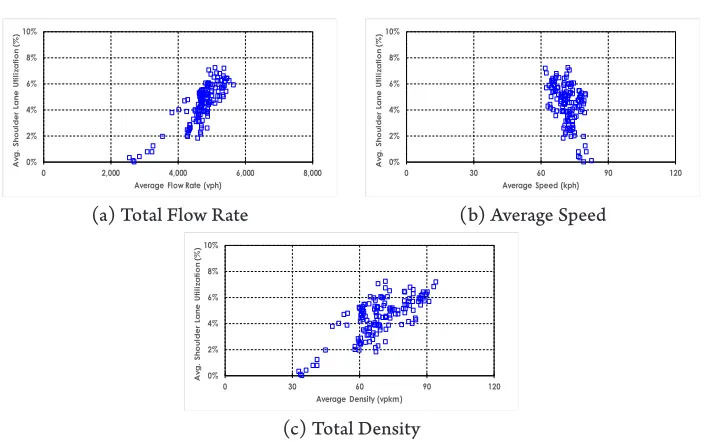
In this study, the three major traffic stream parameters were chosen to investigate the relationship among the shoulder lane utilization. The average value of
shoulder lane utilization and traffic stream parameter from 5 expressway midblock sections could be summarized that; the total flow rate on expressway midblock section were in ranges 2,000-6,000 pcu/hr and dramatically increased along with the proportion of shoulder lane utilization. The average speed on expressway midblock section were in ranges 60-90 km/hr and slightly reduced once the proportion of shoulder lane utilization increased. The total density on expressway midblock section were in ranges 30-90 pcu/km and it dramatically increased in the same way with the total flow. The relationship between shoulder lane utilization on expressway midblock section and each traffic stream parameters were illustrated in Fig. 6.
0% 2% 4% 6% 8% 10%
0 2,000 4,000 6,000 8,000
A
vg
. S
hou
ld
er
L
a
ne Ut
ili
za
tion
(%
)
Average Flow Rate (vph)
(a) Total Flow Rate
0% 2% 4% 6% 8% 10%
0 30 60 90 120
A
vg
. S
hou
ld
er
L
a
ne Ut
ili
za
tion
(%
)
Average Speed (kph)
(b) Average Speed
0% 2% 4% 6% 8% 10%
0 30 60 90 120
A
vg
. S
hou
ld
er
L
a
ne Ut
ili
za
tion
(%
)
Average Density (vpkm)
(c) Total Density Fig. 6.
• Categories 2; Relative Parameters of Adjacent Lane
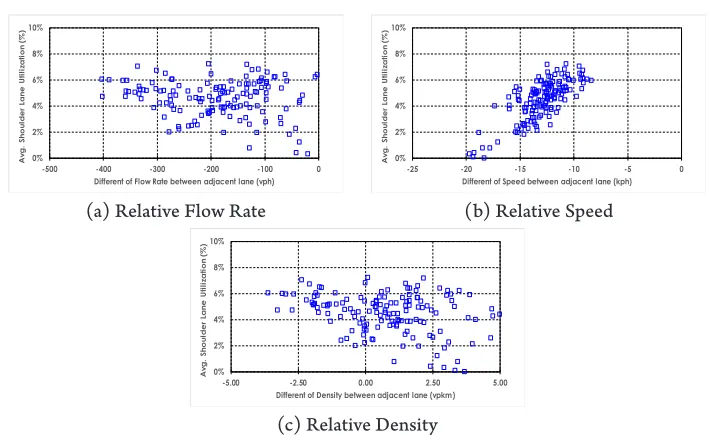
In this study, the three major relative traffic stream parameters on the adjacent lane of shoulder lane were chosen to investigate the relationship among the shoulder lane utilization. The average value of shoulder lane utilization and relative traffic stream parameter from 5 expressway midblock sections could be summarized that; the proportion of shoulder lane utilization seems to be affected by the relative flow rate on adjacent lane and it increased once the flow rate on lane 1 lower than flow rate on lane 2. In term of relative speed on adjacent lane, the result could be concluded that proportion of shoulder utilization likely increased once the speed on adjacent lane not significantly different on each other and in case of relative density on adjacent lane, it also affected in the same way with the total flow. The relationship between shoulder lane utilization on expressway midblock section and each relative traffic stream parameters were illustrated in Fig. 7.
• Categories 3; The Driving Environment In this study, the driving environment was classified to 2 major parameters includ ing average headway and percentage of truck and heavy vehicle in traf f ic. The average value of shoulder lane utilization and driving environmental parameter from 5 expressway midblock sections could be summarized that; the proportion of shoulder lane utilization directly affected by the average headway of vehicle on expressway midblock section and it increased once the average
headway of vehicle on expressway midblock section was shrinking. In case of the affected by the percentage of truck and heavy vehicle, the relationship notified that the fluctuation of shoulder lane utilization occurred once the percentage of truck and heavy vehicle were lower than 20% and it possibly increased once the percentage of truck and heavy vehicle were in ranges 20%-30%. The relationship between shoulder lane utilization on expressway midblock section and the driving environmental parameters were illustrated in Fig. 8.
• Categories 4; The Benefit from Using of Shoulder Lane
0% 2% 4% 6% 8% 10%
-500 -400 -300 -200 -100 0
A vg . S hou ld er L a ne Ut ili za tion (% )
Different of Flow Rate between adjacent lane (vph)
(a) Relative Flow Rate
0% 2% 4% 6% 8% 10%
-25 -20 -15 -10 -5 0
A vg . S hou ld er L a ne Ut ili za tion (% )
Different of Speed between adjacent lane (kph)
(b) Relative Speed
0% 2% 4% 6% 8% 10%
-5.00 -2.50 0.00 2.50 5.00
A vg . S hou ld er L a ne Ut ili za tion (% )
Different of Density between adjacent lane (vpkm)
(c) Relative Density Fig. 7.
Relationship between Shoulder Lane Utilization on Expressway Midblock Section and Relative Parameter from Adjacent Lane
0% 2% 4% 6% 8% 10%
0 10 20 30 40 50
A vg . S hou ld er L a ne Ut ili za tion (% )
Average Headway (sec)
(a) Average Headway
0% 2% 4% 6% 8% 10%
0% 10% 20% 30% 40% 50%
A vg . S hou ld er L a ne Ut ili za tion (% )
Percentage of Truck and Heavy Vehicle (%)
(b) Percentage of Truck or Heavy Vehicle Fig. 8.
Relationship between Shoulder Lane Utilization on Expressway Midblock Section and Driving Environmental 0% 2% 4% 6% 8% 10%
-1.00 -0.50 0.00 0.50 1.00
A vg . S hou ld er L a ne Ut ili za tion (% )
Average Travel Time Saving (min)
Fig. 9.
The correlation analysis in this study was used to quantify the relationship between the dependent and independent parameters. Through the correlation analysis using IBM SPSS Statistic software, we estimated the level of correlation between each parameter regarding to the Pearson correlation coefficient which is the most widely used correlation statistic to measure the degree of linear relationship between related parameters. The range of Pearson correlation coefficient was between -1 and +1 to quantifies the direction and strength of the linear relationship between the 2 parameters. The correlation between 2 parameters could be both positive (+) or negative (-) depend on the direction of the relationship and the correlation as close as ±1.00 indicated
the strength of relationship between 2 parameters.
In this study, we assumed that the shoulder lane selection behavior in each flow level contain with the different factor thus, based on the empirical data the flow level in this study could be classified as 3 level and beyond that the analysis was also considered the 2-tailed significant value between the dependent and independent parameters in order to organize the appropriate parameter for the multiple regression model. After considering the Pearson correlation coefficient, 2-tailed significant value and relationship direction, the correlation analysis result through the IBM SPSS Statistic software in each flow level was shown in Table 2.
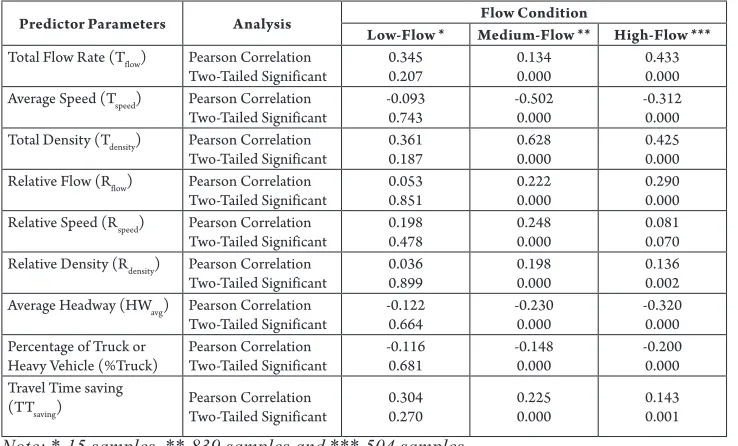
Table 2
The Correlation Analysis of Each Predictor Parameters
Predictor Parameters Analysis Low-Flow * Medium-Flow **Flow Condition High-Flow ***
Total Flow Rate (Tflow) Pearson Correlation
Two-Tailed Significant 0.3450.207 0.1340.000 0.4330.000
Average Speed (Tspeed) Pearson Correlation
Two-Tailed Significant -0.0930.743 -0.5020.000 -0.3120.000
Total Density (Tdensity) Pearson Correlation
Two-Tailed Significant 0.3610.187 0.6280.000 0.4250.000
Relative Flow (Rflow) Pearson Correlation
Two-Tailed Significant 0.0530.851 0.2220.000 0.2900.000
Relative Speed (Rspeed) Pearson Correlation
Two-Tailed Significant 0.1980.478 0.2480.000 0.0810.070
Relative Density (Rdensity) Pearson Correlation
Two-Tailed Significant 0.0360.899 0.1980.000 0.1360.002
Average Headway (HWavg) Pearson Correlation
Two-Tailed Significant -0.1220.664 -0.2300.000 -0.3200.000
Percentage of Truck or
Heavy Vehicle (%Truck) Pearson CorrelationTwo-Tailed Significant -0.1160.681 -0.1480.000 -0.2000.000
Travel Time saving
(TTsaving) Pearson CorrelationTwo-Tailed Significant 0.3040.270 0.2250.000 0.1430.001
The correlation of each predictor on different flow level could be discussed as below:
• Low Flow Level; flow rate lower than 3,000 pcu/hr
The analysis of Pearson correlation coefficient and 2-tailed significant in the low flow level circumstance, the result indicated that within 5 expressway sections and 12 hours of data collection (between 06.00AM-06.00PM), this study captured only 15 samples and there was no significant parameter correlated to the shoulder lane utilization
• Medium Flow Level; flow rate between 3,000-5,000 pcu/hr
The analysis of Pearson correlation coefficient and 2-tailed significant in the medium flow level circumstance, the result indicated that within 5 expressway sections and 12 hours of data collection (between 06.00AM-06.00PM), this study captured 839 samples and the parameter correlated to the shoulder lane utilization in positive direction included the total density, relative speed and travel time saving. On the other hand, the average speed, average headway and percentage of truck and heavy vehicle were correlated to the shoulder lane utilization in negative direction.
• High Flow Level; flow rate higher than 5,000 pcu/hr
The analysis of Pearson correlation coefficient and 2-tailed significant in the high flow level circumstance, the result indicated that within 5 expressway sections and 12 hours of data collection (between 06.00AM-06.00PM), this study captured 504 samples and the
parameter correlated to the shoulder lane utilization in positive direction included the total f low rate, total density and relative flow. Otherwise, the average headway, average speed and percentage of truck and heavy vehicle were correlated to the shoulder lane utilization in negative direction.
The result could be concluded that each flow rate condition of traffic stream affects to the shoulder lane utilization and each flow level has unique characteristic. Considering the correlated direction, the parameter that correlated in positive direction which mean
thatthose of the parameter are directly
related to the shoulder utilization, the higher of the parameter, the greater of the shoulder utilization. Alternatively, the parameter that correlated in negative direction which mean the those of the parameter are inversely related to the shoulder lane utilization.
4.4. Model Development for Shoulder
Lane Utilization
Table 3
The Statistic Value for Simple Linear Regression Model
Model R R Square Adjust R Square Standard Error
Simple Linear Regression 0.519 0.269 0.268 0.039
Coefficients Beta Standard Error t-stat Significant
Constant
Total Density -0.0370.001 0.0040.000 22.169-8.903 0.0000.000
Source: Result of IBM SPSS Statistic software with stepwise analysis
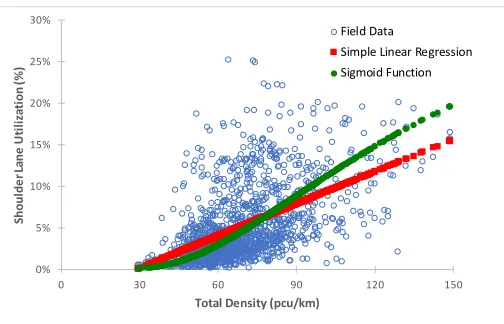
As for sigmoid function modelling, the regression curve estimation and nonlinear function in the IBM SPSS statistic software was used to estimate the appropriate
coefficient through the least square method. The modelling result for sigmoid function could be shown in Table 4.
Table 4
The Statistic Value for Sigmoid Function Model
Model R R Square Adjust R Square Standard Error
S-Curve Estimation 0.561 0.315 0.315 0.079
Nonlinear Coefficients Beta Sum Square Error
Sigmoid Coefficients (θ) 210.064 2.209
Source: Result of IBM SPSS Statistic software with curve estimation analysis
0% 5% 10% 15% 20% 25% 30%
0 30 60 90 120 150
Sh
ou
ld
er
La
ne
U
til
iza
tio
n (
%
)
Total Density (pcu/km)
Field Data
Simple Linear Regression Sigmoid Function
Fig. 10.
Model Fitting of Simple Linear Regression and Sigmoid Function
4.5. Comparison of Shoulder Lane
Utilization Model
In order to validate the performance of the developed model a new set of data collection
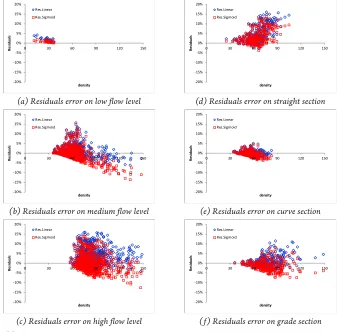
overview of model performance could be concluded that the sigmoid function likely to provide a better fit in term of shoulder lane utilization estimation. Based on the different flow level, the results show that the average residuals error of the estimation from sigmoid function in each flow level lower than the simple linear regression especially in medium flow and high flow level. In case of the different geometry of expressway, the result show that the average residuals error of the estimation from sigmoid function also lower than the simple linear regression
and both of developed model has highly fluctuated in straight section.
However, if we consider in the performance of both models, it proves that both of the proposed model performed reasonably and fitted with low residual errors and could be applied to estimate the shoulder lane utilization in the midblock section of expressways. The residuals error of shoulder lane utilization estimation based on different flow level and geometry of expressway could be described in Fig. 11.
-20% -15% -10% -5% 0% 5% 10% 15% 20%
0 30 60 90 120 150
Re
sidua
ls
density Res.Linear
Res.Sigmoid
(a) Residuals error on low flow level
-20% -15% -10% -5% 0% 5% 10% 15% 20%
0 30 60 90 120 150
Re
sidua
ls
density Res.Linear
Res.Sigmoid
(d) Residuals error on straight section
-20% -15% -10% -5% 0% 5% 10% 15% 20%
0 30 60 90 120 150
Re
sidua
ls
density Res.Linear
Res.Sigmoid
(b) Residuals error on medium flow level
-20% -15% -10% -5% 0% 5% 10% 15% 20%
0 30 60 90 120 150
Re
sidua
ls
density Res.Linear
Res.Sigmoid
(e) Residuals error on curve section
-20% -15% -10% -5% 0% 5% 10% 15% 20%
0 30 60 90 120 150
Re
sidua
ls
density Res.Linear
Res.Sigmoid
(c) Residuals error on high flow level
-20% -15% -10% -5% 0% 5% 10% 15% 20%
0 30 60 90 120 150
Re
sidua
ls
density Res.Linear
Res.Sigmoid
(f) Residuals error on grade section
Fig. 11.
5. Conclusion
This study investigated the characteristic of shoulder lane utilization behavior, identified significant parameters effecting shoulder lane utilization behavior and compared the empirical data with linear regression model and sigmoid function. In summary, the shoulder lane utilization behavior under different flow condition has unique characteristic. The most influenced factors that contributes to shoulder lane utilization was the total density which consistent
with previous studies (Knoop et al., 2010),
(Samoili et al., 2013).
The relationship between the influenced factor and the shoulder lane utilization was found to be nonlinear. By applying the developed models to several locations on expressway, it has been proved that the sigmoid function provides a better performance than the simple linear regression. Even though the comparison revealed that the performance of simple linear regression was worse than the sigmoid function, it provided acceptable result in terms of shoulder lane utilization estimation on the Kanjanapisek Expressway.
The expectation of this study was to understand the driving behavior and gain the knowledge from empirical data which will help the traffic operator come up with appropriate traffic management scheme. It should be noted that this study has focused on the macroscopic scale of discretionary lane change to shoulder lane on expressway midblock section which currently violated to the local law regulation. Development of the proposed model was performed by using empirical data covering only cases
where shoulder lane utilization is under 30%. Further research is needed to develop model for higher shoulder lane utilization.
Acknowledgements
The Ph.D. scholarship was funded by the Expressway Authority of Thailand and this research was partially supported by Graduate College of King Monkut’s University of Technology North Bangkok. The authors would like to thank the Department of Expressway System Engineering Research and Development, Expressway Authority of Thailand for providing the access to the EXAT ITS database system.
References
AASHTO. 2011. A policy on geometric design of highways and streets, 6th edition. American Association of State Highway and Transportation Officials Washington D.C. 912 p.
Amin, M.R.; Banks, J.H. 2005. Variation in freeway lane use patterns with volume, time of day, and location,
Transportation research record 1934(1): 132-139.
Bangarraju, V.S.H.; Ravishankar, K.V.R.; Mathew, V.T. 2016. Analysis of Lateral Distance Keeping Behaviour in Mixed Traffic Conditions with Little Lane Discipline, International Journal for Traffic and Transport Engineering 6(4): 431-443.
Berger, W.; Maurer, P. 1999. Emergency bays versus emergency lanes on motorways–A cost benefit analysis.
In Proceedings of theTraffic Safety on Two Continents–10th
International Conference, 9: 99 p.
Carter, M.; Rakha, H.; Aerde, M.V. 1999. Variability
of traffic-flow measures across freeway lanes, Canadian
Choudhury, C.; Ramanujam, V.; Ben-Akiva, M. 2008.
A lane changing model for urban arterials. In Proceedings
of the 3rd international symposium of transport simulation,
Gold Coast, Australia.
Daganzo, C.F. 2002a. A behavioural theory of multi-lane traffic flow. Part I: Long homogenous freeway
sections, Transportation Research Part B: Methodological
36(2):131-158.
Daganzo, C.F. 2002. A behavioral theory of multi-lane traffic flow. Part II: Merges and the onset of congestion,
Transportation Research Part B: Methodological 36(2):
159-169.
Duret, A.; Ahn, S.; Buisson, C. 2012. Lane f low distribution on a three-lane freeway: General features
and the effects of traffic controls, Transportation research
part C: emerging technologies 24: 157-167.
Expressway Authority of Thailand, 2017. Statistics Data. Available from internet: <http://new.exat.co.th/index. php/th/statistics.html>.
Expressway Authority of Thailand, 2017. EXAT ITS database system.
Fwa, T.F.; Li, S. 1995. Estimation of lane distribution of
truck traffic for pavement design, Journal of transportation
engineering 121(3): 241-248.
Gunay, B. 2004. An investigation of lane utilisation on
Turkish highways. In Proceedings of the Institution of Civil
Engineers-Transport, 157(1): 43-49.
Gunay, B. 2007. Car following theory with lateral
discomfort, Transportation Research Part B: Methodological
41(7): 722-735.
Gunay, B. Erdemir, G. 2011. Lateral analysis of
longitudinal headways in traffic flow, International Journal
Of Engineering & Applied Sciences 3(2): 90-100.
HCM, 2010. Highway Capacity Manual. Washington, D.C.
Heidamann, D. 1994. Distribution of traffic to the individual lane on multilane unidirectional roadways.
In Proceedings of the Second International Symposium
on Highway Capacity, 1: 265-275.
Hollis, E.; Evan, R. 1976. Motorway traffic patterns. Transportation Research Laboratory. UK.
Hurdel, V.; Merlo, M.; Robertson, D. 1997. Study of speed-flow relationships on individual freeway lanes,
Transportation Research Record 1591(1): 7-13.
Kellermann, G., 2000. Experience of using the hard
shoulder to improve traffic flow, Traffic Engineering and
Control 41(10): 412-414.
Knoop, V.L.; Duret, A.; Buisson, C.; Van Arem, B. 2010. Lane distribution of traffic near merging zones
influence of variable speed limits. In Proceedings of the 13th
International IEEE Conference on Intelligent Transportation
Systems, 485-490.
Lee, J.; Park, B.B. 2010. Lane flow distributions on basic segments of freeways under different traffic conditions. Washington, DC. Transportation Research Board, No. 10-1947.
Lueanpech, P.; Rongviriyapanich, T. 2017. Modelling of
shoulder lane utilization for expressway. In Proceedings
of the International Congress on Engineering and Information,
49-62.
Mirshahi, M.; Obenberger, J.; Fuhs, C.A.; Howard, C.E.; Krammes, R.A.; Kuhn, B.T.; Mayhew, R.M.; Moore,
M.A.; Sahebjam, K.; Stone, C.J.; Yung, J.L. 2007. Active
traffic management: the next step in congestion management.
United States. Federal Highway Administration. No. FHWA-PL-07-012.
Moriyama, Y.; Mitsuhashi, M.; Hirai, S.; Oguchi, T. 2011. The effect on lane utilization and traffic capacity
of adding an auxiliary lane, Procedia-Social and Behavioral
Sciences 16:37-47.
Nezamuddin, N.; Jiang, N.; Zhang, T.; Waller, S.T.;
Sun, D. 2011. Traffic operations and safety benefits of active
traffic strategies on TXDOT freeways. FHWA. No. FHWA/
TX-12/0-6576-1.
Okura, I.; Somasundaraswaran, K., 1996. Analysis of traffic distribution in three lane unidirectional freeway,
Journal of Infrastructure Planning Review (13): 885-892.
Pompigna, A.; Rupi, F. 2017. Lane-distribution models and related effects on the capacity for a
three-lane freeway section: Case study in Italy, Journal of
Transportation Engineering, Part A: Systems, 143(10).
p.05017010.
Richards, P. 1956. Shocks waves on highway, Operations
Research 4(1): 42-51.
Royal Thai Police Department. 1979. Land Traffic Act.
Samoili, S.; Efthymiou, D.; Antoniou, C.; Dumont, A. 2013. Lane f low distribution investigation of hard shoulder running freeway. Washington DC. Transportation Research Board.
Turner, D.J. 1983. Traffic characteristics of a rural
motorway, Traffic Engineering & Control 24(HS-035
427): 248-251.
Wu, N. 2006. Equilibrium of lane flow distribution on
motorways, Transportation Research Record: Journal of the
Transportation Research Board (1965): 48-59.
Wu, N. 2009. Further Development of the German
Highway Capacity Manual (HBS2011). In Proceedings
of theICCTP 2009: Critical Issues In Transportation Systems
Planning, Development, and Management, 1-6.
Xiao, C.; Shao, C.; Meng, M.; Wang, P.; Wang, B. 2014. Lane flow distribution of a long continuous highway,