VOICE COMMAND RECOGNITION
SYSTEM BASED ON MFCC AND DTW
ANJALI BALA*
Kurukshetra University, Department of Instrumentation & Control Engineering., H.E.C* Jagadhri, Haryana,135003, India
ABHIJEET KUMAR
Mullana University, Department of Electronics and Comm. Engineering., M.M.E.C Mullana, Haryana, 133203, India
NIDHIKA BIRLA
Kurukshetra University, Department of Electronics Engineering., H.E.C Jagadhri, Haryana, 135003, India
[email protected] Abstract:
The Voice is a signal of infinite information. Digital processing of speech signal is very important for high-speed and precise automatic voice recognition technology. Nowadays it is being used for health care, telephony military and people with disabilities therefore the digital signal processes such as Feature Extraction and Feature Matching are the latest issues for study of voice signal. In order to extract valuable information from the speech signal, make decisions on the process, and obtain results, the data needs to be manipulated and analyzed. Basic method used for extracting the features of the voice signal is to find the Mel frequency cepstral coefficients. Mel-frequency cepstral coefficients (MFCCs) are the coefficients that collectively represent the short-term power spectrum of a sound, based on a linear cosine transform of a log power spectrum on a nonlinear mel scale of frequency.This paper is divided into two modules. Under the first module feature of the speech signal are extracted in the form of MFCC coefficients and in another module the non linear sequence alignment known as Dynamic Time Warping (DTW) introduced by Sakoe Chiba has been used as features matching techniques. Since it’s obvious that the voice signal tends to have different temporal rate, the alignment is important to produce the better performance. This paper presents the feasibility of MFCC to extract features and DTW to compare the test patterns.
Keywords: Feature extraction; Feature matching; Mel frequency cepstral coefficient (MFCC).
1. Preface
Voice recognition allows you to provide input to an application with your voice. Just like clicking With mouse, typing on the keyboard, or pressing a key on the phone keypad provides input to an application, voice recognition system provide input by talking. In the desktop world, you need a microphone to be able to do this. In the Voice XML world, all you need is a telephone. The voice recognition process is performed by a software component known as the speech recognition engine. The primary function of the voice recognition engine is to process spoken input and translate it into text that an application understands. When the user says something, this is known as an utterance. An utterance is any stream of speech between two periods of silence. Utterances are sent to the speech engine to be processed then human voice is converted into digital signal form to produce digital data representing each level of signal at every discrete time step. The digitized speech samples are then processed using MFCC to produce voice features. After that, the coefficient of voice features can go through DTW to select the pattern that matches the database and input frame in order to minimize the resulting error
ANJALI BALA,
between them. The popularly used cepstrum based methods to compare the pattern to find their similarity are the MFCC and DTW. The MFCC and DTW features techniques can be implemented using MATLAB [7.0] This system act as means of security measures to reduce cases of fraud and theft due to its use of physical characteristics and traits for the identification of individuals. The earliest methods of biometric identification included fingerprint and handwriting while more recent ones include iris/eye scan, face scan, voice print, and hand print. Voice recognition and identification technology focuses on training the system to recognize an individual’s unique voice characteristics (i.e., their voice print). The technology lends itself well to a variety of uses and applications, including security access control for cell phones (to eliminate cell phone fraud), ATM manufacturers (to eliminate pin # fraud) and automobile manufacturers (to dramatically reduce theft and carjacking). Here, we are going to present an implementation of a security system based on voice identification as the access control key.
2. Principle of Voice Recognition
Basic principles of Voice Recognition are as follows:
2.1. Feature extraction (MFCC)
The extraction of the best parametric representation of acoustic signals is an important task to produce a better recognition performance. The efficiency of this phase is important for the next phase since it affects its behavior. MFCC is based on human hearing perceptions which cannot perceive frequencies over 1KHz. In other words, MFCC is based on known variation of the human ear’s critical bandwidth with frequency. MFCC has two types of filter which are spaced linearly at low frequency below 1000 Hz and logarithmic spacing above 1000Hz. A subjective pitch is present on Mel Frequency Scale to capture important characteristic of phonetic in speech. The overall process of the MFCC is shown in Fig 1.
2.1.1. Pre-emphasis
Pre-emphasis refers to a system process designed to increase, within a band of frequencies, the magnitude of some (usually higher) frequencies with respect to the magnitude of the others(usually lower) frequencies in order to improve the overall SNR. Hence, this step processes the passing of signal through a filter which emphasizes higher frequencies. This process will increase the energy of signal at higher frequency.
2.1.2. Framing
The process of segmenting the speech samples obtained from an ADC into a small frame with the length within the range of 20 to 40 msec. The voice signal is divided into frames of N samples. Adjacent frames are being separated by M (M<N).Typical values used are M = 100 and N= 256.
Fig1: MFCC Block Diagram
2.1.3. Hamming windowing
Hamming window is used as window shape by considering the next block in feature extraction processing chain and integrates all the closest frequency lines. The Hamming window is represented as shown in “Eq. (1)”. If the window is defined as W (n), 0 ≤ n ≤ N-1 where
N = number of samples in each frame Y[n] = Output signal
Mel spectrum Magnitude Spectrum Mel spectrum
Windowing
DFT
Mel
Filter
Bank
DCT
Data energy
and
Spectrum
Pre-Emphasis
Framing
Voice input
X (n) = input signal
W (n) = Hamming window, then the result of windowing signal is shown below:
Y[n] =X (n)*W (n) (1) 2.1.4. Fast fourier transform
To convert each frame of N samples from time domain into frequency domain FFT is being used. The Fourier Transform is used to convert the convolution of the glottal pulse U[n] and the vocal tract impulse response H[n] in the time domain. This statement supports as shown in “Eq. (2)” below:
Y(w)=FFT[h(t)*X(t)]=H(w)*X(w) (2) If X (w), H (w) and Y (w) are the Fourier Transform of X (t), H (t) and Y (t) respectively.
2.1.5. Mel filter bank processing
The frequencies range in FFT spectrum is very wide and voice signal does not follow the linear scale. Each filter’s magnitude frequency response is triangular in shape and equal to unity at the Centre frequency and decrease linearly to zero at centre frequency of two adjacent filters.
Then, each filter output is the sum of its filtered spectral components. After that the following equation as shown in “Eq. (3)” is used to compute the Mel for given frequency f in HZ:
F (Mel ) =[2595 * log 10[1+ f /700] (3) 2.1.6. Discrete cosine transform
This is the process to convert the log Mel spectrum into time domain using DCT. The result of the conversion is called Mel Frequency Cepstrum Coefficient. The set of coefficient is called acoustic vectors. Therefore, each input utterance is transformed into a sequence of acoustic vector.
2.1.7. Delta energy and delta spectrum
The voice signal and the frames changes, such as the slope of a formant at its transitions. Therefore, there is a need to add features related to the change in cepstral features over time. 13 delta or velocity features (12 cepstral features plus energy), and 39 features a double delta or acceleration feature are added. The energy in a frame for a signal x in a window from time sample t1 to time sample t2, is represented as shown below in “Eq. (4)”.
Energy=∑ X 2[t] (4)
Where X[t] = signal
Each of the 13 delta features represents the change between frames corresponding to cepstral or energy feature, while each of the 39 double delta features represents the change between frames in the corresponding delta features.
2.2. Feature matching (DTW)
DTW algorithm is based on Dynamic Programming. This algorithm is used for measuring similarity between two time series which may vary in time or speed. This technique also used to find the optimal alignment between two times series if one time series may be “warped” non-linearly by stretching or shrinking it along its time axis. This warping between two time series can then be used to find corresponding regions between the two time series or to determine the similarity between the two time series. To align two sequences using DTW, an n-by-m matrix where the (ith, jth) element of the matrix contains the distance d (qi, cj) between the two points qi
and cj is constructed. Then, the absolute distance between the values of two sequences is calculated using the Euclidean distance computation as shown in “Eq. (5)”.
d (qi,cj) = (qi - cj)2 (5)
Each matrix element (i, j) corresponds to the alignment between the points qi and cj. Then, accumulated distance is measured by “Eq. (6)”.
3. System Design
The purposed Voice recognition system has been divided into two modules. 3.1 First module: Feature extraction
The waveform of the speech signal is as shown in the Fig.2
Fig.2.Speech Signal
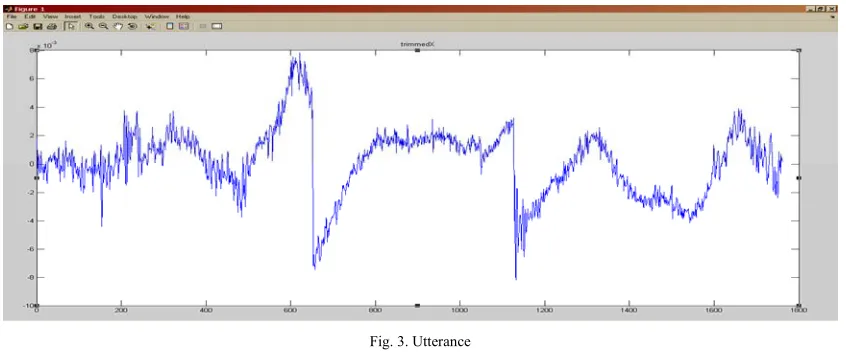
Silence has been removed from the signal with the help of the zero crossing rate and energy vector. Two energy threshold i.e. lower & upper thresholds are calculated. If the energy level of the signal is beyond or less than the max or min threshold that signal is considered as noise or silence and hence removed .The required signal obtained is known as utterance as shown below in the Fig.3.
Fig. 3. Utterance
Fig4. Framing and Filtering
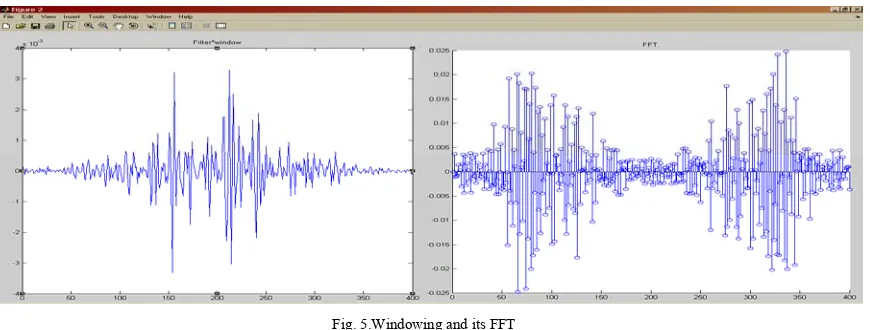
Now this filtered signal is passed through the hamming window and then to convert this time domain signal into frequency domain its 400 point FFT has been found as shown in the Fig.5.
Fig. 5.Windowing and its FFT
Further this signal is passed through mel bank having 24 filters, length of the FFT is 512, sampling frequency used is 16000hz and then Sparse matrix containing the filter bank amplitudes is calculated and with its help spectrum as shown in Fig.6 is obtained which is the highest and lowest filters taper down to zero.
Fig.6. Mel bank processing and Spectrum obtained.
Fig.7.Discrete Cosine transform of the frame.
3.2 Second module: Feature matching
In this module, MFCC coefficients of both the speech signals are compared using the concept of dynamic time warping This algorithm is for measuring similarity between two time series which may vary in time or speed. This technique also used to find the optimal alignment between two times series if one time series may be “warped” non-linearly by stretching or shrinking it along its time axis.
Fig .8 shows the comparison of two same speech signals spoken by the same person i.e. cost=0
Fig.8. Comparison of two different speech signals
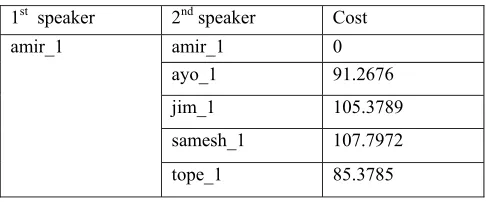
In Fig. 9 the comparisons of two same speech signals spoken by two persons have been shown. Cost value is 107.7972.
4. Results
The input voice signals of different and same speakers have been taken and compared. The results obtained are as shown in the Table I, II, III, IV and V.
Table I. Comparison of speech signals.
1st speaker 2nd speaker Cost
amir_1 amir_1 0 ayo_1 91.2676 jim_1 105.3789 samesh_1 107.7972 tope_1 85.3785
Table II. Comparison of speech signals
1st speaker 2nd speaker Cost
amir_2 amir_2 0
ayo_2 87.2778 jim_2 103.3592 samesh_2 114.7793 tope_2 83.1948
Table III.Comparison of speech signals
1st speaker 2nd speaker Cost
amir_3 amir_3 0
ayo_3 65.8785 jim_3 103.5592 samesh_3 119.3736 tope_3 67.2613
Table IV. Comparison of speech signals
1st speaker 2nd speaker Cost
amir_4 amir_4 0
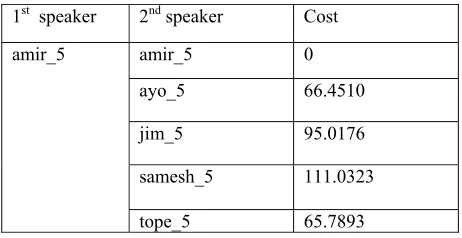
Table V. Comparison of speech signals
1st speaker 2nd speaker Cost
amir_5 amir_5 0
ayo_5 66.4510 jim_5 95.0176 samesh_5 111.0323 tope_5 65.7893
5. Conclusion
This paper has discussed two modules used for voice recognition system which are important in improving its performance. First module provides the information that how to extract MFCC coefficients from the voice signal and second module endow with the algorithm that how to compare or match them with the already fed user’s voice features using DTW (dynamic time warping technique).
These both algorithms have been worked out for same speech signals as well as for different speech signals and it have been found that if both speech signals are same the cost will be 0 and if speech signal are of different voices then cost will definitely have some value which shows the mismatching of the signals.
References
[1] Christopher Hale, CamQuynh Nguyen,“Voice Command Recognition Using Fuzzy Logic” ,Motorola, Austin, Texas 78735, pp 608-613,ISBN no: 0-7803-2636-9.
[2] Hubert Wassner and Gerard Chollet, “New Time Frequency Derived Cepstral Coefficients For Automatic Speech Recognition”, 8th European Signal Processing Conference (Eusipco'96).
[3] Marco Grimaldi and Fred Cummins,“Speaker Identification Using Instantaneous Frequencies” ,IEEE Transactions On Audio, Speech, And Language Processing, VOL. 16, NO. 6, pp 1097-1111, ISBN: 1558-7916, August 2008.
[4] Mahdi Shaneh and Azizollah Taheri, “Voice Command Recognition System Based on MFCC and VQ Algorithms” ,World Academy of Science, Engineering and Technology 57 2009, pp 534-538.
[5] Muda Lindasalwa, Begam Mumtaj and Elamvazuthi I.,“ Voice Recognition Algorithms using Mel Frequency Cepstral Coefficient (MFCC) and Dynamic Time Warping (DTW) Techniques”, Journal Of Computing, Volume 2, Issue 3, pp 138-143, ISSN 2151-9617, March 2010.
[6] Norhaslinda Kamaruddin and Abdul Wahab, “Speech Emotion Verification System (Sevs) Based On Mfcc For Real Time Applications”, School of Computer Engineering, Nanyang Technological University, Nanyang Avenue, Singapore 639798.
[7] Paulraj M P1, Sazali Bin Yaacob1, Ahamad Nazri2 and Sathees Kumar1,“Classification of Vowel Sounds Using MFCC and Feed Forward Neural Network” ,5th International Colloquium on Signal Processing & Its Applications (CSPA), pp 60 -63, ISBN: 978-1-4244-4152-5, March 2009.
[8] Robert D. Hoyle and David D. Falconer, A Comparison of Digital Speech Coding Methods for Mobile Radio Systems”,IEEE Journal On Selected Areas in Communications, VOL. SAC-5, NO. 5. pp 915-920, ISBN: 0733-8716/87/0600-09, June 1987.
[9] Rozeha A. Rashid, Nur Hija Mahalin, Mohd Adib Sarijari and Ahmad Aizuddin Abdul Aziz, “Security System Using Biometric Technology: Design and Implementation of Voice Recognition System (VRS)”,Proceedings of the International Conference on Computer and Communication Engineering, pp 898-902, ISBN :978-1-4244-1692-9, May 2008.