ECG Classification and Abnormality
Detection using Multimodal Decision
Learning Algorithm
G. RAJENDER NAIK
Department of Electrical & Electronics Engineering,
Kakatiya Institute of Technology & Science, Warangal, Telangana, India, [email protected]
ASHOKA REDDY KOMALLA
Department of Electronics & Communication Engineering, Kakatiya Institute of Technology & Science, Warangal, Telangana, India
Abstract - Heart Signals are the base for comprehensive analysis of the functioning of heart. These signals contain massive information related to condition of the heart and the major work stands in appropriate analysis to classify the signal for suitable diagnosis in abnormal cases. Many soft-computing based techniques were proposed for classification of ECGs like artificial neural networks, neuro-fuzzy algorithms, support vector machines and were found to be reliable in correct classification of ECGs. This work proposes a new algorithm called Multimodal Decision Learning for classifying the electrocardiogram signals. It is pre-programmed for training the proposed model using various soft-computing techniques to detect five classes of heart conditions like Normal Sinus Rhythm (NSR), Idioventricular Tachycardia (IVT), Ventricular Trigeminy (VTR), Second Degree AV Block (SDB) and Ventricular Bigeminy (VBG). Test signals are taken from MIT-BIH database and the analysis is carried out by the proposed algorithm for detecting the above listed classes. The performance of the proposed method is evaluated on several normal and abnormal ECG signals from 48 recordings of the arrhythmia database. The average accuracy of the proposed algorithm is found to be 93.33%, 95.83%, 93.33%, 95.83% and 97.91% respectively for NSR, IVT, VTR, SDB and VBG signals. The results establish the efficacy of the proposed classification algorithm.
Keywords: ECG, Classification, Artificial Neural Networks, Adaptive Neuro-Fuzzy Algorithm, Multimodal Decision Learning Algorithm, Soft-Computing Techniques.
1. Introduction
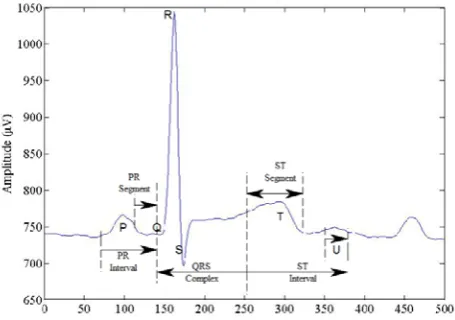
An Electrocardiogram (ECG) is an electrical manifestation of contractile activity of the heart [1]. Due to ionic current flow, the cardiac fibers respond to contract and relax subsequently. Thus, a time variant periodic signal is generated. The ECG can be treated as a quasi-periodic signal. The ECG is analyzed to identify various heart abnormalities. ECG signal analysis techniques consist of pre-processing, feature extraction, optimization, and classification. The ECG waveform is represented as a signal composed of five basic waves of P, Q, R, S, T and additional wave of U. The typical ECG waveform is shown in Figure 1.
Mostly, the shape of QRS complex is analyzed in ECG signal to determine the cardiac pathologies [2]. The morphology of ECE beats changes with the cardiac pathologies and looks different from person to person
Before it is being put for analysis, the ECG is processed as it is a weak signal with low frequency. The ECG signal processing is done to improve diagnosis of various cardiac pathologies. The issues in ECG analysis are beat detections, data compression, noise reduction, classification, feature extraction, and signal separation [3]. Thus, important tools are required to address these issues.
Noise reduction– It is data compression which reconstructs the original signal with a set of eigenvectors. Thus, the noise is reduced effectively with muscular origin.
Classification – The normal sinus beats are differentiated from abnormal waveform such as ventricular beats by classification of waveform morphologies in arrhythmia.
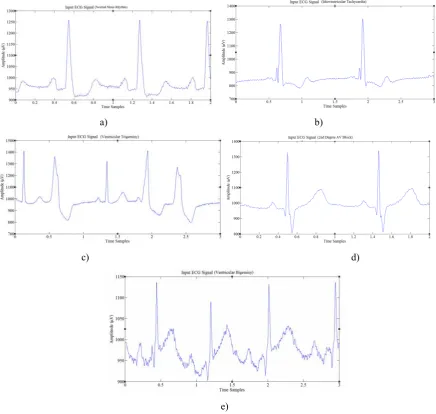
Optimization – Optimization is used for filter or array design in signal processing to select weights or parameters from a linear algorithm. Here, the nonlinear processing is carried out on the signal itself. Due to noise in the signal, the system is required to remove unwanted pattern in the signal [4]. The system is used to perform sensible compression, denoising, image classification, and fault detection for improved analyzing of ECG signal. In the field of clinical diagnosis and biomedical, the analysis of ECG signals with powerful and advanced methodologies is becoming more and more a required tool for healthcare providers. In this paper, five classes of heart conditions namely Normal Sinus Rhythm (NSR), Idioventricular Tachycardia (IVT), Ventricular Trigeminy (VTR), Second Degree AV Block (SDB) and Ventricular Bigeminy (VBG). Few cycles of normal and different abnormal ECGs are shown in figure 2 (a) through (e).
a) b)
c) d)
e)
2.Preprocessing
In a typical ECG signal analysis system, the preprocessing is done to reduce the artifacts from ECGs. Normally, the contamination is created on recorded ECG signal with similar characteristics as the ECG signal itself by manifesting noise and artifacts within the frequency band of interest [5].The ECG contaminants [6] include power-line interference, motion artifacts of patient-electrode, muscle noise, breathing pattern, contact noise or electrode pop, baseline wandering, electrocardiograph (ECG) noise. The useful information from the noisy ECG signals is extracted by processing the recorded ECG signals. Mostly, the baseline wandering and power line interference noises significantly affect ECG signal analysis. These two noises are narrowband noise while other noises are wideband to change the ECG signal. The bandwidth for narrow-band noise is less than 1Hz and centered at 60Hz. Generally, the power line interference is removed by using ECG signal acquisition hardware but the other wideband noises and baseline wandering noises cannot easily suppress by hardware equipment [7]-[8].
(a) (b)
(c) (d)
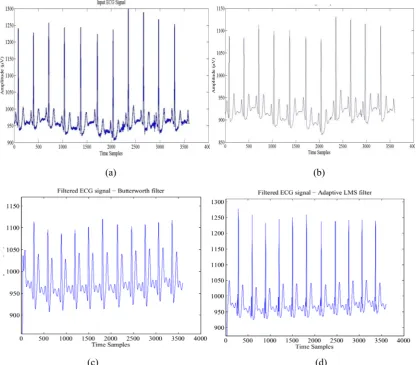
Figure 3. Preprocessing ECG signal for noise reduction: Contaminated ECG in (a) and filtered ECG using FIR low pass filter in (b), Butterworth filter in (c) and adaptive LMS filter in (d).
As an example case, a typical contaminated ECG is taken from MIT-BIH database and various traditional filtering techniques [9]-[12] are used for the filtering out the noise from ECG signal. Figure 3 depicts the filtered ECG signal by different filters. In filtered ECG signal by using adaptive LMS filter the noise components are also included in filtering process. The processed ECG signal is used in feature extraction and classification.
3.Feature Extraction
developed for automatic feature extraction of ECG signals. The ECG signal is divided into time-frequency representation and the most important parameters are taken for the analysis. Then, the extracted features are applied as the input for the classifier to identify the heart disease. There are various issues in existing feature extraction methods. The Karhunen Loeve transform (KLT) is too sensitive for the noisy patterns of ECG signal [13].The Wavelet transform requires higher computations due to the calculation wavelet transform [14]. It has limited accuracy for analyzing the ECG features in higher frequency noise and the ECG signal is affected by the harmful base line drift. The independent component analysis (ICA) method has complicated separation between the paced beat (PB) and premature ventricular contraction (PVC) due to the inverted T wave. The Hermitian based feature extraction method produces small error that leads to misdiagnosis [15]. The support vector machine (SVM) can detect the QRS complex and RR intervals only, the P wave, and T wave cannot be detected [16].
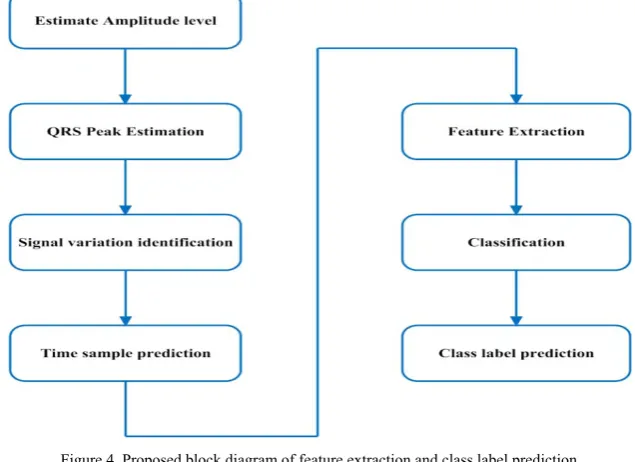
In this work, an integrated peak analyzer [17]-[18] based method is developed to extract the feature set based on the estimation of the peaks. In this work, a set of 30 features are extracted based on the peak estimations of QRS and PQRS plots. Figure 4 depicts the block diagram of the proposed Feature Extraction method. The filtered signal is analyzed for estimating the amplitudes of all peaks thereby the peak region (QRS point) is predicted in the sample stage. In the integrated peak analyzer, the positive peak region (R) for every sampling frequency is estimated.
Then, the minimum value of ECG signal for each ‘R’ peak point value is calculated. In the signal, the left minimum is represented as the ‘Q’ point and the right minimum is represented as the ‘S’ point. From this values QRS peak point estimation, the feature vectors are collected to represent the signature of ECG signal. The peak of the QRS complex is used to measure the length of the intervals between ‘R’ waves of consecutive heart beats. The temporal features and morphological features are extracted from the QRS complex. Further analysis is carried out by studying the signal variations. For no variations, the individual time samples are predicted among all the intervals of PQRST values. Based on the peak estimations and time samples, features are extracted for the classification of ECG signal. The class label prediction indicates, whether the recorded ECG signal is ‘normal’ or ‘abnormal’
Figure 4. Proposed block diagram of feature extraction and class label prediction
3.1. Basic QRS detection rule: The QRS detection rule used is as follows
Ignore all peaks that is preceded or followed by the large peak by less than a waiting time. If the peak is larger than the detection threshold, then it is denoted as QRS complex otherwise it is
considered as noise.
If no QRS is detected within R to R intervals, then there is a peak greater than the half detection threshold. Then the peak is classified as QRS complex through the back searching mechanism. The Interpolated peak location is calculated from the equation (1),
∗ ∝
, (1)
(2) where,
α – Starting edge of parabola of the signal. - Peak amplitude edge of Signal.
- Finishing edge of parabola of the signal.
The above parameters are calculated from the transformation signal with the result of Filtering method. In this peak analysis, peaks are calculated from the amplitude and time samples of input signal. The parameters of α, and can be calculated from the ‘P’ variable and checks the condition of peak from peak magnitude as a thresholding of peak estimation. If ‘P’ is greater than , then it is noted as the peak range in that sampled size of signal. From the parameters values of α, , , the QRS peak values are estimated as , , and .
→ 1 ; (3)
→ 1 ; (4)
→ 1 ; (5)
Database: The MIT-BIH arrhythmia database is utilized in this research, which encompasses 48 half hour extracts of two channel ambulatory ECG recordings acquired from 47 patients. This dataset is collected from 60% inpatients and 40% outpatients at Boston’s Beth Israel hospital.
3.2. ECG Features and their specifications
An ECG signal contains multiple ECG beats and every individual ECG beat contains P- wave, QRS complex, and T-wave. Each peak points (indicated by P, Q, R, S, T, and U), intervals (PR, RR, QRS, ST, and QT) and two segments (PR and ST) of ECG waveforms have their normal amplitudes or duration values. These peak points, intervals, and segments are called as ECG features. Fig 1 shows these labeled features for a single ECG cardiac cycle, which are described in Table.1 along with their description and their specifications.
Table.1 Basic ECG Features and their normal specifications [19]
Feature Description Duration
RR interval between two corresponding R and R waves 0.6s-1.2 s P first short upward movement of the ECG tracing 80ms
PR measured from the starting point of the P wave to the beginning of the QRS complex 120-200 ms
QRS generally begins with a downward deflection Q, a larger upwards deflection R and ends with a downward S wave 80-120 ms
J-point The point at which the QRS complex finishes and the ST segment begins is called J-point Not Applicable
T normally a modest upward waveform 160 ms
ST measured from the J point to the end of the T-wave 320 ms QT measured from the starting point of the QRS complex to the end of the T wave 420 ms
U normally has low amplitude and often it is completely absent Not Specified
In addition to the above listed generalized features of ECG signal, in this work, the following additional feature set is derived based on the peak estimations, regular intervals of the corresponding beats using integrated peak analyzer: (1) Entropy, (2) Approximate Entropy, (3) Largest Lyapunov Exponent (LLE),(4) Detrended Fluctuation Analysis (DFA), (5) Laminarity, (6)Trapping Time,(7) R to R point, (8) T1 (Upper peak time), (9) T2 (Lower peak time),(10) Q-Points, (11) R-Points, (12) S-Points, (13) Average of Q-Points,(14) Average of R-Points, (15) Average of S-Points, (16) SD of Q-Points,(17) SD of R-Points, (18) SD of S-Points, (19) Variance of Q-Points,(20) Variance of R-Points and (21) Variance of S-Points
Figure.5 QRS peak estimation Figure.6 PQRS peak estimation
4. Challenges and Issues in ECG Signal Classification
The major challenges in classification of ECG signals are lack of standardization of ECG features, individuality and variability of the selected features, accurate selection of the extracted features, sensitivity and selectivity of the classifiers, time-to-time variations in ECG waveforms of the patients, non-existence of optimal classifier rules for accurate classification and selection of the appropriate classifier.
Many researchers proposed various methods from the beginning of pre-processing stage till the classification of ECGs. In [20], features were extracted using RR intervals and R point locations by using DWTs. Pre-processing was carried out using FCM and the final classification was done by using multi layer perceptron neural network and they achieved an accuracy of 99.99%. H. Khorrammi et al. [21] have extracted features using RR interval using DWT and compared the MLPNN classification results with SVM. F. Naima et al. [22] have extracted the features based on R locations and RR intervals using Db4 DWTs. Back propagation algorithm was used for training and they achieved an accuracy of 95%. In [23], RR interval is calculated manually from the MIT-BIH database. Classification was done using MLPNN and SVM and compared the performances of both the classifiers. Results proved that MLPNN is good for classifying ECG while SVM shows good training performance.
In this work, feature extraction is carried out using Integrated Peak Analyzer (IPA) method, feature reduction is carried out by using Intensity Weighted Firefly Optimization (IWFFO) [24] and classification is done using Multimodal Decision Learning algorithm (MDL) [25]-[26]. Two basic classes ‘normal’ and ‘abnormal’ are the basic labels identified primarily and the work is extended for further ‘abnormal’ classifications as Idioventricular Tachycardia (IVT), Ventricular Trigeminy (VTR), Second Degree AV Block (SDB) and Ventricular Bigeminy (VBG). Their basic characteristics are shown in figure.1 (a – e).
5. Proposed Method: Multimodal Decision Learning Algorithm
We proposed a method called multimodal decision learning (MDL) method for classification of beats. It uses a novel kernel model for classifying the beat as NORMAL or ABNORMAL.
Analysis of MDL method:
Let ‘Lt’ be the size of the feature dataset where t=1,2,3,……….and let the training data be Tr.
After initializing row size and column size of the feature dataset, let the first feature be
O
y
x
L
T
L
1
r1 t(
,
)
(6)where O is defined as offset parameter.
Now let us define a kernel function
(
x
)
for linear to non-linear mapping. For the total dataset size, defineI=1,2,3…………size of Lt and j=1,2,3…….size of Tr
ij r
ij ij
rij
K
T
x
T
1
(
)
(7)
Where,
T
rij is the training feature with some neighboring link parameter
ij
Nii Trj Tri Trj Tri i n r
e
N
T
P
1 2 ) ( ) ( 2 / 1 2 11
2
1
)
(
(8)And
))
(
rRC
Lb
PT
Rt
(9)Where, R is the classified result.
In this work we classified five class labels which include one normal and four abnormal beats. 6. Results and Discussion
A set of 48 ECG recordings from MIT-BIH [27] arrhythmia database (i.e., 100 to 109, 111 to 119, 121, 122, 123, 124, 200 to 210, 212, 213, 214, 215, 217, 219 to 223 and 228 to 231) and more than 200 ECG recordings from other database of MIT-BIH were chosen for processing and training the proposed learning algorithm. Each ECG signal is having duration of 30 minutes with 3600 beats. In this work, a new learning algorithm called Multimodal Decision Learning algorithm is proposed for classification of ECG signals by considering five class labels as listed above.
Simulation is carried out by selecting many random samples from MIT-BIH ECG Arrhythmia database. The filtered signal is further processed for feature extraction and best feature selection. The selected set of best features is used for learning mechanism as specified for exact classification of the signal to be normal or abnormal. The selected data from the database was a normal raw ECG signal and after preprocessing it, the label is indicated as a dialogue box as shown in the fig.7 and the signal with the annotation ‘114.dat’ is an abnormal signal as indicated in fig 8.
Fig.7 Normal Signal Fig.8 Abnormal Signal
6.1.Abnormal Class Labels
The classification results of the proposed MDL method are presented here under.
6.1.1. Normal Sinus Rhythm (NSR)
Sinus rhythm refers to the electrical activity received from the sinus node — sinoatrial node or SA node. This results in an upright P wave in lead II on the ECG. Normal pacemaking impulses arise from the SA node and are transmitted to ventricles via the AV node resulting in regular, narrow-complex heart system at 60 – 100 bpm. Each QRS complex is preceded by a normal P-wave and P-waves should be upright in leads I and II. The PR interval remains constant and QRS complexes are less than 100 ms wide [28].
Table.2 NSR Specifications
Feature Duration Amplitude 0.05 mV to 0.5 mV
Baseline NSR 80 bpm
Waveform Selection Adult – 80 ms Paediatric – 40 ms Superimposed Artifact 50 and 60 Hz
PR 0.16 sec
ST segment elevation -0.8 mV to +0.8 mV
Table.3 Normal Sinus Rhythm
ECG Signal Label
6.1.2. Idioventricular Tachycardia (IVT)
IVT originates from ventricles with a very slow heart rate around 20 to 40 bpm. If the beats are in the range of 50 to 100 bpm then it is called as accelerated idioventricular tachycardia [29]. The brief specifications are listed in the table 4.
Table.4 IVT Specifications
Feature Duration
P waves Absent
Heart Rate 50-110 bpm
P-R Not Applicable
QRS > 0.12 Sec
The ECG raw signal and its corresponding classified label for IVT is shown in the table 5. Table.5 Idioventricular Tachycardia
ECG Signal Label
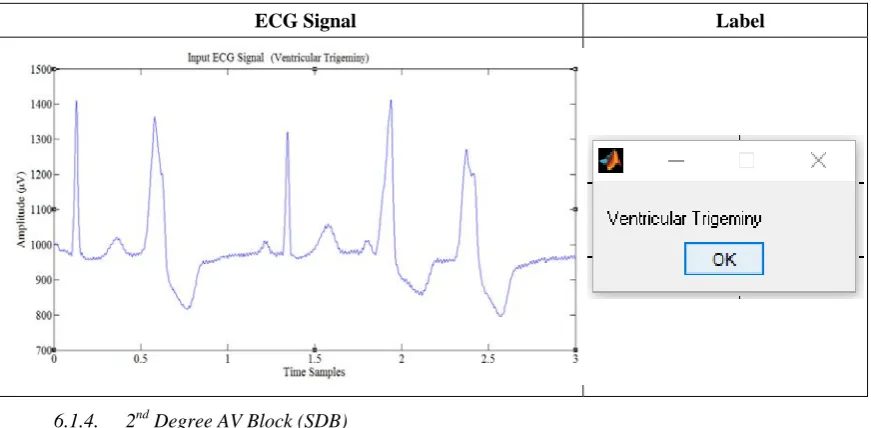
6.1.3. Ventricular Trigeminy (VTG)
Table.6 VTG Specifications
Feature Duration QRS Broad (> 120 ms)
Premature Occurs earlier
The ECG raw signal and its corresponding classified label for VTG is shown in the table 7. Table 7 Ventricular Trigeminy
ECG Signal Label
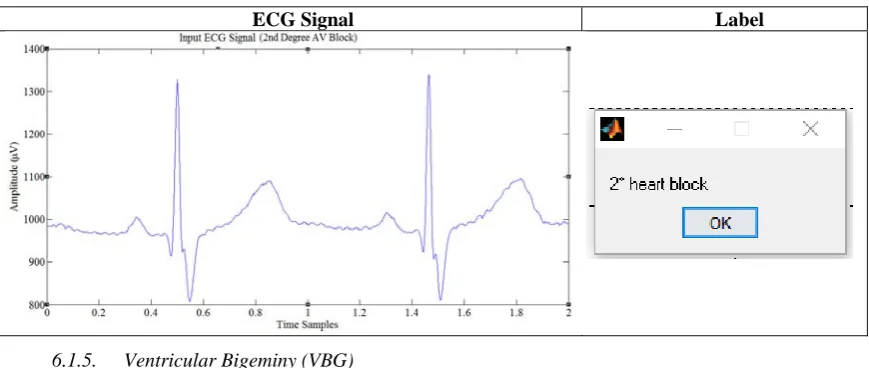
6.1.4. 2nd Degree AV Block (SDB)
It occurs due to the block between atria and ventricles. The presence of 2nd degree AV block can be
identified when one or more (but not all) of the atrial impulses fail to conduct to the ventricles due to abnormal conduction. There are two types of 2nd degree AV block, called
Type 1 and Type 2. In both types, a P wave is
blocked from initiating a QRS complex; but, in Type 1, there are increasing delays in each cycle before the omission, whereas, in Type 2, there is no such pattern. Type 1 second-degree heart block is considered a more benign entity than type 2 second-degree heart block [31].
Both types are named after WoldemarMobitz. Type I is also named for Karel Frederik Wenckebach, and type II is also named for John Hay. Mobitz I heart block is characterized by progressive prolongation of the PR interval on the electrocardiogram (ECG) on consecutive beats followed by a blocked P wave (i.e., a 'dropped' QRS complex). After the dropped QRS complex, the PR interval resets and the cycle repeats.
Type 2 Second-degree AV block, also known as "Mobitz II," is almost always a disease of the distal conduction system (His-Purkinje System). Mobitz II heart block is characterized on a surface ECG by intermittently non-conducted P waves not preceded by PR prolongation and not followed by PR shortening. There is usually a fixed number of non-conducted P waves for every successfully conducted QRS complex, and this ratio is often specified in describing Mobitz II blocks. The detailed specifications of SDB are shown in table 8.
Table 8 SDB Specifications
Feature Duration Heart Rate 40-050 bpm
lengthened PR interval Type-1 SDB Normal QRS Type-1 SDB
Normal PR Type-2 SDB
Widened QRS Type-2 SDB
Table 9 Second Degree AV Block
ECG Signal Label
6.1.5. Ventricular Bigeminy (VBG)
This abnormality occurs when there is a continuous alternation of long and short heart beats. This is due to the ectopic beats occurring so frequently that there is one after each sinus beat. The two beats are figuratively two twins and hence the name bi-geminy [32]. The ectopic beat is typically a premature ventricular contraction (PVC). The detailed specifications of VBG are shown in table 10.
Table 10 VBG Specifications
Feature Duration
QRS > 80 ms
RR > 800 ms
PR > 100 ms
Heart rate 45-50 bpm
The ECG raw signal and its corresponding label for VBG is shown in the table 11. Table 11 Ventricular Bigeminy
ECG Signal Label
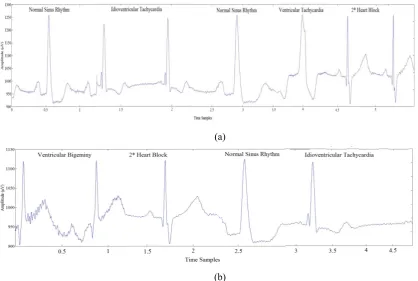
6.2. Classification of Beats in Synthetic ECG
(a)
(b)
Figure 9: Synthetic ECG signal containing beats of different abnormalities.
The plots also show the beat classification labels identified by the proposed MDL algorithm. The beats were perfectly classified by the method proposed. In addition to the test procedure adopted as above, five figures of merit are also calculated to show the efficacy of the method in classifying the beats. They are accuracy, kappa coefficient, sensitivity, specificity and recall [33]-[34].The average accuracy of the proposed algorithm is found to be 93.33, 95.83, 93.33, 95.83 and 97.91 respectively for NSR, IVT, VTR, SDB and VBG signals. The results of other figures of merit are presented in table 12, which establish the efficacy of the proposed classification algorithm
Table 12: Analysis of different beats using proposed algorithm
S. No Parameter Different Beats classified by the proposed MDL method
NSR IVT VTR SDB VBG
1. Accuracy (%) 93.33 95.83 93.33 95.83 97.91
2. Kappa Coefficient 0.85 0.894 0.85 0.894 0.948
3. Sensitivity (%) 100 85.71 100 85.71 92.85
4. Specificity (%) 94.11 100 94.11 100 100
5. Recall (%) 100 85.71 100 85.71 92.85
7. Conclusions
In this paper, we presented a new method called multimodal decision learning algorithm for the classification of ECG signals and tested it for detecting five classifications as Normal Sinus Rhythm (NSR), Idioventricular Tachycardia (IVT), Ventricular Trigeminy (VTR), Second Degree AV Block (SDB) and Ventricular Bigeminy (VBG). With the proposed method, we obtained an accuracy of 93.33%, 95.83%, 93.33%, 95.83% and 97.91% respectively for the listed beat abnormalities respectively. The ECG data was taken from MIT-BIH arrhythmia database and the analysis was carried out using MATLAB.The results establish the efficacy of the proposed classification algorithm.
References
[1] Damrong Sukitpunyaroj MD Damrong Sukitpunyaroj, MD, Perfect Heart Institue, Piyavate Hospital, “ECG Interpretation: The Basics”.
[2] M. O’Dwyer, P. de Chazal and R.B. Reilly, “Beat classification for use in arrhythmia Analysis” in Proceedings of the Computers in Cardiology”, pp. 395-398, IEEE, Cambridge, Mass, USA, 2000.
[4] Chandrakar B, Yadav O & Chandra V 2013, ‘A survey of noise removal techniques for ECG signals’, International Journal of Advanced Research in Computer and Communication Engineering, vol. 2,no. 3, pp. 1354-1357.
[5] Sarita Mishra, Debasmit Das, Roshan Kumar and Parasuraman Sumathi, “A power-line interference canceller based on sliding DFT phase locking scheme for ECG signals”, IEEE transactions on Instrumentation and measurement, Vol.64, No.1, Jan 2015.
[6] Islam M, Tangim G, Ahammad T &Khondokar M 2012, ‘Study and Analysis of ECG Signal Using MATLAB &LABVIEW as Effective Tools’, International journal of Computer and Electrical engineering, vol. 4,no. 3, p. 404.
[7] PrakrutiJ.joshi, Vivek P.Patkar, “ECG denoising using MATLAB” Int. Journal of Scientific & Engineering Research, May-2013. [8] Mbachu C.B. , Offor K.J, “Reduction of power line noise in ECG signal using FIR digital filter implemented with hamming window”,
Int. Journal of Science, Environment and Technology, 2013.
[9] JialiHou Weibo Hu ; Ke Lin ; Bo Wang, “A low power low noise AFE with continuous time self-calibration filters for ECG monitor and heart beat detection”, 12th IEEE Conference on Solid-State and Integrated Circuit Technology (ICSICT), Oct 2014.
[10] Kautabh Manik Gaikwad, mahsh Shrikant Chavan, “ Removal of high frequency noise from ECG signal using digital IIR Butterworth filter”, Gobal conference on wireless computing and networking, IEEE, 2014, pages 121-124.
[11] P.C. Bhaskar, M.D. Uplane, “FPGA based digital FIR Multilevel filtering for ECG denoising”, International Conference on Information Processing (ICIP), IEEE, 2015
[12] V. Gaurav Makwana, Lalita Gupta, “Denoising of ECg with adaptive filter using MATLAB”, Fifth International conference on comminication systems and network technologies (CSNT), IEEE, April 2015.
[13] AlMahamdy M & Riley HB 2014, ‘Performance study of different denoising methods for ECG signals’, Procedia Computer Science, vol. 37, pp. 325-332.
[14] B. Castro, D. Kogan and A.B. Geva, “ECG Feature extraction using optimal mother wavelet”, presented at Electrical and Electronics Engineers in Israel, 2000. The 21st IEEE Conference, Tel-Aviv, 2000.
[15] Bhaskar P &Uplane M 2016, ‘High Frequency Electromyogram Noise Removal from Electrocardiogram Using FIR Low Pass Filter Based on FPGA’, Procedia Technology, vol. 25, pp. 497-504.
[16] Rubin J, Abreu R, Ahern S, Eldardiry H & Bobrow DG 2016, ‘Time, Frequency & Complexity Analysis for Recognizing Panic States from Physiologic Time-Series’, ACM
[17] Ajay Bharadwaj and Umanath Kamath, “Techniques for accurate ECG signal processing”, EE Times, Feb. 2011.
[18] V.S.R. Kumari and P.R. Kumar, “Cardiac Arrhythmia Prediction using improved Multilayer Perceptron Neural Network”, Research and Develop. (IJECIERD), Vol.3, no.4, pp. 226-233, 2010.
[19] Wikipedia. (2014, October 2). Online link: http://en.wikipedia.org/wiki/Electrocardiography.
[20] A. Dallali, A. Kachouri, and M. Samet, "Classification of Cardiac Arrhythmia Using WT, HRV, and Fuzzy C-Means Clustering," Signal Processing: An Int. J. (SPJI), vol. 5, no. 3, pp. 101-109, 2011.
[21] H. Khorrami and M. Moavenian, "A comparative study of DWT, CWT and DCT transformations in ECG arrhythmias classification," Expert syst. with Applicat., vol. 37, no. 8, pp. 5751-5757, 2010.
[22] F. A. Naima and A. A. Timemy, "Neural network based classification of myocardial infarction: a comparative study of wavelet and fourier transforms," pp. 337-351, 2009.
[23] M. Moavenian and H. Khorrami, "A qualitative comparison of artificial neural networks and support vector machines in ECG arrhythmias classification," Expert Syst. with Applicat., vol. 37, no. 4, pp. 3088-3093, 2010.
[24] Michael Alb, Piergiorgio Alotto1, Christian Magele, Werner Renhart, Kurt Preis and Bernhard Trapp, “Firefly Algorithm for Finding Optimal Shapes of Electromagnetic Devices”, IEEE Transactions On Magnetics, VOL. 52, NO. 3, March 2016
[25] T. Syeda-Mahmood, F. Wang, D. Beymer, A. Amir, “AALIM: Multimodal mining for cardiac decision support”,Computers in Cardiology, IEEE Xplore, 09 January 2009.
[26] Abhishek Vaish, Pinki Kumari, “A Comparative Study on Machine Learning Algorithms in Emotion State Recognition Using ECG”, Springer India, Proceedings of the Second International Conference on Soft Computing for Problem Solving (SocProS 2012), December 28-30, 2012
[27] Physionet. (2014, November 10) [Online]. Available: http://physionet.org/physiobank/database/mitdb/. [28] Life in the Fastlane, Online: http://lifeinthefastlane.com/ecg-library/normal-sinus-rhythm/
[29] Life in the Fastlane, Online: http://lifeinthefastlane.com/ecg-library/aivr/ [30] Life in the Fastlane, Online: http://lifeinthefastlane.com/ecg-library/basics/pvc/ [31] Wikipedia, Online: https://en.wikipedia.org/wiki/Second-degree_atrioventricular_block
[32] Dawn, “ECG Basics: Sinus Rhythm With Ventricular Bigeminy”, Online: https://www.ecgguru.com/ecg/ventricular-bigeminy, 2015.
[33] Sani Muhamad Isa, M. EkaSuryana, M. Ali Akbar, AryNoviyanto,” Performance Analysis of ECG Signal Compression using SPIHT”, INTERNATIONAL JOURNAL ON SMART SENSING AND INTELLIGENT SYSTEMS VOL. 6, NO. 5, DECEMBER 2013, Indonesia.