_____________________________________________________________________________________________________
*Corresponding author: E-mail: [email protected];
(Past name: American Chemical Science Journal, Past ISSN: 2249-0205)
A Comparative Study of Microcrystalline Cellulose
Isolated from the Pod Husk and Stalk of Fluted
Pumpkin
C. C. Nwajiobi
1*, J. O. E. Otaigbe
1and O. Oriji
11
Department of Pure and Industrial Chemistry, University of Port Harcourt, Nigeria.
Authors’ contributions
This work was carried out in collaboration between all authors. Authors CCN and JOEO designed the study. Author CCN managed the analyses and first draft writing of the manuscript. Authors JOEO and OO oversee the management of the literature searches and the later manuscript write-up. All authors read and approved the final manuscript.
Article Information
DOI: 10.9734/CSJI/2018/v25i430074
Editor(s):
(1)Dr. T. P. West, Professor, Department of Chemistry, Texas A&M University-Commerce, USA.
Reviewers:
(1)Yongchun Zhu, Shenyang Normal University, China. (2)Marwah Rayung, Universiti Putra Malaysia, Malaysia. (3)Jin Seop Bak, Kyonggi University, South Korea. Complete Peer review History:http://www.sdiarticle3.com/review-history/46881
Received 18 October 2018 Accepted 23 January 2019 Published 21 February 2019
ABSTRACT
Microcrystalline celluloses (MCC) were prepared from α-celluloses obtained from fluted pumpkin stalk and pod. The substrates were subjected to treatment with 2% (w/v) NaOH, 3.5% (w/v) NaOCl and 17.5% (w/v) NaOH solutions respectively to obtain alpha celluloses. Acid hydrolysis of the alpha-celluloses using 2.5 N hydrochloric acid were carried out. The study evaluates and compares the physicochemical properties of microcrystalline cellulose obtained from the pod and stalk of fluted pumpkin. Composition of cellulose, hemicellulose and lignin were also determined. Results showed cellulose; hemicellulose and lignin content of the pod husk and stalk were 49%, 26%, 9% and 41%, 24%, 26%, respectively. The morphology of the hydrolyzed MCCs’ were investigated using scanning electron microscopy (SEM) and the results revealed the stalk (FS-MCC) to have an individual rod-like shaped fiber when compared with flat-shaped large aggregated forms of the pod (FP-MCC). The particles sizes were also uneven with FP-MCC (6.689 µm) having larger particle sizes than FS-MCC (5.538 µm). The high cellulose content of the pod husk shows that the applications may be
extended in the production of other cellulose derivatives while the high lignin content of the stalk reveals other alternative source of producing lignin in the making of textile dyes, coating and other agricultural chemical. Pod MCC (FP-MCC) had better physicochemical properties than the stalk MCC (FS-MCC).
Keywords: Cellulose; MCC; fluted pumpkin; SEM; physicochemical.
1. INTRODUCTION
Waste generation and accumulation have stimulated serious measure strategies not only in the Western World but also in the third World Countries. Reasonable efforts have been made to develop means for the recovery and utilization of biopolymers waste over the years. This became very important considering the fact that those wastes contain appreciable amount of dry matter, crude protein, fibre, ether extract, minerals, high molecular weight cellulose and hemicellulose which can be obtained at minimal cost [1,2]. Cellulose, the most important chemical component in different lignocellulosic biomass (accounting for more than 50% by weight) has a linear homopolymer of glucopyranose residues, linked by β-1, 4 – glycosidic bond [3]. The chemical and mechanical degradations of cellulose result to the production of low molecular weight microcrystalline cellulose (MCC). MCC powder has a vast variety of applications in food, cosmetic, thin layer chromatography and pharmaceutical industries [4]. Wood and cotton linters have become the major precursors used in the production of MCC, but due to the negative impact of forest depletion on the environment worldwide, research is being focused on other alternative sources of MCC. Many studies have been reported using different non-woody sources to prepare MCC. These include groundnut shell, cereal straw [5,6], water hyacinth [7], bagasse and corn cob [8], Indian bamboo [9], sugar beet pulp [10], sugar cane bagasse [11-13], pineapple leaf [14], luffa cylindrical [15], banana plant waste [16], peel of pear [17], orange mesocarps [18], Pomelo peel [19], coffe husk [20] roselle fibers [21] etc.
Telfairia occidentalis Hook.f generally known as fluted pumpkin is a perennial drought resistant crop which is grown as an annual crop under the West African traditional farming system. It is a dioecious herb which is coiled on creeping or usually branched tendrils with the root system ramifying the soil to top surface level. The stem is angular and glabrous which becomes fibrous when old. The fruit pod contains many ovoid seeds (about 192) of different genders of plant
and the best method of harvesting this plant is by pruning [22,23]. This creeping vegetative plant is cultivated and consumed in the South Eastern Nigeria extensively while the tender vine and foliage are consumed as potherb; the seed is consumed as nut. The leaf is rich in iron and finds herbal use in treatment of diabetes and anaemia [24]. The tender shoots, succulent leaves and immature seeds are cooked and consumed as vegetable. The plant also contains considerable amount of anti-nutrients such as tannin, phytic acid and saponin which may also be beneficial to the health [25,26]. Processing of the wastes generated from this plant (fluted pumpkin stalk and pod husk) to α-cellulose and subsequent conversion to microcrystalline cellulose for the production of drugs, creams and lotion will add to its potentials and benefits to man. In this study, the physicochemical properties of the produced MCCs will be evaluated.
2. MATERIALS AND METHODS
2.1 Chemical Reagents
Sodium hydroxide pellets, Sodium hypochlorite (Hypo® Multipro Enterprises Ltd, Nigeria), conc. hydrochloric acid, iodine crystals, zinc chloride (ZnCl2), potassium Iodide (KI), acetone (C3H6O), xylene, hexadecyltrimethylammonium bromide (C19H42Br) (Sigma-Aldrich, UK), conc. sulphuric acid, 2-octanol, hydrogen peroxide (H2O2), sodium dodecyl sulfate (Sigma-Aldrich, UK), EDTA disodium salt (dehydrate), Saturated KMnO4, glacial acetic acid, potassium acetate, tertiary butyl alcohol, silver nitrate (AgNO3), Fe(NO3)3.9H2O, oxalic acid dehydrate, ethanol, sodium borate, sodium phosphate dibasic (anhydrous), triethylene glycol, alpha amylase (Sigma-Aldrich, UK), sodium sulfite (Na2SO3) (Sigma-Aldrich, UK) and distilled water were utilized for the study.
2.2 Preparation of Raw Material
Mile 1 market in Rivers state, Nigeria respectively. The pod husk was soaked in water for 10 min, then washed properly to remove the pulp and other potential contaminants, while the stalk was cleaned with water. They were cut into irregular chips and then dried. The dried chips of the pod husk and stalk were pulverised using an electric grinder and then allowed to cool to room temperature. The resultant powdered pod husk and stalk of fluted pumpkin were sieved using 2.0 mm Laboratory test sieve (Endecotts ltd London England).
2.3 Compositional Analysis
In the determination of cellulose, hemicellulose and lignin content, a modification of the procedure by [27] was adopted.
2.4 Neutral Detergent Fibre (NDF)
5 g each of the samples were soaked in 50 mL of ethanol separately for 24 h, after which the samples were filtered and oven-dried at 105°C for 6 h.1 g of the dried biomass sample obtained after cold extraction with ethanol and 0.5 g of sodium sulphite were introduced in the Berzelium flasks. 100 mL of the NDF solution was added at room temperature and refluxed for 1 h. At the end of the reflux period, each flask was removed separately and the sample solutions were slowly decanted into a Whatman 541 filter paper and vacuum filtered into a flask. The resulting residues obtained were washed with several volumes of boiling water and oven-dried at 105°C for 6 h, and then weighed to a constant weight.
NDF = [(Dry filter paper + residue – Dry filter)/ Initial sample weight] × 100 (1)
2.5 Acid-detergent Fiber (ADF)
The dried residues obtained from NDF analysis were placed in Berzelium flasks, added 3 drops of 2-octanol then refluxed for 1 h. At the end of the reflux period, the sample solutions were filtered and washed thrice with boiling water and twice with acetone. The moist residues were oven- dried at 105°C for 8 h, transferred to a desiccator and later weighed to a constant weight.
ADF = [(Dry filter paper + residue – Dry filter paper)/ initial sample weight] × 100 (2)
Hemicellulose = (NDF) – (ADF) (3)
2.6 Determination of Permanent Lignin (PML)
The dried residues obtained from ADF analysis were placed in a two different crucible immersed in a shallow enamel pan containing cold water. Saturated KMnO4 was mixed with the buffer solution in the ratio of 3:1 and 25 mL of that solution was added to the crucible. The crucible stand was allowed to stand for 90 min at room temperature while stirring continuously to break the lumps and draw up on sides of the crucible in order to wet all particles. At the end of delignification, the crucible was removed to filtering apparatus and suck dried, then placed back in the crucible and added demineralizing solution, after 5 min it was again suck dried then finally soaked back with demineralizing solution and left to stand for 30 mins till the fibre is white. The resultant white fibre obtained was washed twice with 80% ethanol and subsequently with acetone and then suck dried. The residue obtained was oven-dried at 105°C for 6 h and then weighed.
PML = [(Dry filter paper + residue – Dry filter)/initial sample weight] × 100 (4)
Crude lignin containing ash (PML1) = W (ADF) –
W (PML) (5)
The dried residue obtained after delignification was ashed. The sample was weighed and placed in a crucible and the ash content was estimated by weighing the residue that remained after combustion at 550°C for 4 h.
Cellulose = PML1 weight before ashing –ash (6)
2.7 Isolation of Alpha Cellulose (POD Husk)
obtained after washing was further bleached with 4 L of (1:1) aqueous solution of 3.5% (w/v) sodium hypochlorite at 50°C for 20 min, washed severally with distilled water until the washings were neutral to litmus paper. It was filtered and squeezed through the muslin cloth to obtain a small mass and then oven-dried (JP Selecta Digiheat Oven) at 65°C for 12 h.
2.8 Stalk
1000 g of the sieved fraction of milled, dried stalk was de-lignified using 5 L of 2% (w/v) aqueous sodium hydroxide solution in a stainless steel container immersed in a water bath (Precisdig (6001197) JP Selecta water bath) and maintained at 80°C for 3 h. The moist material obtained after delignification was treated with 3.5 L of 3.5% (w/v) sodium hypochlorite solution at 80°C for 30 min. The resultant bleached mass was treated with 3.750 L of 17.5% (w/v) aqueous sodium hydroxide solution at 80°C for 1 h. The resultant moist residue (the crude alpha cellulose) obtained after several times of washing with distilled water was bleached with 1.4 L of 1:1 dilution of 3.5% (w/v) aqueous sodium hypochlorite solution repeatedly at 80°C for 1 h until the material became milky white. Finally, the alpha cellulose was further treated with 2.5 L of 13.5% (v/v) hydrogen peroxide at 80°C for 1 h to obtain a snow white colour, which was washed severally with distilled water until the washings were neutral to litmus paper. It was then filtered through the muslin cloth to obtain a small mass and then oven-dried (JP Selecta Digiheat Oven) at 65°C for 12 h.
2.9 Production of Microcrystalline Cellulose
A slight modification of the method by [29] was adopted in preparing microcrystalline cellulose. The α-celluloses (109 g and 161 g) of pod and stalk respectively were each placed in a beaker and hydrolyzed with 2 L of 2.5 N hydrochloric acid at a boiling temperature for 15 min. The resulting mixture was poured into 3 L of distilled water followed by vigorous stirring, then allowed to stand overnight. The crystals obtained were washed with distilled water until neutral to litmus paper, filtered through a muslin cloth and then oven-dried at 65°C for12 h. Further milling and sieving were carried out to produce smaller crystals of the aperture sieve size of less than 250 μm.
2.10 Physicochemical Properties
Identification, Organoleptic characteristics, starch and dextrin, solubility tests were carried out according to British Pharmacopoeia (BP) specifications [30].
pH: This was determined by shaking 1 g of each MCC with 50 mL of distilled water for 5 min and the pH of the supernatant liquid was determined using pH meter (pHep® pocket-sized pH meter).
Moisture content: 2 g of each of the powdered samples was weighed, transferred into a petri dish and then dried in an oven for 3 h at 105°C to a constant weight. The moisture content (%) was then computed based on the initial air-dried weight.
Bulk (Bd) and Tapped (Td) density: 5 g of each
MCC samples was weighed and transferred into a 50 mL dry measuring cylinder. The volume occupied by the sample was noted as the bulk volume and the bulk density was determined by dividing the mass of the material by the bulk volume as expressed [31]:
Bulk density (Bd)
=
[M /VB] (7)Where M is the mass of the sample, VB is the bulk volume of sample
The measuring cylinder was then tapped on a wooden platform by dropping the cylinder from a height of one inch at 2 seconds intervals until there was no observable change in volume reduction. The volume occupied by the material was recorded as the tapped volume. The tapped density was determined using the expression:
Tapped density (Td) = [M/VT] (8)
Where M is the mass of the sample, VT is the tapped volume of sample
True density (Dt): The true density was
determined by the liquid displacement method by completely immersing the sample in a pycnometer bottle (26 mL) capacity using xylene as the immersion fluid. The volume of the liquid that was displaced was measured and the density was computed according to the following equation:
where w is the weight of powder, SG is specific gravity of xylene, a represents sum of weights of the bottle and solvent and b represents the sum of weights of bottle, solvent and the MCC powder.
Packing fraction (Pf): The packing fraction (Pf) is expressed as the ratio of the bulk density (Bd) to that of the true density (Dt) as: [32]
Pf = Bd/Dt (10)
Hausner’s ratio (Hr): This is calculated as the
ratio of tapped density to bulk density of the sample
Hr = Td/Bd (11)
Powder porosity (Po): This was determined from the values of true and bulk densities when fitted into the equation;
Po = 1- Bd/Dt × 100 (12)
Where Bd is the bulk density, Dt is the true density and e is the porosity
Compressibility index CI: This was calculated
by fitting bulk and tapped densities data into the equation as expressed;
Compressibility index (C%) = [(Td – Bd)/ Td] × 100 (13)
Hydration capacity (Hc): The method of [33]
was used to determine the hydration capacity of MCC. 1 g each of the samples was placed in each of the four 15 mL plastic centrifuge tubes and 10 mL distilled water was added from a 10 mL measuring cylinder and then stoppard. The content was mixed for 2 min; then the mixture was allowed to stand for 10 min and was then immediately centrifuged at 1000 rpm for 10 min on a bench centrifuge (Sorvall-GLC-4). The supernatant was carefully decanted and the sediment weighed. The hydration capacity is determined as the ratio of the weight of the sediment to the dry sample weight.
Hc = [(weight of sediment – weight of tube)/oven-dried] (14)
Swelling capacity (Swellability) (SC): This was
determined at the same time as the hydration capacity determination and calculated as follows:
Swelling capacity (SC) = (V2-V1)/V1 (15)
V1 = tapped volume occupied by the sample prior to hydration
V2 = volume occupied by sample after hydration
Angle of repose (a): The static angle of repose ‘a’ was measured according to the fixed funnel and free standing cone method. A funnel was clamped with its tip 2 cm above a graph paper placed on a flat horizontal surface. The MCC powders were carefully poured through the funnel until the apex of the cone thus formed just reached the tip of the funnel. The mean diameters of the base of the powder cones were determined and the tangent of the angle of repose was calculated using the equation:
Tan a = 2h/D (16)
where h is the height of the heap of powder and
D is the diameter of the base of the heap of powder [34].
Particle size analysis: Thiswas determined by microscopic method. The particles were viewed through the trinocular microscope (SXY-m50) and the s-viewer application was used in taking accurate readings. The average diameters of the magnified particles were determined for the sample size of 100 particles.
Sieve analysis: This was determined using a sieve shaker, containing standard test sieves ranging from 250 µm-63 µm arranged in a descending order according to their aperture sizes. 20 g of each MCC powder was placed on the topmost sieve (U.S.A standard test sieve, ASTM E-11 specification) and after 5 min of shaking; the weight of MCC retained on each sieve was determined by subtracting the weight of the empty sieves from the weight of sieves containing the powder. The percentage retained was then determined. The average diameter was calculated using the following relationship as reported by [35]:
Average diameter of the MCC particles = [Ʃ(% retained)×(mean aperture)]/100 (17)
recorded. The viscosities were determined from efflux times of the sample solutions (t) and the blank solutions (t0) using the equation of Solomon and Cuitta [36]
[ ] = [ 2 ( - ln )]1/2 (18)
C
Where [ ] is the intrinsic viscosity (cP) is the specific viscosity ( − 1)
is the relative viscosity (tsolution/tsolvent) C is the concentration of the sample (g/cm3) tsolution is solution flow time (s)
tsolvent is the solvent flow time (s)
Degree of polymerization (D.P): The degree of polymerization was determined from the viscosity using the equation [37]
D.P = 598.4ln [ ] + 118.02 (ln [ ])2 -449 (19)
Molecular Weight: The molecular weight was determined using the equation
DP = M (20)
M0
Where M0 is the molecular weight of an anhydroglucose unit (AGU)
M is the molecular weight of the material
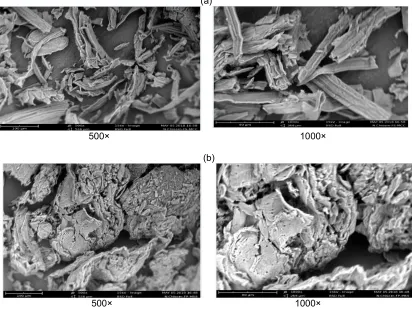
Scanning Electron Microscopy (SEM): SEM was carried out on the sample to study the surface morphology. Each of the samples was sputter-coated with gold for 3–4 min to dissipate the static charges occurring due to electron bombardment and then observed in SEM, JSM 5400 (JEOL ltd., Japan) at an accelerated voltage of 10 kV.
3. RESULTS AND DISCUSSION
From Table 1, identification test gave a violet-blue colour in the samples indicating the
presence of cellulose, while the solubility test showed that the samples were insoluble in the test solvents. No colour changes were observed for the starch and dextrin test and were thus considered absent. The organoleptic properties are acceptable as the materials were odourless, tasteless, white granular powders. The percentage yield of α-cellulose obtained from pod husk and stalk were 18.2% w/w and 16.1% w/w respectively while the MCC yield obtained from their α-celluloses were 88.16% w/w and 88.19% w/w respectively, thus the yield of MCC from their starting dry plant materials were approximately 16% w/w and 14% w/w respectively. As expected, the amount of MCC obtained was reduced due to large amount of amorphous regions that get solubilized and eliminated during acid hydrolysis.
The pH value of the pod husk was within the acceptable limit of 5-7.5 as specified in the British pharmacopeia [30] while that of the stalk was slightly lower than the acceptable limit. This can be enhanced by washing with excess water in order to ensure neutralization. From the pH values conclusion may also be drawn that the presence of sodium hydroxide is highly improbable. The composition of cellulose, hemicelluloses and lignin content of the pod and stalk were 49%, 26%, 9% and 41%, 24%, 26% respectively.
The water soluble substance values for the pod husk and stalk were not in compliance with the standard (≤ 0.26% or 12.5 mg) as stipulated by the British Pharmacopoeia [30]. The low value of water soluble substances can be attributed to the hydrolysis process, where glucose content of α-cellulose is diluted; as a result the microcrystal cellulose became low indicating that the crystal phase had appeared in MCC [37,38]. Thus, the high value obtained for the two samples (FP-MCC and FS-(FP-MCC) may be due to lower crystal phase appearance of the MCC.
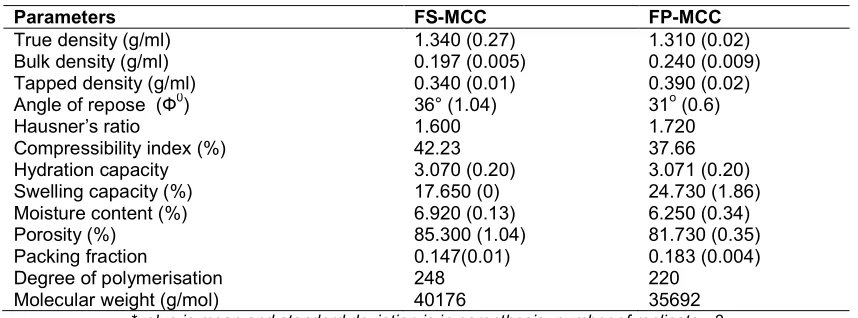
Table 1. Some properties of MCC (FS-MCC and FP-MCC)
Test FS-MCC FP-MCC
Organoleptic characteristics White, odourless,
tasteless , granular
White, odourless, tasteless, granular Identification (Iodinated zinc chloride) Turns violet blue Turns violet blue
Starch and Dextrin Negative Negative
pH 4.9 5.4
Water soluble substance (%) ≤ 0.99 ≤ 0.64
Table 2. Comparative studies of powder properties of microcrystalline cellulose FS-MCC and FP-MCC
Parameters FS-MCC FP-MCC
True density (g/ml) 1.340 (0.27) 1.310 (0.02)
Bulk density (g/ml) 0.197 (0.005) 0.240 (0.009)
Tapped density (g/ml) 0.340 (0.01) 0.390 (0.02)
Angle of repose (Ф0) 36° (1.04) 31o (0.6)
Hausner’s ratio 1.600 1.720
Compressibility index (%) 42.23 37.66
Hydration capacity 3.070 (0.20) 3.071 (0.20)
Swelling capacity (%) 17.650 (0) 24.730 (1.86)
Moisture content (%) 6.920 (0.13) 6.250 (0.34)
Porosity (%) 85.300 (1.04) 81.730 (0.35)
Packing fraction 0.147(0.01) 0.183 (0.004)
Degree of polymerisation 248 220
Molecular weight (g/mol) 40176 35692
*value is mean and standard deviation is in parenthesis, number of replicate =3
From Table 2, the moisture content determined for the samples were within the maximum acceptable limit of 7% [30]. The low % moisture content may be due to the crystalline structure. The crystalline phase finds it difficult absorbing and storing water when compared to the amorphous phase. The FS-MCC has higher moisture content than the FP-MCC. This may be due to having higher amorphous content portion than the crystalline portion. Regulation of moisture in tablet or drug formulation is very essential as high moisture content may interfere with active ingredient [32,39].
Bulk and tapped densities of the powders provide information on their packing, compactness and densification behaviour. The higher the bulk and tapped densities value, the better the potential for a material to flow as well as to re-arrange under compression. From the results, FP-MCC had higher bulk and tapped densities when compared to FS-MCC. This suggests that FP-MCC may have a better flow property than FS-MCC. The porosity value of FP-MCC is lower than that of FS-MCC. This may be due to increased bulk density which is associated with decrease in total pore space. From the results of packing fraction, FP-MCC exhibited the largest maximum volume reduction due to packing when compared to FS-MCC. This may be due to shape of its particles which are reflected in the micrograph images.
The flow characteristics and frictional forces in powder samples were measured using angle of repose. Results showed the angle of repose of FS-MCC is higher than that of FP-MCC. Decrease in particle size is suggested to lead to
increase in angle of repose of FS-MCC. From the limits of angles established as reported by [40], the samples have reasonable flow potential.
The Carr’s index and Hausner ratio predict the flow and compressibility of powders. The Hausers ratio and Carr’s index of FS-MCC was higher than that of FP-MCC. This may be due to the high moisture content of FS-MCC which is said to directly decrease the flow property of the powder by increasing its cohesiveness of powder. From the values established by the Carr’s index and Hausners ratio, values obtained for the two samples show that they have poor floor properties. Hence, addition of a glidant would be needed when using these materials in solid dosage production process.
One common feature of all theories of disintegration is that penetration of water or any liquid medium must precede disintegration and this can be assessed by the determination of the hydration capacity, swelling capacity and porosity [41]. The swelling capacity showed a higher increase in volume of FP-MCC when compared with FS-MCC. This demonstrates that FP-MCC may be a better disintegrant than the FS-MCC and if incorporated in tablet formulation as a disintegrant, would probably produce tablet disintegration by two mechanisms: capillary or wicking and swelling [32]. Furthermore, amorphous cellulose content and porosity can also affect the swelling capacity [42].
of the amount of water that can be taken-up by the material [43]. The hydration capacity values of the two samples were almost close in terms of numeric value. This shows that the two samples have high porosity. The degree of polymerization of the samples were within the standard limits (DP < 350) as stipulated by British Pharmacopoeia.
True density measures the density of a solid material excluding the volume of any open and closed pores. High true density suggests high crystallinity which is also in accordance with the report by [42]. Thus, FS-MCC had a higher true density value than that of FP-MCC.
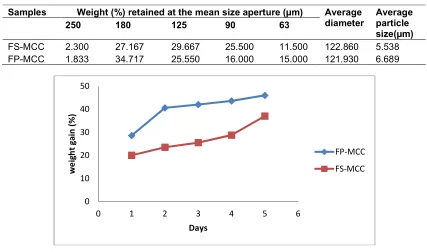
The particle size analysis results shown in Table 3 were in the range of 63–250 µm. It was observed that over 95% of the particle population was less than 250 µm for both samples. The highest number of MCC particles were retained in sieve aperture of 180 µm (35% out of the 20 g sample) for FP-MCC, while the highest number of MCC particles were retained in sieve aperture of 125 µm (30% out of the 20 g sample) for FS-MCC. This revealed that FP-MCC had more of the particle sizes greater than 180 µm while FS-MCC had more of the particle sizes less than 180
µm and the coarsest portion had the least quantity. The calculated average diameters were 123 and 122 for FP-MCC and FS-MCC respectively. The average diameters of the two prepared MCC samples were comparable may be due to the same acid (i.e HCl) used during hydrolysis unlike the results reported for bean and rice hull by [43], where two different acids were used (i.e. HCl and H2SO4) which had effect on the average diameter of the resulting MCC samples. Furthermore, since the calculated average particle diameters of the two samples are within the range of 70-1000 µm, they are referred to as “conventional powders” [33].
The moisture sorption capacity is a measure of moisture sensitivity of a material and it reflects relatively the physical stability of the tablets when stored under humid conditions [28]. From Fig.1, results showed that FS-MCC adsorbed less moisture than FP-MCC. This could indicate that when FS-MCC is used in tablet formulation, it would adsorb the least moisture and thus eventually give tablets with better physical stability than FP-MCC. According to the report by [42], FS-MCC may probably have high crystalline portion of cellulose than FP-MCC which makes it adsorb less water.
Table 3. Particle sizes of the cellulose
Samples Weight (%) retained at the mean size aperture (µm) Average diameter
Average particle size(µm)
250 180 125 90 63
FS-MCC 2.300 27.167 29.667 25.500 11.500 122.860 5.538
FP-MCC 1.833 34.717 25.550 16.000 15.000 121.930 6.689
Fig. 1. Moisture sorption profile of FS-MCC and FP-MCC 0
10 20 30 40 50
0 1 2 3 4 5 6
w
e
ig
h
t
ga
in
(
%
)
Days
FP-MCC
(a)
500× 1000×
(b)
500× 1000×
Fig. 2. Scanning Electron micrograph of (a) FS-MCC (b) FP-MCC
Fig 2 (a and b) are the results of the scanning electron micrographs of FP-MCC and FS-MCC at different magnifications. Results revealed that stalk-MCC (FS-MCC) exist as irregular, individual rod-like fibres with few bundle forms as well as an uneven surface while the pod-MCC (FP-MCC) exists as irregular, flat-shaped aggregated fibres. Both MCCs had a rough surface which favours the production of nanocrystals through hydrolysis [44]. Particle shapes were also reflected in the porosity, as particles with larger sizes have lower porosity [45].
4. CONCLUSION
Microcrystalline cellulose has been successfully prepared from the waste biomasses. Both MCC powders had poor flow properties which is not different from some other established reports. This may be resolved by the addition of glidant during solid dosage production. The Pod husk has high cellulose content when compared to the stalk. Thus, may be used as an alternative source of producing other cellulose derivatives, while the high lignin content of the stalk may be
an alternative source of lignin in the making textile dyes, coating and other agricultural chemical.
COMPETING INTERESTS
Authors have declared that no competing interests exist.
REFERENCES
1. Bamgboye AI, Jekayinfa SO. Energy consumption pattern in coconut processing operations. Agricultural Engineering International: The CIGR Journal Manuscript EE 05 013. 2006;8.
2. Atuanya CU, Aigbodion VS, Nwigbo U. Characterization of breadfruit seed hull ash for potential utilization in metal matrix composites for automotive application. Peoples Journal of Science and Technology. 2012;2(1):2249-5847.
Available:http://doc.doi.org/10.5772/51883 4. Jeevananda T, Siddaramaiah. Synthesis
and characterisation of microcrystalline powder. Indian J. Eng. Mate. Sci. 1997;1(4):38-40.
5. Jain JK, Dixit VK, Varma. Preparation of microcrystalline cellulose from cereal straw and its evaluation as a tablet excipient. Indian Journal of Pharmaceutical Science. 1993;45:83-85.
6. Okhamafe A, Igboechi A, Obaseki TO. Celluloses extracted from groundnut shell
and rice husks/ Preliminary
physicochemical characterization. World J. Pharm. Sci. 1991;8(4):120-130.
7. Herman S, Sutriyo, Hasty RS, Dianah R. Preparation of MCC from water hyacinth powder by enzymatic hydrolysis using cellulose of local isolate. Journal of Young Pharmacists. 2017; 9(1 Suppl):19. 8. Okhamafe AO, Ejike EN, Akinrinola FF,
Ubane-Ine D. Aspect of tablet disintegrant properties of cellulose derived from bagasse and maize cob. J. Pharm. Sci. 1995;1:20-29.
9. Ofoefule SI, Chukwu A. Application of blends of MCC-cissus gum in the formation of aqueous suspensions. Bolletino Chimico Farmaceutico. 1999;138(5):217-222. 10. Hanna M, Blby G, Miladinove, V.
Production of microcrystalline cellulose by reactive extrusion. US Patent 6, 228, 213; 2001.
11. Shah DA, Shah YD, Trivedi BM. Production of microcrystalline cellulose from sugar cane bagasse on pilot plant and its evaluation as pharmaceutical adjunct. Research and Industry. 1993;38(3):133-137.
12. Tang LG, Hon DNS, Pan SH, Zhu YU, Wang Z, Wang ZZ. Evaluation of microcrystalline cellulose. I. Changes in ultrastructural characteristics during preliminary acid hydrolysis. J. App. Polymer Sci. 1996;59:483-488.
13. Castro AD, Bueno, JH. Associacoes de celluloses microfinae microcrista linana compressao direta. Estudos preliminaries. Revistacieˆncias Farmaceˆuticcas. 1996;15:169–181.
14. Cherian BM, Leao AL, de Souza SF, Manzine costa LM, de Olyveira GM, Kottaisamy M, Nagarajan ER, Thomas S. Cellulose nanocomposites with nanofibers isolated from pineapple leaf fibers for mechanical applications. Carbohydrate Polymers. 2011;86(4):1790-1798.
15. Ohwoavworhua FO, Kunle OO, Ofoefule SI. Extraction and characterization of microcrystalline cellulose derived from Luffa cylindrica plant. Afr. J Pharm. Res. and Dev. 2004;1:1-6.
16. Elanthikkal S, Gopala, KPU, Varghese S, Guthrie JT. Cellulose microfibers produced from banana plant wastes: Isolation and characterisation. Carbohydrate Polymers. 2010;80(3):852-859.
17. Habibi Y, Mahrouz M, Vignon MR. Microfibrillated cellulose from the peel of prickly pear fruits. Food Chemistry. 2009;115(2):423-429.
18. Ejikeme PM. Investigation of the physicochemical properties of microcrystalline cellulose from agricultural wastes orange mesocarp. Cellulose. 2008;15:141-147.
19. Liu Y, Liu A, Ibrahim SA, Yang H, Huang W. Isolation and characterization of microcrystalline cellulose from pomelo peel. International Journal of Biological Macromolecule. 2018;111:717-721. 20. Collazo-Bigliardi S, Otega-Toro R, Chiralt
BA. Isolation and characterization of microcrystalline and cellulose nanocrystals from coffee husk and comparatine study with rice husk. Carbohydrate Polymers. 2018;191:205-215.
21. Lau KK, Jawaid M, Ariffin. Isolation and characterization of microcrystalline cellulose from roselle fibers. International Journal of Biological Macromolecules. 2017;103:931-940.
22. Axtel BL, Fairman. Minor oil crops FAO Agricultural services Bulletin No 94; 1992. Available:http://www.Fao.org/docrep/x5043 e/x5043Eoo.htm
23. Chukwura NF, Eze CB, Aruah CL, Onyeonagu, Onyeke CC. Comparative studies on growth and evaluation of some harvested parts of fluted pumpkin (Telfairia occidentalis HOOK. F.) plants. The Journal of Animal and Plant Sciences. 2015;25(3):656-660.
24. Ogar EA, Asiegbu JE. Effect of fertilizer rates and cutting frequency on the marketable vegetable and pod yields in fluted pumpkin in Southern Nigeria. Agroscience. 2005;4(1):66-69.
26. Balogun MO, Akande SR, Ogunbodede BA. Effect of plant growth regulators on callus, shoot and root formation in Flute pumpkin (Telfairia occidentalis). African Journal of Biotechnology. 2007;6(4):355-358.
27. Georing HK, Van Soest PJ. Forage fibre analyses (Apparatus, Reagents, Procedures and Some Applications). Agricultural Handbook No. 379, ARS USDA; 1970.
28. Ohwoavworhua FO, Adelakun TA. Non-wood fibre production of microcrystalline cellulose from Sorghum caudatum: Characterization and tableting properties. Indian Journal of Pharmaceutical Sciences. 2012;72(3):295-301.
29. Ohwoavworhua FO, Ogah E, Kunle OO.
Preliminary investigation of
physicochemical and functional properties of alpha cellulose obtained from waste paper - A potential pharmaceutical excipient. J Raw Mat Res. 2005;2:84- 93.
30. British Pharmacopoeia. Her Majesty Stationery Office, University Press Cambridge. 2009;11:A366- A327.
31. Umeh ONC, Nworah, AC, Ofoefule SI. Physico-chemical properties of microcrystalline cellulose derived from Indian Bamboo (Bambusa vulgaris). Int. J. Pharm Sci. Rev. Res. 2014;29(2):5-9. 32. Hasan MM, Chowdhury SS, Lina SMM,
Bhoumik NC, Ashab I. Comparative evaluation of Zea mays (L.) and Ipomoea batatas (L.) as a pharmaceutical excipient. IOSR-JPBS. 2012;3:31-36.
33. Kornblum SS, Stoopak SB. A new tablet disintegrant agent: cross linked polyvinylpyrollidone. J. of Pharm. Sci. 1973;62(1):43-49.
34. Achor M, Oyeniyi YJ, Yahaya A. Extraction and characterization of microcrystalline cellulose obtained from the back of the fruit of Lageriana siceraria (water gourd). J. App. Pharm. Sci. 2014;4(1):57-60.
35. Ansel CH, Popovich GN, Allen, VL. Ansel’s pharmaceutical dosage forms and drug
delivery systems. New York: Lippincott Williams and Wilkins. 2005;189.
36. Oluwasina O, Lajide L, Owolabi B. Microcrystalline cellulose from plant wastes through sodium hydroxide-Anthraquinone-Ethanol pulping. BioResources. 2014;9(4):6166-6192. 37. Baehr M, Fuhrer C, Puls P. Molecular
weight distribution, hemicellulose content and batch conformity of pharmaceutical cellulose powders. European Journal of Pharmaceutics and Biopharmaceutics. 1991;37(3):136-141.
38. Lanz M. Pharmaceutical powder Technology: Towards a science based understanding of the behavior of powder system. Inaugural Dissertation. 2006;13-31.
39. Muazu J, Musa H, Isah AB, Bhatia PG, Tom GM. Extraction and characterization of Kaffir potato starch: A potential source of pharmaceutical raw material. J. Nat. Prod. Plant Resour. 2011;1:41-49.
40. Fowler HW. Powder flow and compaction. In: Carter SJ, (Ed) Cooper and Gunn's Tutorial Pharmacy, 6th Edn. CBS Publishers, Delhi; 2000.
41. Caramella C. Novel methods for disintegrant characterization, part 1. Pharm Technol. 1991;48-56.
42. Stamm AF. Wood and cellulose science. The Ronald Press Company, New York. 1964;132-165.
43. Isah AB, Olorunsola EO, Zaman YE. Physicochemical properties of Borassum acthiopum starch. Asian J. Pharm. Cli. Res. 2012;5(Suppl 3):132-134.
44. Mathew AP, Oksman K, Sain M. The effect
of morphology and chemical
characteristics of cellulose reinforcements on the crystallinity of polylactic acid. Journal of Applied Polymer Science. 2006;101:300–310.
45. Bhimte NA, Tayade PT. Evaluation of microcrystalline cellulose prepared from sisal fibers as a tablet excipieint: A technical note. AAPS PharmSciTech. 2007;8(1):E1-E7.
_________________________________________________________________________________ © 2018 Nwajiobi et al.; This is an Open Access article distributed under the terms of the Creative Commons Attribution License (http://creativecommons.org/licenses/by/4.0), which permits unrestricted use, distribution, and reproduction in any medium, provided the original work is properly cited.
Peer-review history: