Genome-wide analysis of salinity-stress
induced DNA methylation alterations in
cotton (
Gossypium hirsutum
L.) using the
Me-DIP sequencing technology
X.K. Lu1, N. Shu1, J.J. Wang2, X.G. Chen2, D.L. Wang2, S. Wang2, W.L. Fan2, X.N. Guo2, L.X. Guo2 and W.W. Ye2
1College of Agronomy, Xinjiang Agricultural University, Urumqi, China 2State Key Laboratory of Cotton Biology/Key Laboratory for Cotton Genetic
Improvement, Ministry/Institute of Cotton Research of Chinese Academy of Agricultural Sciences, Anyang, Henan, China
Corresponding authors: W.W. Ye E-mail: [email protected]
Genet. Mol. Res. 16 (2): gmr16029673 Received March 20, 2017
Accepted May 15, 2017 Published June 29, 2017
DOI http://dx.doi.org/10.4238/gmr16029673
Copyright © 2017 The Authors. This is an open-access article distributed under the terms of the Creative Commons Attribution ShareAlike (CC BY-SA) 4.0 License.
methylation density was found in the upstream2k and downstream2k elements of the CDS region and CG-islands. Almost 94% of the reads belonged to LTR-gspsy and LTR-copia, and the number of methylation reads in LTR-gypsy was four times greater than that in LTR-copia in both control and stressed samples. The analysis of differentially methylated regions (DMRs) showed that the gene elements upstream2k, intron, and downstream2k were hypomethylated, but the CDS regions were hypermethylated. The GO (Gene Ontology) analysis suggested that the methylated genes were most enriched in cellular processes, metabolic processes, cell parts and catalytic activities, which might be closely correlated with response to NaCl stress. In this study, we completed a genomic DNA methylation profile and conducted a DMR analysis under salt stress, which provided valuable information for the better understanding of epigenetics in response to salt stress in cotton.
Key words: DNA Methylation; MeDIP-sequencing; Salinity stress; Differentially methylated regions (DMRs); Gene elements
INTRODUCTION
Close connection has been found between stress and epigenetics (Zhao et al., 2010). Especially, cytosine DNA methylation is implicated in genomic imprinting (Constância et al., 1998), gene regulation (Shen et al., 2012), X-inactivation (Migeon, 1992), and determination of chromatin structure (Razin, 1998). In plant cells, methylated cytosine (5mC)
usually occurs in CG- (CpG), CHG-, and CHH- contexts (Henderson and Jacobsen, 2007). The transformation state of CpG methylation can regulate the stabilization of chromatin structure and transcription mechanism of genes or gene families (Ehrlich and Lacey, 2013). In mammals, DNA methylation, which primarily occurs at the CG dinucleotides, is usually catalyzed by the de novo methyltransferases DNMT3a/b and maintenance methyltransferase DNMT1 (Goll and Bestor, 2005). However, in plants, MET1, with a homologue of mammalian DNMT1, and CMT3, a plant-specific methyltransferase, are responsible for methylation (Chan et al., 2005).
al., 1993; Kakutani et al., 1995). Therefore, DNA methylation was regarded as a defense and regulatory mechanism against some selfish DNA elements (Elhamamsy, 2016). The entire genomic distribution of the salt-stress-induced DNA methylation sites remains unclear, mainly due to the limitations of the technologies for detecting DNA methylation sites. For example, the conventional strategy MSAP (DNA-methylation sensitive amplification polymorphism) using methylation-sensitive restriction enzymes was limited by the digested sequence context of chosen enzymes (Yaish et al., 2014). DNA methylation regulating plant gene expression was widely studied in response to various environmental stimuli, including salt (Tan, 2010; Marconi et al., 2013), drought (Wang et al., 2011), cold (Shan et al., 2013), and metals (Kimatu et al., 2011). Based on the previous research in our laboratory, salt stress could lead to the alterations of DNA methylation pattern (Lu et al., 2015). Previous studies have proposed that the stress-induced methylation re-patterning can lead to more genetic variations, which in turn could be more adaptive in response to stress (Bond and Finnegan, 2007; Boyko et al., 2007).
Recently, a number of strategies have been described for detecting DNA methylation with high resolution. One of them, bisulfite-sequencing, which uses sodium bisulfite to convert all unmethylated cytosines to uracils, but leaves the methylated cytosines unchanged, was regarded as a ‘gold’ method (Grigg and Clark, 1994); However, MeDIP-Seq (methylated DNA immunoprecipitation sequencing) is a more cost-effective method, which uses an antibody against 5-methylcytosine to enrich methylated DNA fragments (Ruike et al., 2010). In this process, the highly methylated DNA fragments were enriched and sequenced using a high-throughput sequencing method. A genome-wide map has been successfully realized in human spermatozoa and breast cancer cells using Me-DIP analysis in conjunction with high-throughput sequencing (MeDIP-seq) (Down et al., 2008; Ruike et al., 2010).
In this study, we deciphered an essentially complete whole-genome DNA methylation map in G. hirsutum L. under salt stress using MeDIP-Seq. Although some studies have reported the whole-genome DNA methylation distribution in G. hirsutum L. (Cao et al., 2011; Fan et al., 2013; Lu et al., 2015), the high-resolution studies of DNA methylation have not been reported in cotton, and the biological significance of methylation distribution in G. hirsutum L. remains essentially unknown. In this study, we determined the effects and mechanisms of salt stress on DNA methylome alterations in G. hirsutum L., which could provide valuable insights for conducting further epigenetic studies, investigating the mechanism of salt-tolerance, and breeding of stress-resistant cotton.
MATERIAL AND METHODS
Plant materials and growth conditions
et al., 2010), while the control plants were watered with the same volume of pure water. This salt-treatment method was used in our lab for a long time, and is now regarded as a criterion for identifying the salt-tolerance of cotton. The 2nd and 3rd true leaves of the salt-treated and control plants were collected after a 24-h treatment, respectively, and stored at -80°C for use. Highly pure genomic DNA (handled with RNA enzyme) was isolated from the treated and non-treated cotton leaves, and quantified using NanoDrop (Thermo Scientific, MA, USA) and checked for the integrity on 1% (w/v) agarose gel.
Methylated DNA immune-precipitation, library construction, and sequencing
MeDIP-Seq libraries were constructed with the high-quality DNA samples that were extracted using the improved cetyl trimethylammonium bromide (CTAB) method (Yadav et al., 2012). First, the genomic DNA was fragmented to 100–-500 bp by sonication and the end of each DNA fragment was ligated to 3'-dA overhang and sequencing adaptors (Paired-end Sample Prep kit from Illumina, USA). Second, the double-stranded DNA was denatured, followed by the immunoprecipitation of DNA fragments with 5-mC antibody using the Magnetic
Methylated DNA Immunoprecipitation Kit (Diagenode, Liege, Belgium). Third, a real-time PCR (RT-PCR) was conducted to validate the quality of immunoprecipitated fragments using the HiScript® RT kit (Vazyme Biotech Co., Ltd., Jiangsu Sheng, China). Subsequently, the DNA fragments were used for PCR amplification, and the fragments of 200-300 bp were excised from the gel and purified using a gel extraction kit (TransGen Biotech, Beijing, China). The extracted fragments were quantified using the TranStart®Top Green qPCR Kit
(TransGen Biotech) on an ABI 7500 fast Analyzer (Life Technologies, Carlsbad, CA, USA). After qPCR analysis, the MeDIP-Seq libraries were sequenced on the Illumina HiSeq 2000 platform (Illumina Inc., San Diego, CA, USA). The raw data was processed and filtered for further analysis.
Real-time RT-PCR amplification
Total RNA was isolated and synthesized for the first strand. The total reaction mixture consisted of 2 μL cDNA, 5 μL 2X TransStart® Top Green qPCR Super Mix, 0.4 μL each
forward and reverse primer, 0.4 μL Passive Reference Dye (50X), and 6.8 μL ddH2O. Besides, a no-template control (NTC) reaction was performed to confirm the non-specific background amplification. A house-keeping gene (Actin) was used to control the accuracy of the experiment. The following reaction conditions were used for qPCR amplifications: initial denaturation at 94°C for 30 s, followed by 40-45 cycles of denaturation at 94°C for 5 s, annealing at 60°C for 34 s, and extension at 72°C for 10 s. To guarantee reproducibility, each gene was amplified in triplicate for each sample.
Bisulfite sequencing
μL DNA template (approximately 826.7 ng), 25 μL ddH2O, and 90 μL Bisulfite Mix. A total of 30 μL ddH2O was used to elute DNA in the final step. Subsequently, the processed reads were ligated to pMDTM19-T vector in a reaction mixture comprising 1 μL pMDTM19-T vector, 1 μL
insert DNA (about 0.3 pmol), and 3 μL ddH2O. The reaction mixture was incubated at 16°C for 30 min. After ligation, the vectors were transformed into DH5α competent cells and sequenced by the GENEWIZ Company (South Plainfield, NJ, USA).
Data processing and bioinformatics analysis
After sequencing, the data was filtered by removing adapter sequences, contamination, and low-quality reads from the raw reads. The standard for data filtering is: 1, removing the adapter; 2, removing reads containing more than 10% unknown nucleotides (N); 3, removing low quality reads. The clean data was stored in the fastq format. Subsequently, the sequenced reads were mapped onto the reference genome (G. hirsutum AtDtgenome) (Li et al., 2015). Only unique alignments with no more than two mismatches were used in further analysis (relevant software: SOAP2.21; Website: http://soap.genomics.org.cn). The methylated regions, methylated peaks, stress-related differentially methylated genes (DMGs), GO enrichment, and pathways were analyzed. The whole-genome peak scanning was performed using a defined analysis model (software: MACS 1.4.0; http://liulab.dfci.harvard.edu/MACS/). The pathways of differentially expressed genes (DEGs) were predicted using the Kyoto Encyclopedia of Genes and Genomes (KEGG) pathway database and the methylation sites were predicted using an online program (http://www.ebi.ac.uk/Tools/emboss/).
RESULTS
High-throughput sequencing analysis of MeDIP reads
Global distribution analysis of differentially methylated sequencing reads
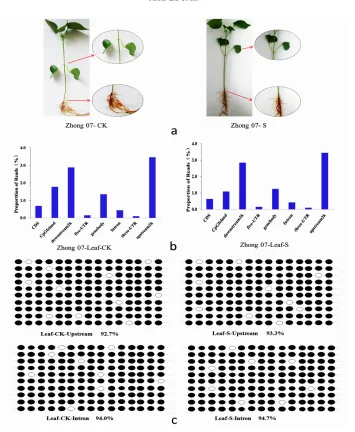
DNA methylation profile of the G. hirsutum L. genome provides important information about the distribution of differentially methylated regions. We divided the entire genome into 10-kb segments and counted the number of reads within each segment (Table S1). The maximum number of methylated reads was found on chromosome 9, followed by the number Figure 1. Validation of MeDIP-seq data by bisulfite sequencing. a. Morphological changes in the leaves of the salt-stressed plants compared with the control plants. b. Distribution of reads in different gene elements. c. Bisulfite-modified sequencing analysis of the highly methylated gene elements (up-stream and intron) from two samples.
Each line represents an independent clone. The unmethylated CpGs are marked by open circles and the methylated
of reads on chromosomes 16 and 2, and the reads on chromosome 26 were the least in both samples (Figure 2 and Table S1). However, after the NaCl stress, the situation was different. The greatest change occurred on chromosome 8 and the smallest on chromosomes 22 and 13. Chromosome 26 presented a hypo-methylation pattern after salt stress. A previous study (Wang et al., 2012) showed that the number of long-terminal repeat (LTR) retrotransposons on chromosome 8 was the maximum, indicating that the LTR retrotransposons exhibited a high level of methylation density in cotton. We also obtained an enrichment region of 79,752 reads in the 20-80 kb section of chromosome 13 in the control sample. However, we only found 66,089 reads at the same location after the stress treatment, and it showed a downward trend than that in control. Therefore, we deduced that these two sections might contain some important methylation sites or genes, and these sites or genes could be regulated by the alterations of DNA methylation in response to salt stress.
Figure 2. Genome-wide distribution of methylation fragments. a. An enrichment of methylation region on chromosome 13. b. Methylation changes in different cytosine contexts before and after the salt treatment.
Differentially methylated regions between the salt treatment and control
help us get a preliminary understanding of the features of methylation patterns on different gene elements (Figure 1b). The most uniquely mapped reads were located in the downstream 2k, upstream2k, CpG islands, and gene body regions, implying that many genes or regulatory sequences might be methylated during salt stress. Cytosine DNA methylation, a very important epigenetic modification that regulates gene expression, is responsive to environmental stresses in plants (Chodavarapu et al., 2012). Besides, the CpG islands and gene body regions were each divided into 40 equal regions, and the normalized number of reads was calculated for each region (Figure S1a). The results indicated that the number of reads in LTR-Gypsy was four times greater than the number of reads in LTR-copia in both samples. Only a small fraction of the reads exists in other repetitive elements. Many studies demonstrated that retrotransposons might be related with the environmental adaptation of plants (McClintock, 1984; Todorovska, 2007; Alzohairy et al., 2014). The results of RT-PCR with degenerate primers showed that the upregulation of LTR-retrotransposons was induced the treatment of NaCl. Retrotransposons are located in inter-genic regions, playing a role in the expression of genes, or influencing the expression of the adjacent genes (Krom et al., 2008; Le et al., 2007), but the true regulatory mechanism of retrotransposons in adverse conditions remains unknown.
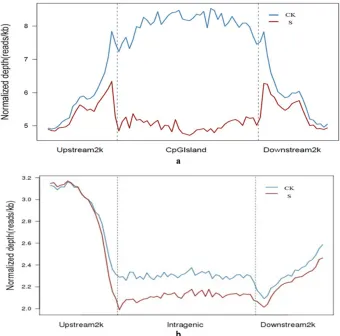
Further, we calculated the number of MeDIP sequencing reads in CpG islands and their upstream2k and downstream2k elements (Figure 3a). The results indicated that the methylation level of CpG islands in leaves was significantly lower than that in control after the salt stress treatment. Studies showed that the transcription of genes with HTF islands, in which CpG is abundant, is inhibited when the islands are methylated (Bird, 1986). After the NaCl treatment, the methylation level of CpG islands decreased. As CpG islands are often found in the promoter regions, we speculated that the demethylation of CpG islands could induce the reactivation or upregulation of relevant genes, which in turn was helpful in dealing with the stress. A decrease in the methylation level around gene body regions was observed after the stress treatment (Figure 3b). Small differences were observed between the control and stressed samples in the upstream2k/downstream2k elements around the genes. In the normal development of cotton seedlings, many genes were hypermethylated and showed no transcription. However, after the stress treatment, the expression of many salt-related genes was induced to different extents, causing a reduction in the methylation level in G. hirsutum L.
A genome-wide peak scanning was performed on the basis of a defined analysis model. The lengths of peaks and the number of CpG islands contained in each peak were computed (Figure S1b, 1c). The results indicated no significant difference between the two samples on the whole. Most of the peaks showed a length of >2000 bp. Besides, the CpG density was a slightly higher in the salt-stressed samples than that in the control samples (0-40). The number of CpGs in a peak can reflect the CpG density of a specific region. The results showed that most of peaks tended to be in the regions with a relatively low CpG density, and these regions might contain some very important stress regulatory sites, and the demethylation of these sites would lead the seedlings to acquire certain resistance under salt stress. The peaks in each gene element were counted, and the results showed that the number of peaks in each element under stress was a slightly greater than that in the control (Figure S2a). Most of the peaks were located in the upstream2k, downstream2k, and intron elements, which might have a vital role in the process of transcription.
most of the methylation sites in the CDS region were methylated in the growth stage, and only a small proportion was induced to be de-methylated under 0.4% NaCl stress in the salt-tolerant variety of plants. The coverage range of other gene elements, such as upstream2k, 5'-UTR, intron, and downstream2k, was slightly decreased after the stress treatment, but the coverage range of 3'-UTR was slightly higher than that of the control. Therefore, we deduced that it is not just one gene element nor some genes that have altered to deal with salt stress, but diversified gene elements or genes play a synergistic role in counteracting salt stress.
Figure 3. Distribution of reads around CpG islands and gene body. a. Distribution of reads around CpG islands. The x-axis indicates the position around CpG islands, and the y-axis indicates the normalized read number. This
figure reflects the methylation level around CpG islands (a, control; b, treatment). b. Distribution of reads around gene body. The x-axis indicates the position around gene body and the y-axis indicates the normalized read number.
This figure can reflect the methylation level around gene body.
Analysis of DMR-containing genes
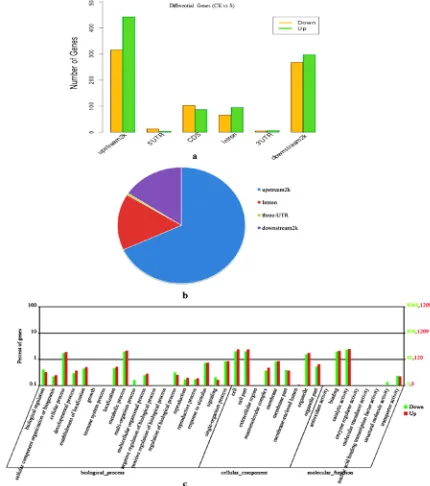
the number of reads in each sample was calculated. The numbers of reads were then assessed with chi-square statistics and FDR statistics to get true DMRs. DMRs were divided into two groups: the downtrend DMRs, in which the number of reads in the control sample was larger than that in the stressed sample, and the uptrend DMR, in which the situation was the opposite (The filtering standard was P ≤ 0.01. The difference in the number of reads should be more than twice in DMRs). The results indicated that the genes located in the elements upstream2k, intron, downstream2k, and 3'-UTR were hypomethylated compared to the control after the NaCl stress treatment, whereas the genes located in 5'-UTR and CDS showed a hypermethylated pattern. Furthermore, we analyzed the methylation events in the upstream2k, intron, downstream2k and 3'-UTR elements. As shown in Figure 4b, the number of DMGs in upstream2k was far more than that in any other gene elements, whereas the number of DMGs was the least in 3'-UTR. We then examined the DMGs in 5'-UTR and CDS and found that the CDS elements in stressed samples showed a hypermethylated pattern compared to the control sample. Compared to the control sample, the number of down-regulated genes in upstream2k, intron, downstream2k, and 3'-UTR was more than that of the up-regulated genes in stressed samples, but the situation was opposite in 5'-UTR and CDS. Although the genes upstream2k, 5'-UTR, 3'-UTR, intron, and downstream2k do not translate into proteins, the alteration of DNA methylation in these elements could lead to a change in the regulatory functions of these genes.
Figure 4. Analysis of differentially methylated regions (DMRs) between the control (CK) and salt-stressed (S) samples. a. Distribution of differentially methylated genes on gene different elements. The x-axis indicates different gene elements, and the y-axis indicates the gene number; the green bars represent hypermethylated genes, and the orange bars represent hypomethylated genes. b. Differentially methylated genes in different gene elements. c. GO
classification for differentially methyalted genes. The horizontal axis indicates the GO items (biological process,
GO enrichment analysis in response to NaCl treatment
To identify the possible pathways involved in NaCl-stress responses, the DMGs were functionally clustered via Gene Ontology analysis (http://www.geneontology.org/) to explore their biological functions (Zhou and Su, 2007). The gene ontology covers three domains: cellular component, the parts of a cell or its extracellular environment; molecular function, the elemental activities of a gene product at the molecular level, such as binding or catalysis; and biological process, the operations or sets of molecular events with a defined beginning and end, pertinent to the functioning of integrated living units, such as cells, tissues, organs, and organisms. The results (Figure 4c) showed that the “biological process” domain contained the maximum number of DEGs, and the “molecular function” domain contained the least number of DEGs. The results also demonstrated that some categories, such as the cellular process, metabolic process (biological process), cell, cell part (cellular component) and binding, and catalytic activity (molecular function) contained the maximum number of methylated genes, which were most closely linked to the NaCl-stress response. However, others categories, such as the biological regulation, response to stimulus (biological process), membrane, organelle part (cellular component) and structural molecular activity, transporter activity (molecular function), etc., had relatively few methylated genes, and they might be very important to plant growth and response to stimulus. The Kyoto Encyclopedia of Genes and Genomes (KEGG) pathway database was used to predict the putative functions of the identified genes containing DMRs. The output also revealed that FLS (LRR receptor-like serine/threonine-protein kinase) could be regulated by a change in its methylation pattern and might be involved in the MEKK-MKK-MPK signaling module, which in turn could regulate the WRKY transcription factors (Figures S3 and S4) that are closely related to the diverse stresses (Sun et al., 2015; Zhao et al., 2015).
DISCUSSION
We reported the results obtained from MeDIP-Seq analysis to provide the comprehensive, detailed genome-wide DNA methylation patterns in cotton. In cotton, the gene elements upstream2k, intron, downstream2k, and 3'-UTR showed a hypermethylated pattern before the stress treatment, but many DMGs were discovered with a hypo-methylated pattern after the NaCl stress treatment. The repeat elements showed a high methylation density, while the CDS and intron elements showed a relatively low methylation density. The results of this study were similar to those of the previous studies performed on other species, including plants and animals (Zhang et al., 2006; Yan et al., 2010; Li et al., 2011; Lee et al., 2014).
start site (TSS). Since DNA methylation interrupts the binding of transcription factors (Clark and Melki, 2002; Herman and Baylin, 2003), changes in methylation at the distal regions might affect the expression of a gene. Therefore, our comprehensive methylation maps helped us better understand the relationship between DNA methylation and transcription.
The comprehensive methylation maps also helped us to understand the relevance of retrotransposons and gene regulation. A large fraction of complex plant genomes are composed of transposable elements (TEs), which are present in nearly all sequenced genomes, both prokaryotic and eukaryotic. Retrotransposons, a major class of TEs, are abundant in plant genomes (Krom et al., 2008). LTR-retrotransposons, a class of retrotransposons, are divided into two major super-families, Copia and Gypsy (Vitte and Bennetzen, 2006). Approximately 95% of the reads obtained with MeDIP-Seq method were LTR-Gypsy and
LTR-Copia retrotransposons, and only a few reads were other retrotransposons, such as LINE-L1, CMC-EnSpm, MULE-MuDR, etc. The proportion of reads in the repeat elements was changed, although not very much, suggesting that the retrotransposons also play a role in gene regulation under salt stress. Studies showed that retrotransposons might act as important regulators of gene expression and functional diversification in rice (Krom et al., 2008). They comprise a significant fraction of the rice (34.9%) and maize (84.2%) genomes (Krom et al., 2008; Wolfgruber et al., 2009). In human genome, parts of Alu retrotransposons have been found to be recruited as exons when inserted in the intronic regions, creating novel alternative transcripts (Sorek et al., 2002; Sorek et al., 2004). This is because some chromosomal regions could provide a favorable environment for the insertions or illegitimate or homologous recombination of LTR-retrotransposons (Ma et al., 2004). Therefore, we speculated that the methylation regulation of retrotransposons in cotton might also be one of the stress response mechanisms.
However, the precise mechanism of DNA methylation regulating gene transcription and expression under the salt stress remains unclear. The results showed that the greatest changes occurred in the CpG-island-related regions, probably because most of DNA methylation usually occurs in the CG-(CpG)-context in cotton. The salt stress would result in moderate changes in the finite salt-related genes, which were regulated by their methylation pattern. In the normal growth of cotton seedlings, many genes are expressed to sustain its normal development, and when the adversity appears, the plants need to activate relevant mechanisms to regulate gene expression through DNA methylation changes, e.g., the change from hemi-methylation to complete methylation would lead to the down-regulation of a gene and the change from complete methylation to no methylation would lead to the upregulation of a gene.
Generally speaking, the differences in the DNA methylation patterns and levels between the control and NaCl-stressed samples might play a crucial role in generating stress response. Gene Ontology (GO), the de facto standard in gene functionality description, is widely used in functional annotation and enrichment analysis (Du et al., 2010). Some categories, such as cellular process, signal transduction, and metabolic process (biological process), cell, cell part (cellular component) and binding, and catalytic activity (molecular function), have several methylation-related genes, suggesting that the generation of salt-stress response is a multi-gene process. Cell signal transduction pathway plays a vital function in generating stress response. The MEKK-MKK-MPK module has been reported and well-studied to be related with signal transduction (Liang et al., 2013). For example, Arabidopsis MPK4 could be phosphorylated by the upstream MKK1/2 to regulate the WRKY transcription factors (Su et al., 2007; Qiu et al., 2008). Thus, we speculated that the MEKK-MKK-MPK module also was regulated with the methylation pattern changes at its upstream gene FLS, which might be a novel regulatory mode in stress response.
Conflicts of interest
The authors declare no conflict of interest.
ACKNOWLEDGMENTS
Research supported by the grant from the national key research projects (Grant #2016YFD0100203). We also appreciate the reviewers for their patience.
REFERENCES
Alzohairy AM, Sabir JSM, Gyulai G, Younis RAA, et al. (2014). Environmental stress activation of plant long-terminal repeat retrotransposons. Funct. Plant Biol. 41: 557-567. https://doi.org/10.1071/FP13339
Bird AP (1986). CpG-rich islands and the function of DNA methylation. Nature 321: 209-213. https://doi. org/10.1038/321209a0
Bond DM and Finnegan EJ (2007). Passing the message on: inheritance of epigenetic traits. Trends Plant Sci. 12: 211-216.
https://doi.org/10.1016/j.tplants.2007.03.010
Boyko A, Kathiria P, Zemp FJ, Yao Y, et al. (2007). Transgenerational changes in the genome stability and methylation in pathogen-infected plants: (virus-induced plant genome instability). Nucleic Acids Res. 35: 1714-1725. https://doi. org/10.1093/nar/gkm029
Cao DH, Gao X, Liu J, Kimatu JN, et al. (2011). Methylation sensitive amplified polymorphism (MSAP) reveals that
alkali stress triggers more DNA hypomethylation levels in cotton (Gossypium hirsutum L.) roots than salt stress. Afr. J. Biotechnol. 10: 18971-18980.
Chan SW, Henderson IR and Jacobsen SE (2005). Gardening the genome: DNA methylation in Arabidopsis thaliana.Nat. Rev. Genet. 6: 351-360. https://doi.org/10.1038/nrg1601
Chodavarapu RK, Feng S, Ding B, Simon SA, et al. (2012). Transcriptome and methylome interactions in rice hybrids.
Proc. Natl. Acad. Sci. USA 109: 12040-12045. https://doi.org/10.1073/pnas.1209297109
Clark SJ and Melki J (2002). DNA methylation and gene silencing in cancer: which is the guilty party? Oncogene 21: 5380-5387. https://doi.org/10.1038/sj.onc.1205598
Constância M, Pickard B, Kelsey G and Reik W (1998). Imprinting mechanisms. Genome Res. 8: 881-900. https://doi. org/10.1101/gr.8.9.881
Down TA, Rakyan VK, Turner DJ, Flicek P, et al. (2008). A Bayesian deconvolution strategy for
immunoprecipitation-based DNA methylome analysis. Nat. Biotechnol. 26: 779-785. https://doi.org/10.1038/nbt1414
Ehrlich M and Lacey M (2013). DNA methylation and differentiation: silencing, upregulation and modulation of gene expression. Epigenomics 5: 553-568. https://doi.org/10.2217/epi.13.43
Elhamamsy AR (2016). DNA methylation dynamics in plants and mammals: overview of regulation and dysregulation.
Cell Biochem. Funct. 34: 289-298. https://doi.org/10.1002/cbf.3183
Fan HH, Wei J, Li TC, Li ZP, et al. (2013). DNA methylation alterations of upland cotton (Gossypium hirsutum) in response to cold stress. Acta Physiol. Plant. 35: 2445-2453. https://doi.org/10.1007/s11738-013-1278-x
Field LM, Lyko F, Mandrioli M and Prantera G (2004). DNA methylation in insects. Insect Mol. Biol. 13: 109-115. https:// doi.org/10.1111/j.0962-1075.2004.00470.x
Finnegan EJ, Peacock WJ and Dennis ES (1996). Reduced DNA methylation in Arabidopsis thaliana results in abnormal plant development. Proc. Natl. Acad. Sci. USA 93: 8449-8454. https://doi.org/10.1073/pnas.93.16.8449
Goll MG and Bestor TH (2005). Eukaryotic cytosine methyltransferases. Annu. Rev. Biochem. 74: 481-514. https://doi. org/10.1146/annurev.biochem.74.010904.153721
Grigg G and Clark S (1994). Sequencing 5-methylcytosine residues in genomic DNA. BioEssays 16: 431-436. https://doi. org/10.1002/bies.950160612
Grunau C, Hindermann W and Rosenthal A (2000). Large-scale methylation analysis of human genomic DNA reveals
tissue-specific differences between the methylation profiles of genes and pseudogenes. Hum. Mol. Genet. 9: 2651-2663. https://doi.org/10.1093/hmg/9.18.2651
Haller F, Zhang JD, Moskalev EA and Braun A (2014). Combined DNA methylation and gene expression profiling in
gastrointestinal stromal tumors reveals hypomethylation of SPP1 as an independent prognostic factor. Int. J. Cancer. Henderson IR and Jacobsen SE (2007). Epigenetic inheritance in plants. Nature 447: 418-424. https://doi.org/10.1038/
nature05917
Herman JG and Baylin SB (2003). Gene silencing in cancer in association with promoter hypermethylation. N. Engl. J. Med. 349: 2042-2054. https://doi.org/10.1056/NEJMra023075
Kakutani T, Jeddeloh JA and Richards EJ (1995). Characterization of an Arabidopsis thaliana DNA hypomethylation mutant. Nucleic Acids Res. 23: 130-137. https://doi.org/10.1093/nar/23.1.130
Kakutani T, Kato M, Kinoshita T and Miura A (2004). Control of development and transposon movement by DNA methylation in Arabidopsis thaliana.Cold Spring Harb. Symp. Quant. Biol. 69: 139-143. https://doi.org/10.1101/ sqb.2004.69.139
Kato M, Miura A, Bender J, Jacobsen SE, et al. (2003). Role of CG and non-CG methylation in immobilization of transposons in Arabidopsis. Curr. Biol. 13: 421-426. https://doi.org/10.1016/S0960-9822(03)00106-4
Kimatu JN, Diarso M, Song CD, Agboola RS, et al. (2011). DNA cytosine methylation alterations associated with aluminium toxicity and low pH in Sorghum bicolor. Afr. J. Agric. Res. 6: 4579-4593.
Klose RJ and Bird AP (2006). Genomic DNA methylation: the mark and its mediators. Trends Biochem. Sci. 31: 89-97.
https://doi.org/10.1016/j.tibs.2005.12.008
Krom N, Recla J and Ramakrishna W (2008). Analysis of genes associated with retrotransposons in the rice genome.
Genetica 134: 297-310. https://doi.org/10.1007/s10709-007-9237-3
Le QH, Melayah D, Bonnivard E, Petit M, et al. (2007). Distribution dynamics of the Tnt1 retrotransposon in tobacco. Mol. Genet. Genomics 278: 639-651. https://doi.org/10.1007/s00438-007-0281-6
Lee JR, Hong CP, Moon JW, Jung YD, et al. (2014). Genome-wide analysis of DNA methylation patterns in horse. BMC Genomics 15: 598. https://doi.org/10.1186/1471-2164-15-598
Li F, Fan G, Lu C, Xiao G, et al. (2015). Genome sequence of cultivated Upland cotton (Gossypium hirsutum TM-1) provides insights into genome evolution. Nat. Biotechnol. 33: 524-530. https://doi.org/10.1038/nbt.3208
Li Q, Li N, Hu X, Li J, et al. (2011). Genome-wide mapping of DNA methylation in chicken. PLoS One 6: e19428. https:// doi.org/10.1371/journal.pone.0019428
Liang W, Yang B, Yu BJ, Zhou Z, et al. (2013). Identification and analysis of MKK and MPK gene families in canola
(Brassica napus L.). BMC Genomics 14: 392. https://doi.org/10.1186/1471-2164-14-392
Lorincz MC, Dickerson DR, Schmitt M and Groudine M (2004). Intragenic DNA methylation alters chromatin structure
and elongation efficiency in mammalian cells. Nat. Struct. Mol. Biol. 11: 1068-1075. https://doi.org/10.1038/nsmb840
Lu XK, Zhao XJ, Wang DL, Yin ZJ, et al. (2015). Whole-genome DNA methylation analysis in cotton (Gossypium hirsutum L.) under different salt stresses. Turk. J. Biol. 39: 396-406. https://doi.org/10.3906/biy-1411-61
Ma J, Devos KM and Bennetzen JL (2004). Analyses of LTR-retrotransposon structures reveal recent and rapid genomic DNA loss in rice. Genome Res. 14: 860-869. https://doi.org/10.1101/gr.1466204
McClintock B (1984). The significance of responses of the genome to challenge. Science 226: 792-801. https://doi. org/10.1126/science.15739260
Migeon BR (1992). Concerning the role of X-inactivation and DNA methylation in fragile X syndrome. Am. J. Med. Genet. 43: 291-298. https://doi.org/10.1002/ajmg.1320430145
Qiu JL, Fiil BK, Petersen K, Nielsen HB, et al. (2008). Arabidopsis MAP kinase 4 regulates gene expression through
transcription factor release in the nucleus. EMBO J. 27: 2214-2221. https://doi.org/10.1038/emboj.2008.147
Razin A (1998). CpG methylation, chromatin structure and gene silencing-a three-way connection. EMBO J. 17: 4905-4908. https://doi.org/10.1093/emboj/17.17.4905
Ruike Y, Imanaka Y, Sato F, Shimizu K, et al. (2010). Genome-wide analysis of aberrant methylation in human breast cancer cells using methyl-DNA immunoprecipitation combined with high-throughput sequencing. BMC Genomics
11: 137. https://doi.org/10.1186/1471-2164-11-137
Selker EU (2004). Genome defense and DNA methylation in Neurospora. Cold Spring Harb. Symp. Quant. Biol. 69: 119-124. https://doi.org/10.1101/sqb.2004.69.119
Shan XH, Wang XY, Yang G, Wu Y, et al. (2013). Analysis of the DNA methylation of maize (Zea mays L.) in response to
cold stress based on methylation-sensitive amplified polymorphisms. J. Plant Biol. 56: 32-38. https://doi.org/10.1007/ s12374-012-0251-3
Shen H, He H, Li J, Chen W, et al. (2012). Genome-wide analysis of DNA methylation and gene expression changes in two Arabidopsis ecotypes and their reciprocal hybrids. Plant Cell 24: 875-892. https://doi.org/10.1105/tpc.111.094870
Shukla S, Kavak E, Gregory M, Imashimizu M, et al. (2011). CTCF-promoted RNA polymerase II pausing links DNA methylation to splicing. Nature 479: 74-79. https://doi.org/10.1038/nature10442
Simmen MW, Leitgeb S, Charlton J, Jones SJ, et al. (1999). Nonmethylated transposable elements and methylated genes in a chordate genome. Science 283: 1164-1167. https://doi.org/10.1126/science.283.5405.1164
Sorek R, Ast G and Graur D (2002). Alu-containing exons are alternatively spliced. Genome Res. 12: 1060-1067. https:// doi.org/10.1101/gr.229302
Sorek R, Lev-Maor G, Reznik M, Dagan T, et al. (2004). Minimal conditions for exonization of intronic sequences: 5' splice site formation in alu exons. Mol. Cell 14: 221-231. https://doi.org/10.1016/S1097-2765(04)00181-9
Su SH, Suarez-Rodriguez MC and Krysan P (2007). Genetic interaction and phenotypic analysis of the Arabidopsis MAP kinase pathway mutations mekk1 and mpk4 suggests signaling pathway complexity. FEBS Lett. 581: 3171-3177.
https://doi.org/10.1016/j.febslet.2007.05.083
Sun H, Chen ZH, Chen F, Xie L, et al. (2015). DNA microarray revealed and RNAi plants confirmed key genes conferring
low Cd accumulation in barley grains. BMC Plant Biol. 15: 259. https://doi.org/10.1186/s12870-015-0648-5
Tan MP (2010). Analysis of DNA methylation of maize in response to osmotic and salt stress based on
methylation-sensitive amplified polymorphism. Plant Physiol. Biochem. 48: 21-26. https://doi.org/10.1016/j.plaphy.2009.10.005
Teklemariam T, Purandare B, Zhao L and Hantash BM (2014). Inhibition of DNA methylation enhances HLA-G expression in human mesenchymal stem cells. Biochem. Biophys. Res. Commun. 452: 753-759. https://doi.org/10.1016/j. bbrc.2014.08.152
Todorovska E (2007). Retrotransposons and their role in plant - Genome evolution. Biotechnol. Biotechnol. Equip. 21: 294-305. https://doi.org/10.1080/13102818.2007.10817464
Tran RK, Henikoff JG, Zilberman D, Ditt RF, et al. (2005). DNA methylation profiling identifies CG methylation clusters
in Arabidopsis genes. Curr. Biol. 15: 154-159. https://doi.org/10.1016/j.cub.2005.01.008
Vitte C and Bennetzen JL (2006). Analysis of retrotransposon structural diversity uncovers properties and propensities
in angiosperm genome evolution. Proc. Natl. Acad. Sci. USA 103: 17638-17643. https://doi.org/10.1073/ pnas.0605618103
Vongs A, Kakutani T, Martienssen RA and Richards EJ (1993). Arabidopsis thaliana DNA methylation mutants. Science
260: 1926-1928. https://doi.org/10.1126/science.8316832
Wang K, Wang Z, Li F, Ye W, et al. (2012). The draft genome of a diploid cotton Gossypium raimondii. Nat. Genet. 44: 1098-1103. https://doi.org/10.1038/ng.2371
Wang WS, Pan YJ, Zhao XQ, Dwivedi D, et al. (2011). Drought-induced site-specific DNA methylation and its association
with drought tolerance in rice (Oryza sativa L.). J. Exp. Bot. 62: 1951-1960. https://doi.org/10.1093/jxb/erq391
Wockner LF, Noble EP, Lawford BR, Young RM, et al. (2014). Genome-wide DNA methylation analysis of human brain tissue from schizophrenia patients. Transl. Psychiatry 4: e339. https://doi.org/10.1038/tp.2013.111
Wolfgruber TK, Sharma A, Schneider KL, Albert PS, et al. (2009). Maize centromere structure and evolution: sequence analysis of centromeres 2 and 5 reveals dynamic Loci shaped primarily by retrotransposons. PLoS Genet. 5: e1000743. https://doi.org/10.1371/journal.pgen.1000743
map. Nat. Biotechnol. 28: 516-520. https://doi.org/10.1038/nbt.1626
Yadav SK, Vashisht V and Gaurav SS (2012). An efficient and rapid method of DNA extraction for molecular marker
studies in cotton (Gossypium hirsutum L.). Vegetos 25: 13-19.
Yaish MW, Peng M and Rothstein SJ (2014). Global DNA methylation analysis using methyl-sensitive amplification
polymorphism (MSAP). Methods Mol. Biol. 1062: 285-298. https://doi.org/10.1007/978-1-62703-580-4_16
Yan H, Kikuchi S, Neumann P, Zhang W, et al. (2010). Genome-wide mapping of cytosine methylation revealed dynamic DNA methylation patterns associated with genes and centromeres in rice. Plant J. 63: 353-365. https://doi. org/10.1111/j.1365-313X.2010.04246.x
Zhang X, Yazaki J, Sundaresan A, Cokus S, et al. (2006). Genome-wide high-resolution mapping and functional analysis of DNA methylation in arabidopsis. Cell 126: 1189-1201. https://doi.org/10.1016/j.cell.2006.08.003
Zhao H, Wang S, Chen S, Jiang J, et al. (2015). Phylogenetic and stress-responsive expression analysis of 20 WRKY genes in Populus simonii × Populus nigra. Gene 565: 130-139. https://doi.org/10.1016/j.gene.2015.04.002
Zhao YL, Yu SX, Ye WW and Wang HM (2010). Study on DNA cytosine methylation of cotton (Gossypium hirsutum
L.) genome and its implication for salt tolerance. Agric. Sci. China 9: 783-791. https://doi.org/10.1016/S1671-2927(09)60155-3
Zhou X and Su Z (2007). EasyGO: Gene Ontology-based annotation and functional enrichment analysis tool for agronomical species. BMC Genomics 8: 246. https://doi.org/10.1186/1471-2164-8-246
Supplementary material
Table S1. Number of reads in each chromosome.
Figure S1. Distribution of reads on different elements and around CpG island. Distribution of reads on different elements and around CpG island. Each vertical red bar represents the signal ratio of the immunoprecipitated DNA. CK represents the distribution of methylated reads in the control sample and S represents the salt-stressed sample. The black box showed the enrichment region of methylation reads.
Figure S2. Distribution of reads on different elements and around CpG island. Distribution of reads on different elements and around CpG island. (a) Distribution of reads in repetitive elements. The x-axis indicates the repetitive
elements, and the y-axis indicates the proportion of reads in a specific repetitive element. This figure shows the
distribution of reads varies in different repetitive elements. (b) Distribution of peaks varies with peak length. The
x-axis indicates the range of peak lengths, and the y-axis indicates the number of peaks in a specific range. (c) Peak distribution varies with the density of CpG. The x-axis indicates the range of the number of CpGs in a peak, and the
y-axis indicates the proportion of peaks in a specific range.
Figure S3. Pathway analysis in response to salt stress. Distribution of reads in different gene elements and around CpG Island. (a) Number of peaks on each gene element. The x-axis indicates different gene elements, and the y-axis
indicates the number of peaks in a specific gene element. (b) The coverage of peaks on each gene element. The
x-axis indicates different gene elements, and the y-axis indicates the coverage of peaks in a specific gene element.
Figure S4. Pathway analysis in response to salt stress. (a) Pathway analysis in response to salt stress (P value <0.01;