Original Research Article
Patient satisfaction with inpatient services in a public tertiary hospital
in Trinidad and Tobago: associated factors and predictors
Mandreker Bahall
1*, George Legall
2INTRODUCTION
Patient satisfaction impacts on hospital care and is a major predictor of the reputation and image of the public health sector. However, attaining and interpreting patient satisfaction can be challenging. Definitions of patient satisfaction vary, including ‘the degree to which desired goals have been achieved,’ and ‘the degree to which health services for individuals and populations increase
the likelihood of desired health outcomes and are consistent with current professional knowledge’.1,2
Patient satisfaction is determined by a complex mixture of perceived need, expectations, experience of care, and socio-demographic factors; it is increasingly viewed ‘as a meaningful indicator of health services quality where it does not matter if patients are right or wrong.3-5 Patients’ views are thus regarded as having ‘an equal footing with professionals while analysing dysfunctions, choosing ABSTRACT
Background: Patient experience is an important factor in assessing the quality of healthcare. Numerous reports highlight the continued inconsistencies in healthcare and poor patient satisfaction affecting outcomes. This study aimed to assess patient satisfaction in a teaching hospital in Trinidad and Tobago.
Methods: A cohort study was conducted among recently discharged patients from the largest teaching hospital in Trinidad and Tobago. The survey instrument was an adaptation of the Picker Patient Experience Questionnaire. Data were collected from January 1, 2017 to March 2017, using face-to-face interviews. SPSS version 21 was used for descriptive and inferential analysis of data.
Results: The majority of the 300 participants was female (n=157; 53.3%), aged over 35 years (n=202; 67.3%) with secondary school education (n=137; 45.7%). Satisfaction levels ranged from 50% and 70% for management issues, treatment-related communication issues, environmental issues, and deportment of medical staff. Patient satisfaction with treatment-related support and hotel services was less than 50%. All satisfaction domains were inter-dependent with the highest correlation between treatment-related communication and management issues (r=0.691; p≤0.001) and the lowest between support services and hotel services (r=0.311; p≤0.001). Education was the only factor that was both associated with, and a predictor of, patient satisfaction. Satisfaction level decreased with increased education level.
Conclusions: Low satisfaction was found with treatment-related support and hotel services with education level as the only predictor. Steps are needed to ensure periodical satisfaction monitoring and continuous improvement of services such as support and hotel services.
Keywords: Basic health services, Health outcomes, Health reform, Patient satisfaction
1
School of Medicine and Arthur Lok Jack Graduate School of Business, 2Department of Food Production and Agriculture, University of the West Indies, St. Augustine, Trinidad and Tobago
Received: 12 June 2019
Accepted: 18 July 2019
*Correspondence:
Dr. Mandreker Bahall,
E-mail: [email protected]
Copyright: © the author(s), publisher and licensee Medip Academy. This is an open-access article distributed under the terms of the Creative Commons Attribution Non-Commercial License, which permits unrestricted non-commercial use, distribution, and reproduction in any medium, provided the original work is properly cited.
themes to prioritise, searching for possible solutions, and implementing them’.6
Poor services are associated with poor patient satisfaction.7,8
In 1989, the World Health Organization (WHO) identified patient satisfaction assessment as ‘an integral part of any quality assurance programme’.9
The Joint Commission on the Accreditation of Healthcare Organizations embraced patient satisfaction as a valid indicator and, in 1994, mandated that ‘the organization gathers, assesses, and takes appropriate action on information that relates to patient’s satisfaction with service provided’.10
Donabedian (1966) argued that, ‘the ultimate validator of the quality of care is its effectiveness in achieving or producing health and satisfaction’.11
It is used to assess medical interventions, to detect systemic pitfalls and gaps that hinder achieving targets, and to reward high achievers. According to Javier Garcia-Lacalle, ‘patient feedback should be a key component of a well-run system of performance assessment’.12
Customer satisfaction, therefore, is integral to a quality health service; it is a major indicator of performance,particularly on non-technical outcomes.11-16 With this paradigm shift to patient satisfaction and quality of life, modern healthcare systems are adopting a more people- and client-centered approach to deliver healthcare services.17,18
Local situation
Many improvement strategies have been introduced since the Moyne Commission of Inquiry of 1937. In 1996, quality departments in each regional health authority (RHA) were created for customer relations and feedback. Introduction of customer satisfaction surveys. In 2013 and 2014, the Ministry of Health employed customer relations officers to assist patients and resolve problems. Greater use of the patient’s charter, and customer relations and quality departments, in keeping with the South West Regional Health Authority’s (SWRHA) mission for ‘customer focused healthcare’.19 In 2012, a new teaching hospital wing was built to provide a more comfortable patient environment and enhance medical teaching facilities. These changes were expected to increase customer satisfaction. However, numerous reports attested to the continued need for reform, including ‘not enough beds, equipment, facilities, supplies, medical and nursing staff — and unsatisfactory working conditions including inadequate remuneration that have beset our hospitals for decades’; ‘begging for a bed’; ‘Shortage of medical supplies at SWRHA’; ‘Hospitals at crisis point’; ‘No medicine for cancer patients’; ‘1,200 waiting for CT, MRI scans’; and ‘Nursing shortage’.20-26
Such recurrent complaints influence customer satisfaction.
This study’s objective is to review patient satisfaction, assesses patient satisfaction interventions, and identifies associations and predictors of customer satisfaction of
inpatients of a public health institute in the context of health reform.
METHODS
This cohort study assessed satisfaction levels with hospital care among former inpatients of public hospitals in Trinidad and Tobago (TT) to identify associations and predictors of satisfaction. The sample comprised 300 patients admitted in 2017, which was determined by the following formula, calculated as the minimum number needed to estimate prevalence of overall satisfaction with a 5% margin of error:
where, n=required sample size, N=number of inpatients discharged from public hospitals in TT after a minimum stay of three days, p=percentage estimate of ex-inpatients satisfied with the quality of hospital care and services they had received, d=margin of error (usually set at 5%), and =standard normal distribution value.27
The inclusion criteria was being at least 18 years of age at the time of the study, and a minimum ward stay of three consecutive days. Patients were excluded if their physical condition made participation difficult. The sampling frame was the patient discharge listing. Eligible patients were given details of the study’s purpose before inviting them to participate. Quota sampling was used to obtain 300 patients. Data were collected from January 1, 2017 to March 2017, using face-to-face interviews.
Data collection and analysis
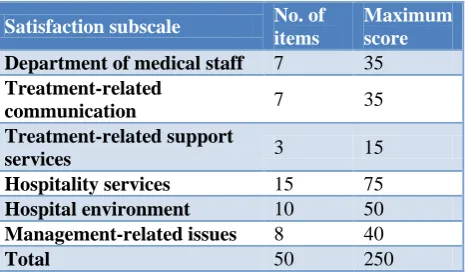
The data collection instrument was a 50-item questionnaire containing demography-related variables, which has measured patient satisfaction in several studies. The instrument was divided into the six subscales (Table 1).
Table 1: Questionnaire subscales with number of items and maximum scores.
Satisfaction subscale No. of
items
Maximum score
Department of medical staff 7 35
Treatment-related
communication 7 35 Treatment-related support
services 3 15
Hospitality services 15 75
Hospital environment 10 50
Management-related issues 8 40
As a means of avoiding data bias that might occur due to memory recall and responses tinged by memories of prior stay(s) participants who had been awarded more than once previously were reminded that their responses must be with reference only to their most recent hospital stay.
Questionnaire response options were coded as follows: 1=very dissatisfied; 2=dissatisfied; 3=no opinion; 4=satisfied; and 5=very satisfied. Responses were then classified as either a ‘Negative response’ and assigned a satisfaction score of 0 if the patient reported being ‘Very dissatisfied’ or ‘Dissatisfied); and a ‘ Positive response’ , and given a satisfaction score of 1, if the patient reported being ‘Very Satisfied’ or ‘Satisfied’. ‘No opinion’ was treated as a non-response and not scored.
The maximum possible satisfaction score was 250; patients with scores >125 were classified as ‘Satisfied’; with those scores 125 or less were classified as ‘Not satisfied’. Because the maximum possible scores were not the same across all domains, total domain scores were represented as percentages to facilitate certain statistical analyses.
SPSS (version 21) was used, together with MINITAB version 18, for descriptive and inferential data analysis, and Microsoft EXCEL was used to form tables and produce graphs. Descriptive statistics methods included frequency and percentage distribution tables, graphs, and summary statistics (proportions, means, and standard deviations); inferential methods included 95% confidence intervals, hypothesis testing, and multiple linear, regression analysis.
The study was approved by the ethics committee of the South West Regional Health Authority (SWRHA) of TT.
RESULTS
A sample of 300 inpatients participated within the data collection period (total number of inpatients approached was not recorded). The questionnaire’s overall reliability (Cronbach’s alpha) was 0.969; subscales reliability ranged from 0.865 to 0.925 (Table 2).
Table 2: Subscale and overall reliability of the questionnaire.
Satisfaction subscale n Cronbach's alpha
Deportment of medical staff
7 0.904
Treatment-related communication
7 0.918
Treatment-related support services
3 0.865
Hotel services 15 0.925
Hospital environment 10 0.889
Management-related issues
8 0.884
Overall 50 0.969
Table 3: Frequency and percentage distribution of selected demographic variables.
Variable N %
Gender
Male 143 47.7
Female 157 53.3
Age group (in years)
<26 31 10.3
26–35 54 18.0
36–45 62 20.7
46–55 46 15.3
56–65 50 16.7
Over 65 44 14.7
Unknown 13 4.3
Highest level of education
Less than primary 30 30.0
Primary 69 23.0
Secondary 137 45.7
Tertiary 51 17.0
Unknown 13 4.3
Table 3 shows selected demographic characteristics of the study participants. They were predominantly female (n=157; 53.3%), over 35 years of age (n=215; 71.7%), and had up to a secondary school education (n=137; 45.7%). The majority (n=175; 58.3%) was from the medical ward, followed by the surgical (27%; n=81), paediatric (2.0%); maternity (1.7%), and other wards (11.0%). The mean age was 45.4±18.83 years overall; by sex, males and females were 45±18.44 years and 42.5±18.79 years, respectively. The difference in mean age between males and females was statistically significant (p=0.023).
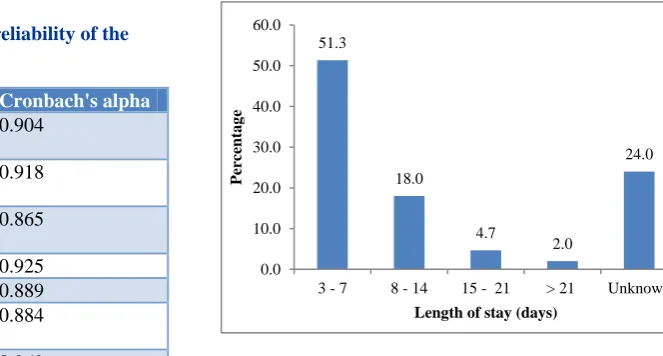
More than half the patients (n=154; 51.3%) stayed 3–7 days, 6 (2.5%) stayed longer than three weeks, and the length of stay for 72 (24.0%) was not recorded. Further descriptive data analysis showed that the mean length of stay was 7.6±6.9 days; the mode was 4 days (n=48, 211) and the median length of stay was 5 days (Figure 1).
Figure 1: Length of hospital stay. 51.3
18.0
4.7
2.0
24.0
0.0 10.0 20.0 30.0 40.0 50.0 60.0
3 - 7 8 - 14 15 - 21 > 21 Unknown
Perc
entag
e
Satisfaction scores
The majority (n=164; 71.9 %) were satisfied with their overall hospital experience. Table 4 shows satisfaction
scores by subscale and overall. For all but two subscales (treatment-related support and hotel services), the median was higher than the mean score. This was also true regarding the total score.
Table 4: Selected summary statistics: satisfaction scores.
Satisfaction subscale Summary statistics
Maximum score Mean (std. dev) Range Median Department of medical staff 35 23.0 (9.70) 0–35 26
Treatment-related communication 35 23.4 (9.61) 0–35 28
Treatment-related support services 15 3.4 (9.99) 0–6 3.4
Hotel services 75 34.9 (16.78) 0–75 34
Hospital environment 50 26.6 (11.97) 0–50 28
Management-related issues 40 27.4 (11.17) 0–40 32
Overall 250 138.9 (51.96) 0–222 149.4
Table 5: 95% CI for mean satisfaction score.
Domain 95% CI for mean
Mean (%) Std. dev Lower bound Upper bound Department of medical staff 65.8 27.62 62.1 69.3
Treatment-related communication 67.1 27.47 63.3 70.5
Treatment-related support services 23.1 13.37 25.7 29.1
Hotel services 47.3 22.02 43.6 49.4
Hospital environment 53.9 23.36 50.1 56.3
Management-related issues 69.7 27.19 64.9 72.1
Overall 55.2 20.73 52.9 58.3
Table 6: P values for tests of equality of satisfaction scores.
Satisfaction domain Dependent variable: p values for F-test of equality of means
Sex Age Education Length of stay Department of medical staff 0.932 0.082 0.215 0.892
Treatment-related communication 0.872 0.467 0.034 0.929
Treatment-related support services 0.836 0.542 0.355 0.457
Hotel services 0.814 0.094 0.877 0.460
Hospital environment 0.952 0.410 0.056 0.457
Management-related issues 0.400 0.162 0.168 0.992
Total score 0.713 0.157 0.224 0.939
Table 5 shows both point estimates by percentage (Mean±standard deviation) and interval estimates (95% CI) for mean satisfaction scores, recorded as percentages of the maximum possible. Mean scores ranged from 23.1% to 69.7%; the 95% CI ranged from 25.7% to 72.1%, respectively. The highest satisfaction was with the hospital’s handling of management-related issues (69.7%±27.19%); patients were least satisfied with treatment-related support services (23.1%±13.37%).
A visual assessment of all 15 possible pairwise comparisons of subscale means, satisfaction scores, and 95% CIs is shown in (Figure 2). The circle in each interval shows the mean score for that subscale. Patients were most satisfied with communication, management, and staff deportment; they were least satisfied with treatment-related support services.
Support Staff
Management Hotel
Environment Communication 80
70
60
50
40
30
20
Satisfaction Domain
S
a
ti
sf
a
ct
io
n
s
co
re
Interval Plot of Satisfaction score
95% CI for the Mean
Table 7: Pairwise multiple comparisons (treatment-related communication).
Education level vs. education level P value
None vs. primary 0.252
None vs. secondary 0.622
None vs. tertiary 0.734
Primary vs. secondary 0.658
Primary vs. tertiary 0.003
Secondary vs. tertiary 0.021
Table 6 gives p values for test of equality of mean satisfaction scores among sex, age group, education level, length of stay, and domain.
Statistically significant differences were found for education level only in treatment-related communication. Specifically, this was only between patients with primary and tertiary education (p=0.003); and between patients with secondary and tertiary education (p=0.021) (Table 7).
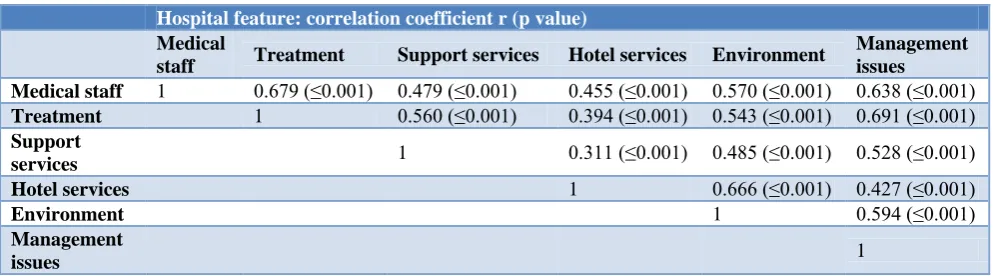
Table 8: Bivariate correlations among satisfaction subscale item scores.
Hospital feature: correlation coefficient r (p value)
Medical
staff Treatment Support services Hotel services Environment
Management issues
Medical staff 1 0.679 (≤0.001) 0.479 (≤0.001) 0.455 (≤0.001) 0.570 (≤0.001) 0.638 (≤0.001)
Treatment 1 0.560 (≤0.001) 0.394 (≤0.001) 0.543 (≤0.001) 0.691 (≤0.001)
Support
services 1 0.311 (≤0.001) 0.485 (≤0.001) 0.528 (≤0.001) Hotel services 1 0.666 (≤0.001) 0.427 (≤0.001)
Environment 1 0.594 (≤0.001)
Management
issues 1
Correlations
Table 8 shows all 15 possible bivariate correlations among the six satisfaction domains. All possible pairs are positively correlated (p<0.005), with the strongest between treatment-related communication and management issues (r=0.691; p≤0.001) and the weakest between support and hotel services (r=0.311; p≤0.001).
Based on Spearman’s correlation coefficients, education level (p=0.003) was the only variable that correlated; that negative correlation (r=–0.20) is shown in (Table 9).
Table 9: Correlations (Spearman’s) with satisfaction score.
Demographic variable Correlation P value
Age 0.07 0.315
Sex –0.05 0.493
Length of stay –0.12 0.071
Level of education –0.20 0.003
Prediction
Level of education was the only demographic variable that correlated with satisfaction; it was also the only variable identified to be a predictor of satisfaction using multivariate linear regression analysis; after which simple linear regression was used to obtain the reduced model. Satisfaction decreased with increasing education. The simple linear regression model is
and the prediction equation was
̂
where ̂ the satisfaction score and x=the level of education.This was a reduced model.
DISCUSSION
Most patients were first admissions from the medical and surgical wards, and admitted for between 3 and 7 days (63.9%). Though patients were generally satisfied (n=164; 71.9%), they were still deeply dissatisfied with hotel services (47.3%) and treatment-related support services (23.1%). The mean percentage of satisfied patients varied in different domains, with the highest for management-related issues (69.7%), treatment-related communication (67.1%), and deportment of staff (65.8%), followed by hospital environment (53.9%). Management issues rated better than the findings of a previous similar study of 2008 (waiting time to see a doctor (15.9%), waiting time before receiving treatment was 26.2%).28 Another study reported similar findings for certain management issues, with 29.6% of patients satisfied with waiting time.29
satisfaction with deportment of medical staff (65.8%) was similar in 2008 (about 70–80%).28 Ahmed et al. reported satisfaction with helpfulness of nurses to be 40.3%(30); and of physicians, ancillary staff, administrative staff, and nursing staff to be 77.8%, 71.7%, 70.2%, and 65.7% respectively.30,31 Treatment-related support services were poor, at 23.1%, but still better than in 2008 (16.6% for adequacy of support services and 18.5% for availability of ongoing services).28 Another study from a developing country reported higher percentage of satisfied patients (73.6%) in support services (laboratory and radiology services).31 Our study revealed hotel services had a higher percent of dissatisfied customers than satisfied customers, with a mean of 47.3%, compared to 26.1% in 2008.28 A study in India reported a higher percentage of satisfied patients (availability of toilet facilities (57.0%), toilet maintenance (38.0%), cleanliness of wards (60.0%), and quality of food (88.8%)).32 The improved hotel services may reflect the better facilities of the new teaching hospital. The percentage of patients satisfied with the hospital environment varied markedly (28.7% for parking, 43.0% for adequate seating, 44.3% for washrooms, and 43.3% for canteen). The mean percentage of satisfied patients was 53.9%. A good hospital environment promotes healing and clinical outcomes, enhances patient safety and satisfaction, and even decreases costs.33 It also improves patients’ perceptions of their overall hospital stay34 and encourages physical and psychological support for patients.35
Associations and predictors
We found a strong correlation between the following indicators: deportment of medical staff, treatment, support services, hotel services, environment, and management services, implying that satisfaction in one indicator depends on satisfaction in others. The strongest
correlation was between treatment-related
communication and management issues (r=0.691; p≤0.001); the weakest was between support services and hotel services (r=0.311; p≤0.001).
There were no significant differences with sex, age, and length of stay in hospital in any of the satisfaction domains. Significant differences were found only with education level and treatment-related communication. This contrasted with the findings of other studies, where socio-economic variables: age, gender, educational level, work status, and marital and perceived health status: affected satisfaction levels.36-38 Unlike our study, an association between perceived health status and patient satisfaction was reported by Xiao et al.36 and Rahmqvist et al,who found that those with a high perceived health status had a greater probability of reporting higher patient satisfaction levels.39
Education was the only predictor of patient satisfaction in treatment-related services. For each of these two statistically significant differences, patients with tertiary education were less satisfied than patients with primary
or secondary education. This is consistent with the findings of Kelarijani et al, who observed high patient satisfaction levels in the illiterate group of their study; those who had Master’s and PhD degree showed less satisfaction.40
Limitations
This study was limited in its design, with patients recruited through convenience sampling. Random sampling would have been more robust. There may have been recall bias: some patients may have over- or underrated their satisfaction. Self-reporting, inadequate knowledge, and fear of identification and victimization further add to potential bias. The descriptive analysis did not cater for confounding variables such as income, personality type, or staffing arrangements. Further, subgroup analyses were not possible because of inadequate sub-sample sizes. Nonetheless, this cross-sectional study reflects patients’ satisfaction with the health service’s performance.
CONCLUSION
Significant differences in satisfaction levels exist in nearly all domains. Big gaps continue to exist, especially in hotel and treatment-related support services. The improvement in satisfied patients from a previous 2008 study may have resulted from the addition of the teaching wing. Patients’ educational level was the only associated factor and predictor of satisfaction, confined to treatment-related services. Evaluating customer satisfaction is a major tool for improving health care. Health care providers must constantly measure and monitor to manage performance gaps. Improving customer satisfaction gaps requires a multipronged approach to address different domains.
ACKNOWLEDGEMENTS
We would like to thank the university students who assisted in data collection and the staff and patients of the San Fernando General Hospital for their co-operation.
Funding: No funding sources Conflict of interest: None declared
Ethical approval: The study was approved by the Institutional Ethics Committee
REFERENCES
1. Health Boards Executive. Measurement of patient satisfaction guidelines: Health strategy implementation project 2003. [Internet]. Clonminch: Health Boards Executive. 2003, 1573. Available at: https://www.lenus.ie/handle/10147/43559. Accessed 13 August 2018.
3. Grimes F. The measurement of patient satisfaction with acute services in Ireland: Irish patient satisfaction literature review and scoping exercise. Health Services National Partnership Forum. 2003. Available at: https://www.lenus.ie/bitstream/handle /10147/43467/3418.pdf?sequence=1&isAllowed=y. Accessed 13 August 2018.
4. Al-Abri R, Al-Balushi A. Patient satisfaction survey as a tool towards quality improvement. Oman Med J. 2014;29(1):3–7.
5. O’Connor SJ, Shewchuk RM, Carney LW. The great gap: Physicians’ perceptions of patient service quality expectations fall short of reality. J Health Care Mark. 1994;14:32–9.
6. Pomey MP, Hihat H, Khalifa M, Lebel P, Néron A. Patient partnership in quality improvement of healthcare services: Patients’ inputs and challenges faced. Patient Experience Journal. 2015;2(1). Available at: http://pxjournal.org/cgi/viewcontent .cgi?article=1064&context=journal;Patient.
Accessed 10 July 2018.
7. Campbell J. Exemplary practices for measuring consumer satisfaction: a review of the literature. (Unpublished report for the Center for Mental Health Services), Rockville, MD; 1999.
8. Aiken LH, Sermeus W, Van Den Heede K, Sloane DM, Busse R, McKee M, et al. Patient safety, satisfaction, and quality of hospital care: Cross sectional surveys of nurses and patients in 12 countries in Europe and the United States. BMJ. 2012;344:e1717.
9. Fakhoury W, McCarthy M, Addington-Hall J. Determinants of informal caregivers’ satisfaction with services for dying cancer patients. Soc Sci Med. 1996;42:721–31.
10. JCAHO Joint Commission on the Accreditation of Healthcare Organisations, 1994 Manual for the Accreditation of Hospitals, Illinois, Oak Brooks; 1993.
11. Donabedian A. The Definition of Quality and Approaches to its Assessment. Ann Arbor, MI: Health Administration Press; 1980.
12. García-Lacalle J, Bachiller P. Dissecting hospital quality. Antecedents of clinical and perceived quality in hospitals. Int J Health Plan Manage. 2011;26(3):264–81.
13. Kavitha R. A comparative study on patients’ satisfaction in health care service. European Journal of Business and Management. 2012;4(13).
14. Burroughs TE, Waterman BM, Cira JC, Desikan R, Claiborne Dunagan W. Patient satisfaction measurement strategies: A comparison of phone and mail methods. Jt Comm J Qual Improv. 2001;27:349–61.
15. Strauss AL, Corbin JM. Basics of Qualitative Research: Techniques and Procedures for Developing Grounded Theory. Thousand Oaks CA: Sage Publications Inc.; 1998.
16. Péfoyo AJK, Wodchis WP. Organizational performance impacting patient satisfaction in
Ontario hospitals: a multilevel analysis. BMC Research Notes. 2013;6:509.
17. Joseph C, Nichols S. Patient satisfaction and quality of life among persons attending chronic disease clinics in South Trinidad, West Indies. WIMJ. 2007;56:108–14.
18. World Health Organization. People-Centred Health Care: A Policy Framework. [Internet]. 2007. Available at: http://www.wpro.who.int/health_ services/people_at_the_centre_of_care/documents/E NG-PCIPolicyFramework.pdf. Accessed 7 August 2018.
19. Rubio DJ. The impact of decentralization of health services on health outcomes: evidence from Canada. Applied Economics. 2010;43(26):3907–17.
20. ‘Healthcare Crisis’. Newsday. August 7, 1999. 21. Wilson S. Begging for a bed. Trinidad and Tobago
Guardian Newspaper. March 25, 2011. Available at: http://www.guardian.co.tt/news/2011/03/24/begging -bed. Accessed 13 August 2018.
22. Clyne K. Shortage of medical supplies at SWRHA. Trinidad and Tobago Guardian Newspaper.
September 3, 2015. Available at:
http://www.guardian.co.tt/news/2015-09-03/shortage- medical-supplies-swrha. Accessed 20 June 2018.
23. Hospitals at crisis point. Trinidad and Tobago Guardian Newspaper. July 17, 2016. Available at: http://www.guardian.co.tt/news/2016-07-17/hospi tals-crisis-point. Accessed 20 June 2018.
24. No medicine for cancer patients. Trinidad and Tobago Guardian Newspaper. April 27, 2017. Available at: http://www.guardian.co.tt/news/2017-04-28/no-medicine-cancer-patients. Accessed 20 June 2018.
25. 1,200 waiting for CT, MRI scans. Trinidad and Tobago Guardian Newspaper. June 15, 2017. Available at: http://www.guardian.co.tt/news/2017-06-16/1200-waiting-ct-mri-scans. Accessed 20 June 2018.
26. Dowlat R. Nursing shortage worries TTRNA. Trinidad and Tobago Guardian Newspaper. October 21, 2017. Available at: http://www.guardian. co.tt/news/2017-10-20/nursing-shortage-worries-ttrna. Accessed 20 June 2018.
27. Çiçek A, Erkan O. Research and Sampling Methods in Agricultural Economics, GOPÜ. Ziraat Fakültesi Yayınları. No:12, Ders Kitapları Serisi, No:6, Tokat; 1996.
28. Bahall M. An evaluation of the effectiveness of the decentralized health system in Trinidad and Tobago. The University of the West Indies. 2010. Available at: http://hdl.handle.net/2139/14478. Accessed 6 July 2018.
30. Ahmed T, Assefa N, Demisie A, Kenay A. Levels of adult patients’ satisfaction with nursing care in selected public hospitals in Ethiopia. Int J Health Sci (Qassim). 2014;8(4):371–9.
31. Makarem J, Larijani B, Joodaki K, Ghaderi S, Nayeri F, Mohammadpoor M. Patients’ satisfaction with inpatient services provided in hospitals affiliated to Tehran University of Medical Sciences, Iran, during 2011–2013. J Med Ethics Hist Med. 2016;9:6.
32. Singh S, Kaur P, Rochwani R. Patient satisfaction levels in a tertiary care medical college hospital in Punjab, North India. Int J Res Dev Health. 2013;1(4):172–82.
33. Christoglou K, Vassiliadis C, Sigalas I. Using SERVQUAL and Kano research techniques in a patient service quality survey. World Hosp Health Serv. 2006;42(2):21–6.
34. Designing for quality: hospitals look to the built environment to provide better patient care outcomes. Qual Lett Healthc Lead. 2003;15(4):2– 13.
35. Kline TJ, Baylis BW, Chatur F, Morrison SA, White DE, Flin RH, et al. Patient satisfaction: evaluating the success of hospital ward redesign. J Health Qual. 2007;29:44-9.
36. Xiao H, Barber JP. The effect of perceived health status on patient satisfaction. Value Health. 2008;11(4):719–25.
37. Jaipaul CK, Rosenthal GE. Are older patients more satisfied with hospital care than younger patients? J Gen Intern Med. 2003;18(1):23–30.
38. Quintana JM, González N, Bilbao A, Aizpuru F, Escobar A, Esteban C. Predictors of patient satisfaction with hospital health care. BMC Health Serv Res. 2006;6:102.
39. Rahmqvist M, Bara AC. Patient characteristics and quality dimensions related to patient satisfaction. Int J Qual Health Care. 2010;22(2):86–92.
40. Kelarijani SEJ, Jamshidi R, Heidarian AR, Khorshidi M. Evaluation of factors influencing patient satisfaction in social security hospitals in Mazandaran province, North of Iran. Caspian J Intern Med. 2014;5(4):232-4.