EVALUATION OF THE ROLE OF SOIL ON BREEDING, SPAWNING AND HATCHING OF
FISH THROUGH SEM
Ghorai
1
Department of Zoology, Vidyasagar University, Midnapore, West Bengal, India
2
Department of Biotechnology, Govt. of India and Ex
Bengal University of Animal & Fishe
A R T I C L E I N F O
INTRODUCTION
A field survey to understand the present status of breeding practice in Bundh in captivity, it was revealed that the soil, collected from particular layer of the area, profusely influence the overall breeding phenomena of fishes. The soils
stimulate breeding but significantly enhance fertilization and hatching rate of carps. To understand the mineral composition of that particular soil and in an effort to identify the role of specific element on different aspects of breeding, SEM analysis of the said soil (soil from different layer) were conducted.
Back scattered electron images in the SEM display compositional contrast that results from different atomic number elements and their distribution. Energy Dispersive Spectroscopy (EDS) allows one to identify what those particular elements are and their relative proportions (Atomic % for example). Initial EDS analysis usually involves the generation of an X-ray spectrum from the entire scan area of the SEM.
Below is a secondary electron image of polished three soil sample [IS1(a,b,c), IS2(a,b,c) & IS3(a,b,c)] and the corresponding X-ray spectra that was generated from the entire scan area.
International Journal of Current Advanced Research
ISSN: O: 2319-6475, ISSN: P: 2319-6505,
Available Online at www.journalijcar.org
Volume 8; Issue 07 (A); July 2019; Page No.
DOI: http://dx.doi.org/10.24327/ijcar.2019
Copyright©2019 Ghorai P.P and Chattopadhyay N.R
which permits unrestricted use, distribution, and reproduction in any medium, provided the original work is properly cited.
Article History:
Received 4th April, 2019
Received in revised form 25th May, 2019 Accepted 18th June, 2019
Published online 28th July, 2019
Key words:
Bottom soil, bundh breeding, spawning, hatching, SEM - EDX
*Corresponding author: Ghorai P.P
Department of Zoology, Vidyasagar Universit West Bengal, India
EVALUATION OF THE ROLE OF SOIL ON BREEDING, SPAWNING AND HATCHING OF
FISH THROUGH SEM – EDX ANALYSIS
Ghorai P.P
1and Chattopadhyay N.R
2Department of Zoology, Vidyasagar University, Midnapore, West Bengal, India
of Biotechnology, Govt. of India and Ex – Professor & Dean, Faculty of Fishery Sciences, West
Bengal University of Animal & Fishery Sciences, West Bengal, India
A B S T R A C T
Bottom soil plays a significant role in determining productivity of fish ponds as well as breeding, spawning and hatching of fish egg. This is evident from a field study in the bundh breeding areas of Bankura district of West Bengal, India where fish breeders, during breeding of carps in bundhs, were being practicing to apply a specific soil both in breeding and hatching bundhs. Farmers mix this particular soil with the water of breeding bundh before releasing of brood fish & in hatching bundh they mix it before releasing fertilized eggs into the hatching pit. In many occasions farmers place these soils in front of inlet drain so that inflowing water automatically carry it into respective pond and mix with the water. As reported this soil acts as a catalyst for overall reproductive performance of fish and stimulates not only breeding but also enhances spawning and hatching in carps. To understand the actual chemical changes and mineral or nutrient present in the soil this study was conducted through SEM EDX analysis.
A field survey to understand the present status of breeding practice in Bundh in captivity, it was revealed that the soil, collected from particular layer of the area, profusely influence the overall breeding phenomena of fishes. The soils not only stimulate breeding but significantly enhance fertilization and hatching rate of carps. To understand the mineral composition of that particular soil and in an effort to identify the role of specific element on different aspects of breeding, SEM- EDS analysis of the said soil (soil from different layer) were
Back scattered electron images in the SEM display compositional contrast that results from different atomic number elements and their distribution. Energy Dispersive copy (EDS) allows one to identify what those particular elements are and their relative proportions (Atomic % for example). Initial EDS analysis usually involves the ray spectrum from the entire scan area of
secondary electron image of polished three soil sample [IS1(a,b,c), IS2(a,b,c) & IS3(a,b,c)] and the ray spectra that was generated from the entire
The Y-axis shows the counts (number of X processed by the detector) and the X
level of those counts. The EDS software we have, “Noran System Six” (NSS), is quite good at associat
level of the X-rays with the elements and shell levels that generated them.
SEM EDX analysis of soil
Scanning electron microscopy has been largely used to observe natural soil aggregates [fig.1, 5 & 9] and also analyze inorganic soil components and their associates. This technique was used in a study of the fractal
well as associations of aluminum particles and the mixture of
materials ( Table. 1- 9). Soil is a complex mixture of chemicals and organisms some of which are usually organized at the nano level. The definition of nano
from the initial discoveries of the capacity to mo atoms singularly to something much larger.
to understand soil structures using techniques developed for nanotechnology such as scanning electronic microsco atomic force microscopy [10, 11, 12, and 13],
diffraction, X- ray fluorescence etc. Thus, main goal of this investigation was to characterize soil in its natural
To understand the actual chemical changes and mineral or nutrient present in the soil a study was conducted for SEM EDX analysis. For SEM EDX analysis of soil was collected from various layer of ground soil of Panchmura of Bankura
International Journal of Current Advanced Research
6505, Impact Factor: 6.614
www.journalijcar.org
; Page No.19395-19401
//dx.doi.org/10.24327/ijcar.2019.19401.3740
Ghorai P.P and Chattopadhyay N.R. This is an open access article distributed under the Creative Commons Attribution License, which permits unrestricted use, distribution, and reproduction in any medium, provided the original work is properly cited.
Department of Zoology, Vidyasagar University, Midnapore,
EVALUATION OF THE ROLE OF SOIL ON BREEDING, SPAWNING AND HATCHING OF
Department of Zoology, Vidyasagar University, Midnapore, West Bengal, India
Professor & Dean, Faculty of Fishery Sciences, West
India
Bottom soil plays a significant role in determining productivity of fish ponds as well as breeding, spawning and hatching of fish egg. This is evident from a field study in the bundh t Bengal, India where fish breeders, during breeding of carps in bundhs, were being practicing to apply a specific soil both in breeding and hatching bundhs. Farmers mix this particular soil with the water of breeding bundh in hatching bundh they mix it before releasing fertilized eggs into the hatching pit. In many occasions farmers place these soils in front of inlet drain so that inflowing water automatically carry it into respective pond and mix with the water. ed this soil acts as a catalyst for overall reproductive performance of fish and stimulates not only breeding but also enhances spawning and hatching in carps. To understand the actual chemical changes and mineral or nutrient present in the soil this study
axis shows the counts (number of X- rays received and processed by the detector) and the X-axis shows the energy level of those counts. The EDS software we have, “Noran System Six” (NSS), is quite good at associating the energy rays with the elements and shell levels that
Scanning electron microscopy has been largely used to observe natural soil aggregates [fig.1, 5 & 9] and also analyze ponents and their associates. This technique fractal dimension of clay minerals as well as associations of aluminum-iron species with silica clay minerals with inorganic 9). Soil is a complex mixture of chemicals and organisms some of which are usually organized at the nano level. The definition of nano- technology has expanded from the initial discoveries of the capacity to move and locate atoms singularly to something much larger. Now, it is possible to understand soil structures using techniques developed for nanotechnology such as scanning electronic microscopy, [10, 11, 12, and 13], X-ray ray fluorescence etc. Thus, main goal of this investigation was to characterize soil in its natural state.
To understand the actual chemical changes and mineral or nutrient present in the soil a study was conducted for SEM EDX analysis. For SEM EDX analysis of soil was collected from various layer of ground soil of Panchmura of Bankura
Research Article
district. Then the collected soil sample was analyzed at Central Research Facility of IIT Kharagpur (SEM EDX) in JEOL JSM5800 Scanning Electron Microscope with Oxford EDS Detector. The microscope has tungsten hairpin filament and a maximum acceleration voltage of 30 kV. In the ba
such an interesting observation we have tried to identify the mineral component of the regional soil, are being used by the fish breeders during bundh breeding since its inception. To find out the role of particular mineral component of said soi we have made an electron microscopic analysis of the soil sample from ground level, from 8 feet & 12 feet below. The collected soil sample were labeled as 1S1 for soil collected from 8 feet below the ground level (1S1a, 1S1b & 1S1c were the spectrum analysis), 1S2 for soil sample collected 12 feet below the ground level (1S2a, 1S2b & 1S2c were the spectrum analysis) & 1S3 for soil sample collected from the ground level (1S3a, 1S3b & 1S3c were the spectrum
soils were collected from Panchmura of Bankura district a unique place of fish breeding in West Bengal.
Standard used for SEM EDX analysis
Spectrum processing: No peaks omitted, Processing option: All elements analyzed (Normalised) Number of iterations = 5
C CaCO3 1 Jun 1999 12:00 AM
O SiO2 1 Jun 1999 12:00 AM Na Albite 1 Jun 1999 12:00 AM Mg MgO 1 Jun 1999 12:00 AM Al Al2O3 1 Jun 1999 12:00 AM Si SiO2 1 Jun 1999 12:00 AM P GaP 1 Jun 1999 12:00 AM Cl KCl 1 Jun 1999 12:00 AM K MAD 10 Feldspar 1 Jun 1999 12:00 AM Ca Wollastonite 1 Jun 1999 12:00 AM Ti Ti 1 Jun 1999 12:00 AM Cr Cr 1 Jun 1999 12:00 AM Fe Fe 1 Jun 1999 12:00 AM Cu Cu 1 Jun 1999 12:00 AM Zn Zn 1 Jun 1999 12:00 AM Br KBr 1 Jun 1999 12:00 AM Mo Mo 1 Jun 1999 12:00 AM Cd Cd 1 Jun 1999 12:00 AM
Soil Sample 1S1 (Special soil yellowish in colour)
ted soil sample was analyzed at Central Research Facility of IIT Kharagpur (SEM EDX) in JEOL JSM5800 Scanning Electron Microscope with Oxford EDS Detector. The microscope has tungsten hairpin filament and a In the back drop of such an interesting observation we have tried to identify the mineral component of the regional soil, are being used by the fish breeders during bundh breeding since its inception. To lar mineral component of said soil we have made an electron microscopic analysis of the soil sample from ground level, from 8 feet & 12 feet below. The collected soil sample were labeled as 1S1 for soil collected from 8 feet below the ground level (1S1a, 1S1b & 1S1c were ysis), 1S2 for soil sample collected 12 feet below the ground level (1S2a, 1S2b & 1S2c were the spectrum analysis) & 1S3 for soil sample collected from the ground level (1S3a, 1S3b & 1S3c were the spectrum analysis). All of Bankura district a unique place of fish breeding in West Bengal.
Spectrum processing: No peaks omitted, Processing option: Number of iterations = 5
12:00 AM
12:00 AM 12:00 AM 12:00 AM 12:00 AM 12:00 AM 12:00 AM 12:00 AM 12:00 AM 12:00 AM 12:00 AM 12:00 AM 12:00 AM 12:00 AM 12:00 AM 12:00 AM 12:00 AM 12:00 AM
Soil Sample 1S1 (Special soil yellowish in colour)
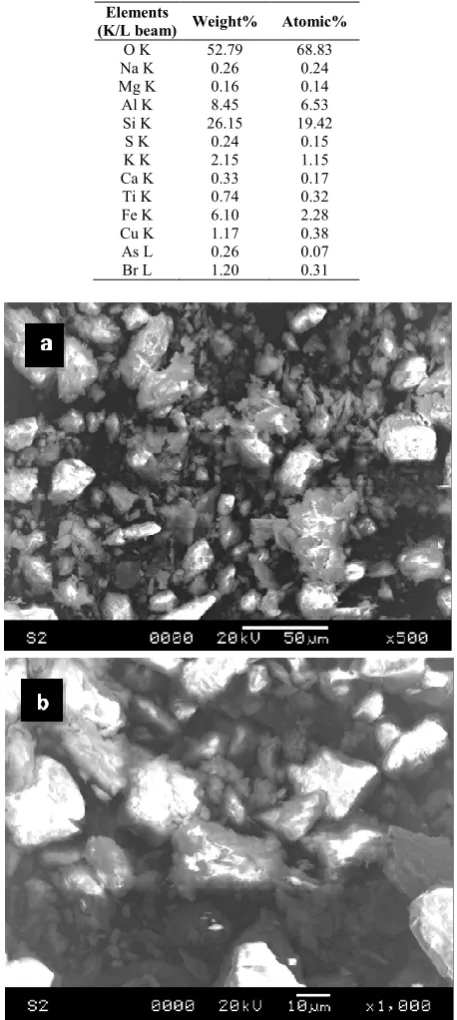
Fig. 1 SEM image of soil sample 1S1 under different magnification a
and b) 1000X (Special soil yellowish in colour, collected 8 feet from ground level of Panchmura of
Fig 2 EDX spectrum of soil sample 1S1a
Table 1 SEM-EDX Elemental analysis of Soil 1S1a
Elements
(K/L beam) Weight%
C K 10.86 O K 50.40 Mg K 0.25
Al K 7.70 Si K 23.65
P K 0.05 Cl K 0.11 K K 1.56 Ca K 0.05 Mn K 0.04 Fe K 4.98 Ni K 0.26 Mo L 0.07 Totals 100.00
0 10 20 30 40 50 60
C O Mg Al Si P
SEM image of soil sample 1S1 under different magnification a) 500X Special soil yellowish in colour, collected 8 feet from ground
level of Panchmura of Bankura district)
EDX spectrum of soil sample 1S1a
Elemental analysis of Soil sample 1S1a
Weight% Atomic%
10.86 16.96 50.40 59.06 0.25 0.20 7.70 5.35 23.65 15.79
0.05 0.03 0.11 0.06 1.56 0.75 0.05 0.03 0.04 0.01 4.98 1.67 0.26 0.08 0.07 0.01 100.00
Cl K Ca Mn Fe Ni Mo
International Journal of Current Advanced Research Vol 8, Issue 07(A), pp 19395-19401, July 2019
Fig 3 EDX spectrum of soil sample 1S1b
Fig 4 EDX spectrum Of soil 1S1c
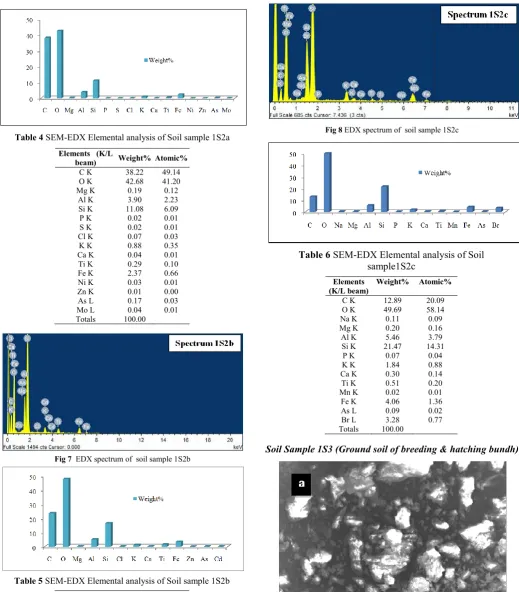
Fig 5 SEM image of soil sample 1S2 a) 500 X and b) 1000 X (Special soil
whitish in colour, collected 12 feet from ground level of Panchmura of Bankura District.)
Fig 6 EDX spectrum of soil sample 1S2a
Table 2 SEM-EDX Elemental analysis of Soil sample 1S1b
Elements (K/L beam)
Weight% Atomic%
C K 38.91 50.41 O K 41.36 40.22 Mg K 0.15 0.09
Al K 3.34 1.93 Si K 9.91 5.49 S K 0.05 0.03 Cl K 0.05 0.02 K K 0.71 0.28 Ca K 0.04 0.02 Ti K 0.41 0.13 Mn K 0.00 0.00 Fe K 4.76 1.33 Zn K 0.10 0.02 Mo L 0.05 0.01 Cd L 0.16 0.02 Totals 100.00
Table 3 SEM-EDX Elemental Analysis of Soil sample 1S1c
Elements
(K/L beam) Weight% Atomic%
Fig 7 EDX spectrum of soil sample 1S2b
Fig 8 EDX spectrum of soil sample 1S2c
Soil Sample 1S3 (Ground soil of breeding & hatching bundh)
Table 4 SEM-EDX Elemental analysis of Soil sample 1S2a
Elements (K/L
beam) Weight% Atomic%
C K 38.22 49.14 O K 42.68 41.20 Mg K 0.19 0.12
Al K 3.90 2.23 Si K 11.08 6.09 P K 0.02 0.01 S K 0.02 0.01 Cl K 0.07 0.03 K K 0.88 0.35 Ca K 0.04 0.01 Ti K 0.29 0.10 Fe K 2.37 0.66 Ni K 0.03 0.01 Zn K 0.01 0.00 As L 0.17 0.03 Mo L 0.04 0.01 Totals 100.00
Table 5 SEM-EDX Elemental analysis of Soil sample 1S2b
Elements
(K/L beam) Weight% Atomic%
C K 23.64 33.45
O K 47.92 50.90
Mg K 0.23 0.16
Al K 5.16 3.25
Si K 16.57 10.02
Cl K 0.09 0.04
K K 1.19 0.52
Ca K 0.19 0.08
Ti K 1.46 0.52
Fe K 3.41 1.04
Zn K 0.00 0.00
As L 0.08 0.02
Cd L 0.07 0.01
Totals 100.00
Table 6 SEM-EDX Elemental analysis of Soil sample1S2c
Elements (K/L beam)
Weight% Atomic%
C K 12.89 20.09 O K 49.69 58.14 Na K 0.11 0.09 Mg K 0.20 0.16 Al K 5.46 3.79 Si K 21.47 14.31
International Journal of Current Advanced Research Vol 8, Issue 07(A), pp 19395-19401, July 2019
Fig 9 SEM image of soil sample 1S3 a) 500 X and b) 1000 X
(Ground soil of Panchmura of Bankura District)
Fig 10 EDX spectrum of soil sample 1S3a
Fig 11 EDX spectrum of soil sample 1S3b
Table 7 SEM-EDX Elemental analysis of Soil sample 1S3a
Elements
(K/L beam) Weight% Atomic%
C K 21.03 28.58 O K 47.34 53.03 Mg K 0.43 0.32
Al K 5.98 3.97 Si K 18.08 11.54
P K 0.16 0.09 Cl K 0.29 0.15 K K 1.30 0.60 Ca K 0.09 0.04 Ti K 0.81 0.30 Fe K 3.56 1.14 Ni K 0.15 0.05 Cu K 0.51 0.14 Zn K 0.01 0.00 As L 0.25 0.06 Totals 100.00
Table 8 SEM-EDX Elemental analysis of Soil sample 1S3b
Elements
(K/L beam) Weight% Atomic%
C K 21.46 30.70 O K 49.07 52.70 Na K 0.09 0.07 Mg K 0.31 0.22 Al K 5.61 3.58 Si K 17.45 10.68
P K 0.08 0.04 K K 1.17 0.51 Ca K 0.38 0.16 Ti K 0.35 0.12 Mn K 0.27 0.08 Fe K 3.19 0.98 Ni K 0.16 0.05 Cu K 0.40 0.11 Totals 100.00
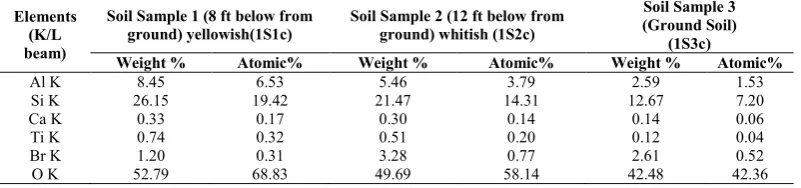
Out of the said SEM-EDX analysis the amount of silicate was higher in terms of weight percentage in the soil (1S1) collected 8 feet below the ground than 1S2 & 1S3. Titanium also found to be present in higher in the sample 1S1.
RESULTS AND DISCUSSION
In three cases the amount of silicate was more (26.15 weight % and 19.42 atomic %) in the soil sample collected 8 feet below the ground, (21.47 weight % & 14.31 atomic %) in the soil sample 12feet below the ground level , while the ground soil possess silicate mineral ion in the range of 12.67 weight % &
7.20 atomic %. As regards the other minerals aluminum, calcium, titanium & bromide was found to be more than that of the standard soil.
The experimental data, as envisaged by some worker (Chattopadhyay, 2017), indicate a highly positive significant role of the soil under study, in enhancing the fertilization and hatching rate of eggs of Carps. One way ANOVAs test of the experimental data indicate highly significant value in respect of fertilization and hatching (P=0.003219). Results of percentage wise elemental composition indicate oxygen was highest (52.79% in S1; 49.69% in S2; 42.48 in S3), followed by carbon ( 38.91 in S1, 38.22in S2 & 35.34 in S3) silicon (26.15% in S1; 21.47% in S2, 12.67% in S3), iron (15.21%), aluminium (8.45 in S1, 5.46 in S2 & 2.59 in S3) potassium (4.60%) and titanium (2.05%) (Table. 10 & 11). The soil was completely devoid of chloride with negligible amount (0.04 in S1& S2 and 0.14 in S3) of calcium.
One of the major elemental compositions of the soil under consideration is the presence of silicon in the form of silicon dioxide (SiO2).
Besides acting as an abiotic component, it also influences the behavior, breeding and spawning of psamophilic (sand loving) fishes and also acts as an aquifer by storing a large amount of water. With metallic ion it forms silicate salts like potassium and sodium silicate. In silicate form it not only acts as a ready source of oxygen but turns the water towards alkaline side.
Table 9 SEM-EDX Elemental analysis of Soil sample 1S3c
Elements
(K/L beam) Weight% Atomic%
C K 35.34 46.93 O K 42.48 42.36 Na K 0.01 0.01 Mg K 0.23 0.15 Al K 2.59 1.53 Si K 12.67 7.20 P K 0.04 0.02 Cl K 0.06 0.03 K K 0.87 0.35 Ca K 0.14 0.06 Ti K 0.12 0.04 Cr K 0.06 0.02 Fe K 2.48 0.71 Cu K 0.22 0.05 Zn K 0.05 0.01 Br L 2.61 0.52 Mo L 0.03 0.01 Totals 100.00
Table 10 SEM-EDX analysis of soil collected from different layer of ground Level in Panchmura of Bankura in West Bengal
Soil collected From 8' below ground From12' below ground Ground Soil
Sample No
Elements 1S1a 1S1b 1S1c 1S2a 1S2b 1S2c 1S3a 1S3b 1S3c
C 10.86 38.91 - 38.22 23.64 12.89 21.03 21.46 35.34 O 50.40 41.36 52.79 42.68 47.92 49.69 47.34 49.07 42.48 Mg 0.25 0.15 0.16 0.19 0.23 0.20 0.43 0.31 0.23
Al 7.70 3.34 8.45 3.90 4.16 5.46 5.98 5.61 2.59 Si 23.65 9.91 26.15 11.08 16.57 21.47 18.08 17.45 12.67
P 0.05 0.00 0.00 0.02 0.00 0.07 0.16 0.08 0.04 Cl 0.11 0.05 0.00 0.07 0.09 0.00 0.29 0.00 0.06 K 1.56 0.71 2.15 0.88 1.19 1.84 1.30 1.17 0.87 Ca 0.05 0.04 0.33 0.04 0.19 0.30 0.09 0.38 0.14 Mn 0.04 0.00 0.00 0.00 0.00 0.02 0.00 0.27 0.00 Fe 4.98 4.76 6.10 2.37 3.41 4.06 3.56 3.19 2.48 Ni 0.26 0.00 0.00 0.03 0.00 0.00 0.15 0.16 0.00 Mo 0.07 0.05 0.00 0.04 0.00 0.00 0.00 0.00 0.03 Cr 0.00 0.00 0.00 0.00 0.00 0.00 0.00 0.00 0.06 Br 0.00 0.00 1.20 0.00 0.00 3.28 0.00 0.00 2.61 S 0.00 0.05 0.24 0.02 0.00 0.00 0.00 0.00 0.00 Ti 0.00 0.41 0.74 0.29 0.46 0.51 0.81 0.35 0.12 Zn 0.00 0.10 0.00 0.01 0.00 0.00 0.01 0.00 0.05 Cd 0.00 0.16 0.00 0.00 0.07 0.00 0.00 0.00 0.00 Na 0.00 0.00 0.26 0.00 0.00 0.11 0.00 0.09 0.01 Cu 0.00 0.00 1.17 0.00 0.00 0.00 0.51 0.40 0.22 As 0.00 0.00 0.26 0.17 0.08 0.09 0.25 0.00 0.00
Table 11 Different minerals in soil sample 1 by SEM-EDX analysis which is higher in amount (K – K beam of SEM-EDX)
Elements (K/L beam)
Soil Sample 1 (8 ft below from ground) yellowish(1S1c)
Soil Sample 2 (12 ft below from ground) whitish (1S2c)
Soil Sample 3 (Ground Soil)
(1S3c)
Weight % Atomic% Weight % Atomic% Weight % Atomic%
International Journal of Current Advanced Research Vol 8, Issue 07(A), pp 19395-19401, July 2019
From the experiment and subsequent elemental analysis, we assume that the particular soil, create a favorable breeding, fertilization and hatching environment in aquatic system. Further study is needed to unveil the actual role of constituent element in stimulating the overall breeding behavior of freshwater fishes.
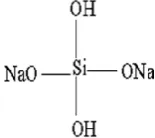
Reports are there which indicates that the oxygen holding capacity of silicon is maximum which is envisaged from the molecular configuration of silicon in soil. Initial tetrad molecular form (fig. 13) indicates its primary properties to bind with four oxygen molecule and it is
Fig 13 Tetrahidral structure of sodium silicate
reported that several such tetrad may combine through molecular chain to form a branch of tetrads. This indicates that the aquatic bottom soil which is rich in silicates, supply more oxygen to aquatic environment and maintain a constant & optimum supply of oxygen at soil - water interface. This study helps in understanding the age old practice of using regional soil by the fish breeders in bundh with the idea that this will enhance fertilization and hatching. Electron microscopic and spectrum analysis definitely indicate the role of silicate not only as oxygen enhancer in fish pond but also stimulates both the male and female fishes in spawning with increase fertilization and hatching.
Besides the de-clogging property of silicates help separating individual egg by dissolving the glue and in the way offers each individual egg to be fertilized by sperm. Otherwise immediately after spawning the eggs, with its contact with water, clogs to each other to form round ball like structure. At this stage only the peripheral eggs are fertilized as tightened glue does not allow the sperm to enter into egg ball or we may say that the sperm are devoid of enzymes which can dissolve the adhesive glue.
After temperature and DO, calcium, present in the experimental soil, also found to be an important water-quality characteristic in catfish hatchery operations. Calcium, a major cation in natural waters, primarily contributes to maintaining osmotic pressure and reducing the hydration of polar organic molecules of the chorion (Maetz 1974). The pioneering work of Tucker and Steeby (1993) led to the practice of supplementing water in catfish hatcheries with 10 mg/L calcium hardness. Ketola et al. (1988) previously determined similar concentrations of calcium to improve eye-up and hatchability of Atlantic salmon Salmo salar, rainbow trout
Onchorhynchus mykiss, and brook trout Salvelinus fortinalis.
Further, Yamamoto (1962) found Ca2 + ions played an important role in the chain reaction of fertilization in fish eggs in terms of stimulation, reception of stimulation, evocation of excitation, and activation of enzyme. The effect of calcium on egg hardening is not properly understood yet but it is known that excessive calcium may decrease the osmotic pressure difference between the environment and the eggs; Ca2 + also reduces the hydration of polar organic molecules by reducing the repulsive forces of the anions and the chorion (Maetz
1974). In a recent study, a reduction in fertility of hybrid catfish eggs incubated at 25 mg/L calcium hardness, although not significant compared with those incubated in waters at higher calcium concentrations, appears to have contributed to a reduced hatch. Further studies are warranted. Recommended calcium hardness for optimal hatching of teleosts for aquaculture is recommended by several authors. On the basis of this study, it is recommended that an in-depth study may unveil several avenues for fish breeding in captivity.
References
1. Chattopadhyay, N.R. (2017) Soil-Induced Increased Fertilization and Hatching of Carps. Appro Poult Dairy & Vet Sci. 1(3). APDV.000512. 2017. DOI: 10.31031/ APDV.2017.01.000512.
2. Chattopadhyay, G.N. (Ed.), Journal of the Indian Society
of Soil Science 17(1): 51-57.
3. Chattopadhyay, N.R., Ghorai, P.P. and De, S.K. (2013) Bundh breeding-rejuvenation of a novel technology for quality seed production by the fish seed producers of Bankura District in West Bengal, India. International
Journal of Current Science. 9: 123-132.
4. Ghorai, P. P., Chattopadhyay, N. R. and De, S. K. (2016) Innovation in bundh breeding unveil a new avenues for quality seed production in captivity. International Journal of Agricultural Extension and Rural Development Studies.
3(1): 37 – 45.
5. Khanna, S.S. (1978) An introduction to fish. Central Book Depot, India, p. 485.
6. Ketola, H. G., D. Longacre, A. Greulich, L. Phetterplace, and R. Lashomb. (1988) High calcium concentration in water increases mortality of salmon and trout eggs. Progressive Fish-Culturist 50:129–135.
7. Maetz, J. (1974) Aspects of adaptation to hypo-osmotic and hyper-osmotic envi-ronment. Pages 1–165 in D. C. Malins and J. R. Sargent, editors. Biochemical and biophysical perspectives in marine biology, volume 1. Academic Press, London.
8. Mandal LN, Chattopadhyay GN (1992) Nutrient management in aquaculture. In: Tandon HLS (Ed.), Non-Traditional Sectors in Fertilizer Use. FDCO, New Delhi, India, pp. 1-17.
9. Mandal, L.N. (1992) Nutrient Management in Aquaculture. In: NR
10. Tucker, C. S., and J. A. Steeby. (1993) A practical calcium hardness criterion for channel catfish hatchery water supplies. Journal of the World Aquaculture Society 24:396–401.
11. Yamamoto, T. (1962) Physiology of fertilization in fish eggs. International Re-view of Cytology 12:361–405. 12. Joseph I. Goldstein, Dale E. Newbury,Patrick Echlin,
David C. Joy Charles E. Lyman. Eric Lifshin, (2013) “Scanning Electron Microscopy and X-Ray Microanalysis”. Springer, Boston, MA. http://www.microscopy.ethz.ch/aed.htm
13. John J. Friel., (2003) “X-ray and Image Analysis in Electron Microscopy”, Princeton Gamma-Tech. 3rd. edition, 98 p.
14. David Williams and Barry Carter. (2009) “Transmission Electron Microscopy: A Textbook for Materials Science”. Springer US. “Casino” Monte Carlo Simulation. http://www.gel.usherbrooke.ca/casino/download2.html