Estimation Of The Fundamental Frequency Of The
Speech signal Compressed By G.729 Algorithm Using
PCC Interpolation
Zoran Milivojevi
ć
*1, Darko Brodi
ć
21Department of Communication, College of Applied Technical Sciences, A. Medvedeva No. 20,Niš, Serbia 2
Department of Informatics, University of Belgrade, Technical Faculty Bor, Vojske Jugoslavije 12, Bor, Serbia 1*Correponding author E-mail:[email protected]
Abstract—This paper gives the estimation of the fundamental frequency (F0) of the speech signal modeled
by the G.729 method. The estimation of the F0was performed by the Peaking-Peaks algorithm with the
implemented Parametric Cubic Convolution (PCC) interpolation. The efficiency of PCC was tested for Keys, Greville and Greville two-parametric kernel. The window that gives optimal results was chosen according to the MSE results. At the end, the comparative analysis of the F0estimation compressed by
G.729 and G.723.1 codec is made.
Keywords- Speech processing; Speech compression; Fundamental frequency; VoIP;
I. INTRODUCTION
ITU-T Telecommunication standardization sector of ITU (International Telecommunication Union) has defined the standard H.324 for specification of components, protocols and procedures which make multimedial communication services in networks with packets communication possible [1]. Besides, H.324 defines audio and video codecs (coders-decoders). G.729 and G.723.1 are audio codecs intensively used in VoIP (Voice over IP) communications [2,3]. G.723.1 provides the speech compression to 5.3 kb/s and 6.3 kb/s. In the first case ACELP (Algebraic Code Excited Linear Prediction) algorithm and in the second MP-MLQ (Multipulse MAximum Likelihood Quantization) algorithm are applied [3,4]. The frame size is 30 ms with 240 samples with sampling of 8 kHz. Each frame is being processed in the following 7.5 ms. The frame is devided into smaller frames whose duration is 7.5 ms. Delaying (67-97 ms), delaying variations, packets losses and echo influence on the quality of speech trasmitted by means of packet network. Evaluation of MOS (Mean Opinion Score) test is acceptable 3.4 (5.3 kbps) and good 3.8 (6.3 kbps) [5]. Recommendation ITU-T Rec. G.729 contains the description of an algorithm for the coding of speech signals at 8 kbit/s using Conjugate-Structure Algebraic-Code-Excited Linear-Prediction (CS-ACELP) [2]. The CS-ACELP coder is based on the Code-Excited Linear-Linear-Prediction (CELP) coding model. The coder operates on speech frames of 10 ms corresponding to 80 samples at a sampling rate of 8 kHz. For every 10 ms frame, the speech signal is analyzed to extract the parameters of the CELP model (linear-prediction filter coefficients, adaptive and fixed-codebook indices and gains). These parameters are encoded and transmitted [6]. At the decoder, these parameters are used to retrieve the excitation and synthesis filter parameters. The speech is reconstructed by filtering this excitation through the short-term synthesis filter. The short-term synthesis filter is based on a 10th order Linear Prediction (LP) filter. The long-term, or pitch synthesis filter is implemented using the so-called adaptive-codebook approach. After computing the reconstructed speech, it is further enhanced by a postfilter. This coder encodes speech and other audio signals with 10 ms frames. In addition, there is a look-ahead of 5 ms, resulting in a total algorithmic delay of 15 ms. Evaluation of MOS test is good 3.84 (6.3 kbps) [7]. With G.723.1 and G.729 coding the F0 estimation is firstly being done, and than the estimated F0 is used in the following steps of the speech signal coding. In the decoding process the speech signal is reconstructed which implies renewal of the F0[8,9].
After the transfer of the speech signal by the VoIP service, on the reception side there is a need for the signal processing (speech and speaker recognition, echo canceling, improvement of the quality and the speech articulateness etc.). The characteristic example is the correction of the speech signal quality by reducing of dissonant frequencies [10,11]. In the speech signal processing there is a need for determination of the F0. A number of algorithms were developed for determination of the F0where the analysis is performed in the time and frequency domain [12-15].
This procedure gives the reconstruction of the spectrum on the base of DFT. The spectrum parameters are then determined by analytic procedures (differentiation, integration, extreme values,...).
Determination of spectral characteristic values between DFT samples is taken as the local convolution of the neighboring DFT samples and interpolation kernel (piece-wise polynomial interpolation) [16-18]. Two methods are frequently used for interpolation: a) the cubic B-spline interpolation [16] and b) the Parametric Cubic Convolution (PCC) interpolation [17]. From the point of view of the fastness of the maximum position estimation the application of PCC interpolation kernel is more suitable, because it is possible to find the maximum position directly (by means of a formula) using the sampled data without convolution being applied. The detailed analysis of the F0 estimation by means of PCC interpolation is described in the paper [19]. The results of the application of PCC interpolation for determining of the F0 in the conditions of application of some window in the processing of the discrete speech signal are presented in [20]. Through some simulation procedures algorithm efficiency analyses have been done where, as a quality measure of an algorithm, the Mean Square Error (MSE) has been used. The best results were shown by the algorithm with the implemented Blackman window. The results of the F0 estimation of the speech signal modeled by SYMPES (Systematic Procedure to Model Speech Signals via Predefined “Envelope and Signature Sequences”) method are shown in [21]. The assessment of theF0 in MP3 codec is given in [22]. Further, in [23] the estimation of the F0 in speech signal compressed by G.729 algorithm is described. In addition, the author in [23] established the formulae for analytical calculation of the F0 without convolution. It is made by multiple speed-up procedure for the estimation of F0.
Further in this paper there will be presented some results of the F0 estimation in audio and speech signals compressed by G.729 algorithm in order to determine the F0 using PCC interpolation kernels (Keys, Greville and two parametric Greville kernel) and some window functions (Hamming, Hanning, Blackman, Rectangular, Kaiser and Triangular window). The estimation of F0 was performed on the base of the analytical expression from [19] for Keys kernel and from [23] for Greville and two-parametric Greville kernels. As a measure of the quality of interpolation algorithm MSE (Mean Square Error) will be applied. On the base of minimum values of MSE optimum kernel parameters and the corresponding window function will be determined. Afterward the comparison of the estimation of F0between G.729 and G.723.1 [23] codecs will be implemented.
This paper is organized as follows: In Section II there is a description of the PCC algorithm. In Section II.A there are definitions of interpolation kernels. In Section II.B the algorithm for determination of optimal kernel parameters is presented. In Section III numerical MSE results in the estimation of F0of the speech signal modeled by the G.729 method are presented. The comparative analysis of the results and the choice of the optimal kernel and window function are shown in Section IV. Section V gives the Conclusion.
II. ALGORITHMOFFUNDAMENTALFREQUENCYESTIMATION
Algorithm for the estimation of F0, based on the algorithm from [19], is shown in Fig. 1. This algorithm is realized in the following steps:
Step 1: Audio or speech signal s(n) is coded by G.729 coder.
Step 2: Coded signal is decoded by G.729 decoder and generises signal x(n). Step 3: Window w(n) whose length is N applies to decoded signal x(n). Step 4: Spectrum X(k) is calculated by using DFT:
X
k DFT
x
n
The spectrum is calculated in discrete points k=0,...,N-1, where N is the length of DFT. The real spectrum of signals x(n) is continuous, whereas DFT defines the values of the spectrum at some discrete points.
Step 5: By using peak picking algorithm, the position of the maximum of the real spectrum that is between k-th and (k+1)-k-th samples is determined, where k-the values X(k) and X(k+1) are k-the highest in k-the specified domain.
Step 6: The position of the maximum of the spectrum is calculated by PCC interpolation. The reconstructed function is:
2
, 11 2
k f k i f r p f
X
L k
L k i
i
r
The quality of the algorithm for the estimation of F0 can be also expressed by MSE:
2e f f
MSE
where f is true F0 and feis the estimation of F0.
Figure 1. Algorithm for the estimation of F0.
A. Interpolation Kernel
Next, we give definitions of the interpolation kernels which are tested in this paper:
a) Keys interpolation kernel [17,18]:
otherwise
,
0
2
f
1
,
4
8
5
,
1
f
,
1
3
2
2 3
2 3
f
f
f
f
f
f
r
For L=4 from Eq. (2) position of maximum is determined:
0
a
,
b
-b
-k
0
a
,
2
2 max
a
ac
b
c
k
f
where:
1 1
2 1
1
2 1
1
3
2
3
2
2
2
2
k k
k k
k k
k k
k k
p
p
c
p
p
p
p
b
p
p
p
p
a
.
f
3
if
0;
,
3
f
2
if
;
9
2
21
4
2
1
,
2
f
1
if
;
2
3
4
2
11
2
5
3
1
2
1
,
1
f
0
if
;
1
2
5
2
3
2 3 2 3 2 3
f
f
f
f
f
f
f
f
f
r
For L=6 from Eqs. (2) and (7) position of maximum is determined according to Eq. (5), where:
2 1 1 2 3 2 1 1 2 3 2 1 1 22
1
2
1
2
1
2
1
;
1
4
5
2
2
3
2
;
2
3
1
2
3
2
3
3
2
3
3
1
2
3
2
3
k k k k k k k k k k k k k k k kp
p
p
p
c
p
p
p
p
p
p
b
p
p
p
p
p
p
a
c) Greville two-parametric cubic convolution kernel (G2P) [16]:
. . 4 ; 24 20 2 11 2 1 , 3 2 ; 30 9 34 2 21 2 25 4 3 2 1 , 2 1 ; 2 6 3 4 10 2 11 2 5 2 9 3 1 2 1 , 1 0 ; 1 2 5 2 5 2 3 2 5 2 3 2 3 2 3 2 3 f f f f f f f f f f f f f f f f r For L=8 from Eqs. (2) and (9) position of maximum is determined according to Eq. (5), where:
3 2 1 1 2 3 4 3 2 1 1 2 3 4 3 2 1 1 2 3 2 1 2 2 1 2 1 2 5 2 1 2 5 2 2 1 2 1 ; 2 1 3 1 10 4 2 5 5 2 2 6 3 7 2 2 ; 2 3 3 2 3 1 2 3 2 3 2 5 3 2 3 2 5 3 1 2 3 3 2 3 2 3 k k k k k k k k k k k k k k k k k k k k k k p p p p p p c p p p p p p p p b p p p p p p p p a In the Eqs. (4)-(10) there areandparameters. The optimal values of these parameters will be determined by the minimal value of MSE, for Keys, Greville and G2P kernel. For the first two of them:
opt
MSE
arg
min
opt opt
MSE
,
min
arg
,
The detailed analysis in [19-23] showed that the minimal value of MSE depends on the application of window by which signal processing x(n) is carried out in time domain. MSE will be defined for: a) Hamming, b) Hanning, c) Blackman, d) Rectangular, e) Kaiser and f) Triangular window.
B. Interpolation Kernel Parameters
Algorithm for determination of interpolation kernel parametersandis realized in the following steps:
Step 1: signal x(n), which was previously coded and decoded by G.729 algorithm, is modified by the window function w(n) whose length is N,
Step 2: spectrum X(k) is determined by the application of DFT,
Step 3: reconstruction of the continual function that represents spectrum X(f) is performed by the application of PCC interpolation,
Step 4: MSE is calculated for various values of parametersanddepending on the implemented window, Step 5:optandopt are determined for which minimal value of MSE is obtained.
C. Test Signals
PCC algorithm of the estimation of F0 will be applied to: i) simulation Sine test signal, and ii) Speech test signal. Simulation Sine signal for testing of PCC algorithm is defined in [19]:
Ki M
g
i s o
i
t
NM
f
g
f
i
a
t
s
1 0
2
sin
where f0is fundamental frequency, iand aiare phase and amplitude of the i-th harmonic, respectively, K is the number of harmonics, M is the number of points between the two samples in spectrum where PCC interpolation is being made. The Speech test signal is obtained by recording of a speaker in the real acoustic ambient. For further comparative analysis by interpolation it is suitable for the F0of the Speech test signal and the one of the Sine test signal to be equal. PCC algorithm will be applied to:
a) uncoded simulation Sine and Speech test signals, and
b) by G.729 algorithm coded and decoded Sine and Speech test signals.
III. EXPERIMENTALRESULTSANDCOMPARISON
A. Testing Parameters
In the simulation process f0andiare random variables with uniform distribution in the range [G2 (97.99 Hz), G5 (783.99 Hz)] and [0,2]. Signal frequency of sampling is fS=8 kHz and the length of window is N=256, which assures the analysis of subsequences that last 32 ms. The results presented further in this paper relate to fO=125-140.625Hz (frequencies between the eighth and ninth DFT components). Number of frequencies in the specified range for which the estimation is done is M=100. The Sine test signal is with K=10 harmonics. All further analyses will relate to a) Hamming, b) Hanning, c) Blackman, d) Rectangular, e) Kaiser and f) Triangular window.
B. Experimental Results 1) Keys Kernel
(a) (b)
(c) (d)
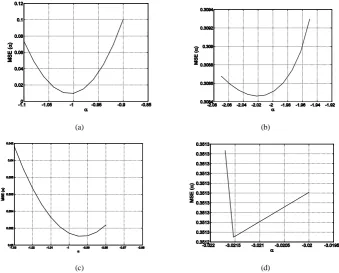
Figure 2. MSE() for Keys kernel and Hamming window: a) uncompressed Sine test signal, b) G.729 compressed Sine test signal, c) uncompressed Speech test signal, d) G.729 compressed Speech test signal
.
TABLE I. MINIMUMMSEANDOPTFORSINE TEST SIGNAL(KEYS KERNEL).
Window Uncoded signal Signal coded by G.723.1 algorithm
Signal coded by G.729 algorithm
opt MSEKmin opt MSEKGmin opt MSEKGmin
Hamming -1 0.0098 -0.875 0.4203 -2.0220 0.3085
Hanning -0.880 0.000619 -0.820 0.4170 -2.0400 0.3341
Blackman -0.800 0.000423 -0.760 0.4137 -1.8286 0.3422
Rectangular -2.680 0.1767 -1.740 0.3855 -3.2000 0.2481
Kaiser -1.140 0.0066 -1 0.3887 -2.1000 0.2963
Triangular -1.010 0.0036 -0.970 0.3982 -2.0000 0.3063
TABLE II. MINIMUMMSEANDOPTFORSPEECH TEST SIGNAL(KEYS KERNEL).
Window Uncoded signal Signal coded by G.723.1 algorithm
Signal coded by G.729 algorithm
opt MSEKSPmin opt MSEKGSPmin opt MSEKGSPmin
Hamming -0.995 0.0310 -1.020 0.9351 -3.0215 0.3513
Hanning -0.880 0.0349 -0.920 1.0523 -2.9950 0.3664
Blackman -0.800 0.0358 -0.840 1.0213 -2.8200 0.3752
Rectangular -2.400 0.4323 -2.100 0.6752 -4.0100 0.3243
Kaiser -1.080 0.0339 -1.150 0.9390 -3 0.3426
Triangular -1.030 0.0277 -1.040 0.9865 -2.8420 0.3385
On the base of the results presented in Tables I - II it is obvious that:
a) at Sine test signal the greatest precision of F0estimation is when Blackman window (MSEKmin=0.000423) is applied. At G.723.1 coded Sine test signal the greatest precision of estimation is in Rectangular (MSEKGmin=0.3855) window. When G.723.1 coding is applied, the precision in F0 estimation is lowered for MSEKGmin/MSEKmin=0.3855/0.00423=91.134 times.
b) at Speech test signal the greatest precision is in Triangular window (MSEKSPmin=0.0277). At G.723.1 coded Speech signal the greatest precision is in Rectangular window (MSEKGSPmin=0.6752). When coding is applied, the precision in F0estimation is lowered for MSEKGSPmin/MSEKSPmin=0.6752/0.0277=24.375 times.
At G.729 coded Speech test signal the greatest precision of estimation is in Rectangular (MSEKGmin=0.3243) window. When G.729 coding is applied, the precision in F0 estimation is lowered for MSEKGmin/MSEKmin= 0.3243/0.0277= 11.707 times.
c) at G.723.1 coded Speech signal in relation to coded Sine signal inaccuracy in F0estimation is greater for MSEKGSPmin/MSEKGmin=0.6752/0.3855=1.751 times.
At G.729 coded Speech signal in relation to coded Sine signal inaccuracy in F0 estimation is greater for MSEKGSPmin/MSEKGmin=0.3243/0.2481=1.307 times.
2) Greville Kernel
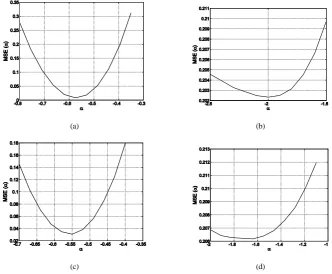
Applying algorithm for determination of Greville interpolation kernel some diagrams MSE() are drawn, minimum value MSEGmindetermined, and on the base of it optimum value of Greville kernel parameters opt determined for: a) Hamming (Fig. 3), b) Hann, c) Blackman, d) Rectangular, e) Kaiser, and f) Triangular window. Values MSEminand opt are presented in Table III (uncoded Sine test signal MSEGmin, coded Sine test signal MSEGGmin) and Table IV (Speech test signal MSEGSPmin, coded Speech test signal MSEGGSPmin). For the comparison, the results of the G.723.1 in Tables III - IV are given as well. These results are obtained under identical circumstances as in [23].
(a) (b)
(c) (d)
Figure 3. MSE() for Greville kernel and Hamming window: a) uncompressed Sine test signal, b) G.729 compressed Sine test signal, c) uncompressed Speech test signal, d) G.729 compressed Speech test signal.
TABLE III. MINIMUMMSEANDOPTFORSINETESTSIGNAL(GREVILLE KERNEL).
Window Uncoded signal Signal coded by G.723.1 algorithm
Signal coded by G.729 algorithm
opt MSEGmin opt MSEGGmin opt MSEGGmin
Hamming -0.560 0.0089 -0.4800 0.3841 -2 0.2023
Hanning -0.450 0.0006573 -0.3900 0.3969 -2.1750 0.2118
Blackman -0.410 0.0002441 -0.3650 0.3938 -1.8100 0.2149
Rectangular -2.300 0.1472 -1.3000 0.3274 -3.1300 0.2062
Kaiser -0.660 0.0059 -0.5400 0.3598 -2.1000 0.1964
Triangular -0.575 0.0007793 -0.5000 0.3659 -2.0250 0.1962
Window Uncoded signal Signal coded by G.723.1 algorithm
Signal coded by G.729 algorithm
opt MSEGSPmin opt MSEGGSPmin opt MSEGGSPmin
Hamming -0.560 0.0310 -0.6400 0.7983 -1.6400 0.2062
Hanning -0.450 0.0363 -0.5300 0.9201 -1.6200 0.2042
Blackman -0.410 0.0344 -0.5100 0.9209 -1.6750 0.2041
Rectangular -2.100 0.2016 -1.7000 0.5178 -2.1000 0.2268
Kaiser -0.660 0.0255 -0.7800 0.7787 -1.9600 0.2080
Triangular -0.575 0.0256 -0.6750 0.8011 -1.7600 0.2071
On the base of the results presented in Tables III - IV it is obvious that:
a) at Sine test signal the greatest precision of F0estimation is when Blackman (MSEGmin=0.0002441) window is applied. At G.723.1 coded Sine test signal the greatest precision of estimation is in Rectangular window (MSEGGmin=0.3274). When coding is applied, the precision of F0 estimation is lowered for MSEGGmin/MSEGmin=0.3274/0.0002441=1341.25 times.
At G.729 coded Sine test signal the greatest precision of estimation is in Triangular window (MSEGGmin=0.1962). When coding is applied, the precision of F0 estimation is lowered for MSEGGmin/MSEGmin=0.1962/0.0002441=803.768 times.
b) at Speech test signal the greatest precision is in Kaiser window (MSEGSPmin=0.0255). At G.723.1 coded Speech signal the greatest precision is in Rectangular window (MSEGGSPmin=0.5178). When G.723.1 coding is applied, the precision of F0estimation is lowered for MSEGGSPmin/ MSEGSPmin=0.5178/0.0255=20.3 times.
At G.729 coded Speech signal the greatest precision is in Blackman window (MSEGGSPmin=0.2041). When G.729 coding is applied, the precision of F0 estimation is lowered for MSEGGSPmin/ MSEGSPmin=0.2041/0.0255=8.003 times.
c) at G.723.1 coded Speech signal in relation to coded Sine signal inaccuracy of the F0 is greater for MSEGGSPmin/MSEGGmin=0.5178/0.3274=1.58 times.
At G.729 coded Speech signal in relation to coded Sine signal inaccuracy of the F0 is greater for MSEGGSPmin/MSEGGmin=0.2041/0.1962=1.04 times.
3) G2P Kernel
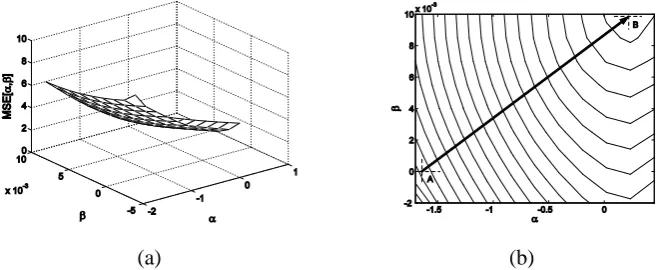
For window (Blackman, Triangular, Kaiser and Blackman) which showed the best results at G.729 coding with Greville kernel, an analysis was performed by means of G2P kernel. Three-dimensional MSE(,) graphics are drawn (Figs. 4.a, 5.a, 6.a, and 7.a), the shift of minimum MSEminin (,) level determined, andoptandoptvalues determined and presented in Table V. Furthermore, it gives the results for the G.723.1 codec from [23]. In Figs 4.b, 5.b, 6.b, and 7.b the positions of MSEmin=MSE(opt,opt) minimum in (,) plane for Greville (point A) and G2P (point B) interpolation kernel, are shown. Vector AB shows the position change of minimum (MSE(opt,opt)).
(a) (b)
(a) (b)
Figure 5. Sine test signal with G.729 compression with the application of Triangular window: a) MSE(α,β) for the application of G2P PCC interpolation, b) Positions of min (MSE(αopt,βopt)) in plane (αβ) for Greville (point A) and G2P PCC (point B) interpolation.
(a) (b)
Figure 6. Speech test signal without compression with the application of Kaiser window: a) MSE(α,β) for G2P PCC interpolation, b) positions of min (MSE(αopt,βopt)) in plane (αβ) for Greville (point A) and G2P PCC (point B) interpolation.
(a)
(b)
Figure 7. Speech test signal with G.729 compression with the application of Blackman window: a) MSE(α,β) for the application of G2P PCC interpolation, b) Positions of min (MSE(αopt,βopt)) in plane (αβ) for Greville (point A) and G2P PCC (point B) interpolation.
TABLE V. MINIMUMMSE,OPTANDOPT(G2PKERNEL).
opt opt MSEG2Pmin
Sine test signal Uncoded signal Blackman win. -0.3650 0.0250 MSEG2Pmin=0.00014
G.723.1 coded Rectang. win. -0.95 0.1838 MSEG2PGmin=0.1750
G.729 coded Triang. win. -2 0.2088 MSEG2PGmin=0.1676
Speech test signal Uncoded signal Kaiser win. -0.5600 0.0425 MSEG2PSPmin=0.0198
G.723.1 coded Rectang. win. -1.08 0.260 MSEG2PGSPmin=0.2898
G.729 coded Blackman. win. 0.2350 0.01 MSEG2PGSPmin=0.1145
a) at Sine test signal the greatest precision of F0estimation (Greville interpolation kernel) is when Blackman (MSEGmin=0.0002441) window is applied. When G2P interpolation (MSEG2Pmin=0.00014) is applied, the precision of F0estimation is increased for MSEGmin/MSEG2Pmin=0. 0002441/0.00014=1.74 times.
b) at G.723.1 coded Sine test signal the greatest precision of estimation (Greville interpolation kernel) is in Rectangular window (MSEGG=0.3274). When G2P interpolation (MSEG2Pmin=0.175) is applied, the precision of F0 estimation is increased for MSEGGmin/MSEG2Pmin=0. 3274/0.175=1.87 times.
c) at G.729 coded Sine test signal the greatest precision of estimation (Greville interpolation kernel) is in Triangular window (MSEGG=0.1962). When G2P interpolation (MSEG2Pmin=0.1676) is applied, the precision of F0 estimation is increased for MSEGGmin/MSEG2Pmin=0. 1962/0.1676=1.17 times.
d) at Speech test signal the greatest precision of the F0estimation (Greville interpolation kernel) is when Kaiser (MSEGSPmin=0.0255) window is applied. When G2P interpolation (MSEG2PSPmin=0.0198) is applied, the precision of F0estimation is increased for MSEGSPmin/ MSEG2PSPmin=0.0255/0. 0198=1.28 times.
e) at G.723.1 coded Speech test signal the greatest precision of estimation (Greville interpolation kernel) is in Rectangular window (MSEGGSPmin=0.5178). When G2P interpolation (MSEG2PSPmin=0.2898) is applied, the precision of F0estimation is increased for MSEGGSPmin/MSEG2PSPmin=0.5178/0.2898=1.78 times.
f) at G.729 coded Speech test signal the greatest precision of estimation (Greville interpolation kernel) is in Blackman window (MSEGGSPmin=0.2041). When G2P interpolation (MSEG2PGSPmin=0.1145) is applied, the precision of F0estimation is increased for MSEGGSPmin/MSEG2PGSPmin=0.2041/0.1145=1.78 times.
g) at G.723.1 coded Speech signal in relation to G.723.1 coded Sine signal, the inaccuracy of F0estimation is greater for MSEG2PGSPmin/MSEG2PGmin=0.2898/0.175=1.656 times.
h) at G.729 coded Speech signal in relation to G.729 coded Sine signal, the inaccuracy of F0 estimation is greater for MSEG2PGSPmin/MSEG2PGmin=0.1676/0.1145=1.463 times.
IV. COMPARATIVEANALYSIS
Comparative precision analysis of the estimated F0of the Sine test signal and the Speech test signal, without and with G.729 compression will be performed on the base of the minimal values of MSE. The minimal value of MSE is determined on the base of a diagram in the Fig. 2 (Keys), Fig. 3 (Greville) and Figs. 4 - 7 (G2P) and presented in the Table I (MSEKmin, MSEKGmin), Table II (MSEKSPmin, MSEKGSPmin), Table III (MSEGmin, MSEGGmin), Table IV (MSEGSPmin, MSEGGSPmin) and Table V (MSEG2Pmin, MSEG2PGmin, MSEG2PSPmin, MSEG2PGSPmin) respectively. Furthermore the comparative analysis of the F0estimation with G.729 and G.723.1 algorithms will be made.
Comparing the values MSEminfrom Tables. I - V it can be concluded that:
a) the optimum choice for Sine test signal (without compression) is Blackman window for all interpolation kernels. G2P interpolation kernel, which generates 66.91% less than Keys and 42.65% less than Greville kernel, showed the best results.
b) the optimum choice for Speech test signal is G2P kernel with Kaiser window, which generates 59.57% less than Keys kernel (Triangular window) and 56.08% less than Greville kernel (Kaiser window).
c) the optimum choice for Sine test signal coded by G.723.1 algorithm is Rectangular window for all interpolation kernels. G2P interpolation kernel, which generates 54.61% less than Keys and 46.55% less than Greville kernel, showed the best results.
d) the optimum choice for Speech test signal coded by G.723.1 algorithm is rectangular window for all interpolation kernels. G2P interpolation kernel, which generates 57.21% less than Keys and 44.04% less than Greville kernel, showed the best results.
e) the optimum choice for Sine test signal coded by G.729 algorithm is G2P interpolation kernel with Triangular window, which generates 32.41% less than Keys (Rectangular window) and 14.57% less than Greville kernel (Triangular window), showed the best results
f) the optimum choice for Speech test signal coded by G.729 algorithm is G2P interpolation kernel with Blackman window, which generates 64.66% less than Keys (Rectangular window) and 43.9% less than Greville kernel (Blackman window), showed the best results.
g) comparing MSE for G2P kernel for uncoded Speech test signal (Kaiser window, MSEG2PSPmin=0.0198), G.723.1 coded Speech signal (Rectangular window, MSEG2PGSPmin=0.2898) and G.729 coded Speech signal (Blackman window, MSEG2PGSPmin=0.1145), in relation to MSEG2PGSPmin/ MSEG2PSPmin=0.2898/0.0198=14.636 and MSEG2PGSPmin/ MSEG2PSPmin=0.1145/0.0198=5.78 has been obtained.
In accordance to the derived conclusion, the application of the algorithm for further processing of G.723.1 coded signal with algorithms based on the estimated F0(automatic verification of a speaker, recognition of the Speech etc.) would not bring satisfactory results [23], while processing of G.729 coded signal causes significantly smaller error. The obtained results recommend using PCC algorithm with G2P kernel in preprocessing signals compressed by G.729 method for further processing by algorithms which require a precise determination of the F0.
V. CONCLUSION
This paper presented the analysis of the F0 estimation results of the Speech signal compressed by G.729 algorithm which has been intensively used in VoIP services. The estimation of the F0has been made by Peaking Peaks algorithm with implemented PCC interpolation. Experiments have been performed with Keys, Greville and Greville two-parametric G2P kernels. In order to minimize MSE some windows have been implemented. The detailed analysis has shown that the optimal choice is Greville two-parametric kernel and the Blackman window implemented in PCC algorithm. In relation to Keys and Greville kernels, Greville two-parametric kernel generates 64.66% and 43.9% less MSE, respectively. Comparing the obtained results to the results of the estimation of the F0 in the Speech signal that is not modeled by G.729 method, a relation of minimal MSEs 5.78 has been obtained. The obtained results recommend using of PCC algorithm with G2P kernel in preprocessing of signals compressed by G.729 method for further processing by algorithms which require a precise determination of the F0 (automatic verification of the speaker, recognition of the speech, etc.).
REFERENCES
[1] ITU-T Rec. H.324, Audiovisual and Multimedia Systems - Terminal for low bit-rate multimedia communication, 2009.
[2] ITU-T Rec. G.729, Coding of Speech at 8 Kbit/s Using Conjugate-Structure Algebraic-Code-Excited Linear-Prediction (CS-ACELP) 1996.
[3] ITU-T Rec. G.723.1, Dual-rate Speech Coder for Multimedia Communications Transmitting at 5.3 and 6.3 kbit/s, 1996.
[4] S. Karapantazis and F. Pavlidiou,“VoIP: A comprehensive survey on a promising technology”, Computer Networks, vol. 53, pp. 2050–2090, 2009.
[5] V. Reguera, F. Paliza, W. Godoy and E. Rernandez,“On the impact of active queue management on VoIP quality of service”, Computer Communications, vol. 31, pp. 73–87, 2008.
[6] Texas Instruments, Implementation of G.729 on the TMS320C5x, Application Report, SPRA656, March 2000
[7] P. Thiago and N. Sergio,“Efficient Search in the Adaptive Codebook for ITU-T G.729 Codec”,IEEE Signal Processing Letters, VOL. 16, NO. 10, pp. 881-884, October 2009.
[8] G. Kaosar and T. Sheltami,“Voice transmission over ad hoc network adapting optimum approaches to maximize the performance”, Computer Communications, vol. 32, pp. 634–639, 2009.
[9] A. Zolghadr, E. Gooddarzi and M. Moosavinezhad,“Real-time implementation of G.723.1 speech coder”, Iranian Journal of Information Science and Technology, vol.2, No.1, pp. 3-12, 2004.
[10] B. Joen, S. Kang, S. Baek and K. Sung,“Filtering of a Dissonant Frequency Based on Improved Fundamental Frequency Estimation for Speech Enhancement”, IEICE Trans. Fundamentals, vol. E86-A, No. 8, pp. 2063-2064, August 2003.
[11] Z. Milivojevic and D. Balaneskovic,“Enhancement of the perceptive quality of the noisy speech signal by using of DFF-FBC algorithm”, Facta Universitatis, Ser.: Elec. Energ. vol. 22, no. 3, pp. 379-392, December 2009.
[12] L. Qiu, H. Yang and S. Koh,“Fundamental frequency determination on instantaneous frequency estimation”, IEEE Signal Process., vol. 44, pp. 233-241, 1995.
[13] A. Cheveigne and H. Kawahara,“YIN, a fundamental frequency estimator for speech and music”, J. Acoust. Soc. Am., Vol. 111, No. 4, pp. 1917-1930, April 2002.
[14] T. Murakami and Y. Ishida,“Fundamental frequency estimation of speech signal using MUSIC algorithm”, Acoust. Sci. & Tech. vol. 22, pp. 293-297, 2001.
[15] A. Kacha, F. Grenez and K. Benmahammed,“Time–frequency analysis and instantaneous frequency estimation using two-sided linear prediction”,IEEE Signal Processing, vol. 85, pp. 491-503, 2005.
[16] R. Keys,“Cubic convolution interpolation for digital image processing”,IEEE Trans. Acoust., Speech & Signal Process, vol. 29, pp. 1153-1160, 1981.
[17] K. Park and R. Schowengerdt,“Image reconstruction by parametric cubic convolution”,Computer Vision, Graphics & Image Processing, vol. 23, pp. 258-272, 1983.
[18] S. Reichenbach,“Two-Dimensional Cubic Convolution”, IEEE Transactions on image processing, Vol. 12, No. 8, pp. 857-865, August 2003.
[19] H. Pang, S. Baek and K. Sung, “Improved Fundamental Frequency Estimation Using Parametric Cubic Convolution”,IEICE Trans. Fundamentals. vol. E83-A, pp. 2747-2750, 2000.
[20] Z. Milivojevic, M. Mirkovic and S. Milivojevic,“An Estimate of Fundamental Frequency Using PCC Interpolation –Comparative Analysis”,Information technology and Control, vol. 35, pp. 131-136, 2006.
[21] Z. Milivojevic and M. Mirkovic,“Estimation of the fundamental frequency of the speech signal modeled by the SYMPES method”, Int. J. Electron. Commun. (AEÜ), vol. 63, pp. 200–208, 2009.
[22] Z. Milivojevic, M. Mirkovic and S. Milivojevic, “Fundamental Frequency Estimation of The Speech Signal Compressed by MP3 Algorithm Using PCC Interpolation”, Advances in Electrical and Computer Engineering Journal, Vol. 10, no. 1, pp. 18-22, 2010. [23] Z. Milivojevic and D. Brodic,“Estimation of the Fundamental Frequency of the Speech Signal Compressed by G.723.1 Algorithm