e-ISSN: 2278-067X, p-ISSN: 2278-800X, www.ijerd.com
Volume 10, Issue 9 (September 2014), PP.46-56
Simulation of a Large Scaled Web Application on the Cloud
Using Cloud Analyst
Priyanka Rajput, Sanjeev Kumar
Dept. of Computer Science & Engineering ,Patel College of Science & Technology, Bhopal, MP, India Assistant Professor, Dept. of Computer Science & Engineering, Laxmipati Institute of Science & Technology,
Bhopal, MP, India
Abstract:
-
Cloud computing is Internet based computing where virtual shared servers provide software, infrastructure, platform, devices and other resources and hosting to customers on a pay-as-you-use basis. The advancement of Cloud technologies in the last few years has opened up new possibilities to Internet applications developers. Resources and software are shared on the basis of client’s demand in cloud environment. Essentially, dynamic utilization of resources is achieved under different conditions with various previous established policies. Sometime it is very much difficult and time consuming to measure performance of the applications in real cloud environment. Cloud simulators are required for cloud system testing to decrease the complexity and separate quality concerns. This actually reduces the cost of reconstruct as changes have been made during design time. Simulation technique provides lots of advantages as the experiments can be carried out with voluminous data in different abstraction level. In this paper we introduce CloudAnalyst to simulate large-scaled web applications on the Cloud with the purpose of studying the behaviour of such applications under various deployment configurationsKeywords:- Cloud Computing; Simulation and Modelling; CloudAnalyst; Virtual Machines
I.
INTRODUCTION
Cloud Computing has become an extremely attractive topic of research and application these days. NIST has defined Cloud Computing as “a model for enabling convenient, on-demand network access to a shared pool of configurable Computing resources” [1, p.1]. Cloud security and storage have grasped lots of attention in this field [2]. Vaquero et al [3] argue that to offer a comprehensive definition of Cloud Computing is like “A large pool of easily usable and accessible virtualised resources, such as hardware, development platforms, and/or services. These resources can be dynamically re-configured to adjust to a variable load (scale), allowing also for an optimum resource utilisation. This pool of resources is typically exploited by a pay-per-use model in which guarantees are offered by the Infrastructure Providers by means of customised Service Level Agreements (SLAs)”. Therefore, the main Cloud Computing characteristics and features, which can be derived from the definition above, are virtualisation, dynamic scalability, resource utilisation, and a business model of on-demand services based on SLAs. Therefore, Cloud Computing can be seen as providing useful opportunities for some businesses. Basically, it can offer economical and technological benefits. In terms of economic benefits, organisations can reduce the huge costs of large capital investments in IT resources by simply paying only for offered on-demand services (during peak time) from a Cloud provider, as well as lowering the cost of labour and IT resources maintenance [4], [5]. In terms of technological benefits, Cloud Computing can offer easier group collaboration, such as sharing documents between users from anywhere, regardless of their operating systems. Also, it can offer on-demand scaling of resources, such as acquiring unlimited storage capacity [4] However, Cloud Computing comes with some disadvantages as well. For example, it requires constant connection to the Internet in order to access the services. Also, it mostly requires high bandwidth for data transfer [4].
In this consequence, simulation is very much helpful to allow users or developers with practical feedback in spite of having real environment. There are different simulation tools that can be used for the experimental development of Cloud Computing. CloudSim is an extensible toolkit used to model and simulate cloud infrastructures, including data centres, users, user workloads, and application provision environments [6], [7]. CloudAnalyst is built on top of the CloudSim toolkit; it provides visual modelling, easy to use graphical user interfaces, and large-scale application simulations deployed on the cloud infrastructure. This paper investigates into extending these techniques to study the behavior of large scaled Internet application in a cloud environment and proposes a simulation tool “CloudAnalyst” that can be used for simulating this type of large scaled applications.
detail of CloudAnalyst in Section 5 and in section 6 we define the setting of simulation. Section 7 shows the simulation screen and we give our result in section 8. We draw our conclusions in Section 9.
II.
SIMULATION IN CLOUD
Simulation means mimicking the actual environment towards benefit of the research. The user or researcher can actually analyze the proposed design or existing algorithms through simulation. IT companies who are willing to offer some services in the Cloud can use this tool to perform some benchmarking experiments with the services to be offered in dependable, scalable, repeatable, and controllable environments before real deployment in the Cloud. Therefore, they can test their services in a controlled environment free of cost, and through a number of iterations, with less effort and time. Also, by using simulation, they can carry out different experiments and scenarios to identify the performance bottlenecks of resources and develop provisioning techniques before real deployment in commercial Clouds. They can check the efficiency and merit of the design before the actual system is constructed. Simulation is advantageous to the users, as they can explore the benefit of that design repeatedly. Simulators easily make available various kind of virtual environment for verification and performance evaluation of the experimented system. Even most of the time researchers could carry out benchmark experiments repeatedly in scalable environment for evaluating different aspects [8].
III.
RELATED WORK
The cloud is where we go to use technology when we need it, for as long as we need it, and not a minute more. We do not install anything on our desktop, and we do not pay for the technology when we are not using it [9]. According to the IEEE Computer Society Cloud Computing is: "A paradigm in which information is permanently stored in servers on the Internet and cached temporarily on clients that include desktops, entertainment centers, table computers, notebooks, wall computers, handhelds, etc". “Cloud Computing is a type of parallel and distributed system that consists of a collection of computers interconnected, virtualized and presented as a single processing unit based on a SLA with a negotiation mechanism between the service provider and the consumer of this service” [10].
Cloud computing is typically divided into three levels of service offerings: Software as a Service (SaaS), Platform as a Service (PaaS), Infrastructure as a service (IaaS). These levels support virtualization and management of differing levels of the solution stack [11].
Some of this simulators are GridSim [12] MicroGrid [13], GangSim [14], SimGrid [15] and CloudSim [16]. While the first three focus on Grid computing systems, CloudSim is, for the best of our knowledge, the only simulation framework for studying Cloud computing systems. GridSim toolkit was developed by Buyya et al to address the problem of near impossibility of performance evaluation of real large scaled distributed environments (typically Grid systems but also P2P networks) in a repeatable and controlled manner. The GridSim toolkit is a Java based simulation toolkit that supports modelling and simulation of heterogeneous Grid resources and users spread across multiple organizations with their own policies. It supports multiple application models and provides primitives for creation of application tasks, mapping of tasks to resources and managing such tasks and resources.
GangSim is a Grid simulation toolkit that provides support for modeling of Grid-based virtual organisations and resources. SimGrid is a generic framework for simulation of distributed applications in Grid platforms.
IV.
CLOUD SIM
CloudSim is a self-contained platform which can be used to model data centers, service brokers, scheduling and allocation policies of a large scaled Cloud platform. It provides a virtualization engine with extensive features for modelling the creation and life cycle management of virtual engines in a data center.
4.1 CAPABILITIES
CloudSim has some compelling features and capabilities that can be extended to model a custom Cloud Computing environment. CloudSim can offer flexibility and applicability and with less time and effort to support initial performance testing. It can support simulating, from small-scale up to large-scale cloud environments containing data centres, with little or almost no overheads in terms of initialisation and consumption of memory. Also, it has a virtualisation engine that allows the creation of multiple virtualised services that can be independently managed on a single node of the data centre.
4.2 LIMITATIONS
offer a separation of the simulation experimentation exercise from the technicalities of programming, using the library in order to ease modelling by simply focusing on the complexity of the simulated scenario, without spending much effort and time on the language in which the simulator is interpreted.
V.
CLOUD
ANAYLST
Cloud Analyst separates the simulation experimentation exercise from a programming exercise. It also enables a modeler to repeatedly perform simulations and to conduct a series of simulation experiments with slight parameters variations in a quick and easy manner. CloudAnalyst can be applied to examining behavior of large scaled Internet application in a cloud environment.
5.1 CLOUDANALYST DESIGN
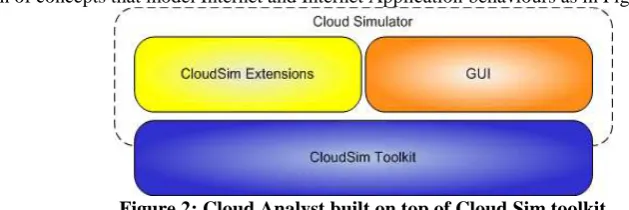
The Cloud Analyst is built on top of Cloud Sim tool kit, by extending Cloud Sim functionality with the introduction of concepts that model Internet and Internet Application behaviours as in Figure 2.
Figure 2: Cloud Analyst built on top of Cloud Sim toolkit
5.2 FUNCTIONALITY
In addition to the Data Center operations provided by the CloudSim toolkit, following additional functionality is required for the CloudAnalyst.
• Application users – Autonomous entities are required to act as traffic generators and their behaviour needs to be configurable.
• Internet – The data transmissions across the Internet needs to be realistically modelled with network delays and bandwidth restrictions.
• Simulation defined by time period – CloudSim as a toolkit is designed to process a pre-defined series
of events. But for our purpose we need to convert the simulation to a time-frame limited execution where events are continuously generated by users until a pre-defined time period expires.
• Service Brokers –For CloudAnalyst, DataCenterBrokers assigned to two different entities. The
DataCenterController extends DataCenterBroker and is primarily responsible for the VM management within a single data center and load balancing of VM’s etc within that single data center. The new entity CloudAppSeriveBroker was introduced to handle the responsibility of managing the routing of user requests between data centers based on different service brokerage policies.
• GUI - CloudAnalyst also introduces a comprehensive GUI which can be used to configure the simulation at a high level of detail.
• Ability to save simulations and results – The CloudAnalyst also allows users to save a simulation configuration as a xml.file and also the exporting of results into PDFl format.
VI.
SETTING UP A SIMULATION
We need to carry out the following steps.
1. Define user bases – Using User Base entities define the users of the application, their geographic distribution, and other properties such as the number of users, the frequency of usage and the pattern of usage such as peak hours. This is done in the Main tab of the Configure Simulation screen.
2. Define data centers – Using the Data Centers tab of the Configuration screen define the data centers we wish to use in the simulation. Define all the hardware and accounting aspects of the data centers here. 3. Allocate Virtual Machines for the application in Data Centers – Once the data centers have been
created, we need to allocate virtual machines in them for the simulated application using the Main tab of the Configurations screen. A data center defined in step 2 above does not get included in the simulation unless it is allocated in this step. We can allocate multiple types of virtual machines in the same data center during this step.
4. Review and adjust the advanced parameters in the Advanced tab of the Configuration Screen.
VII.
SIMULATOR SCREENS
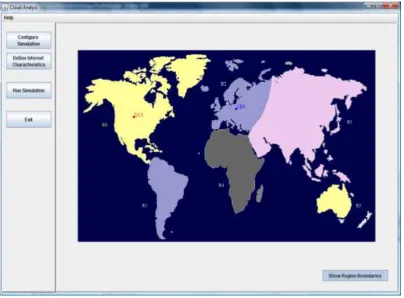
7.1 MAIN SCREEN WITH SIMULATION PANELMain screen has the simulation panel with a map of the world on the right and the main control panel on the left as shown in Figure 3. As mentioned the CloudAnalyst divides the world in to 6 regions that coincide roughly with the 6 main continents. Control Panel options are: Configure Simulation, Define Internet Characteristics, Run Simulation and Exit.
Figure 3: Cloud Analyst Main Screen
7.2 CONFIGURE SIMULATION SCREEN Configure Simulation screen has three tabs.
7.2.1 MAIN TAB
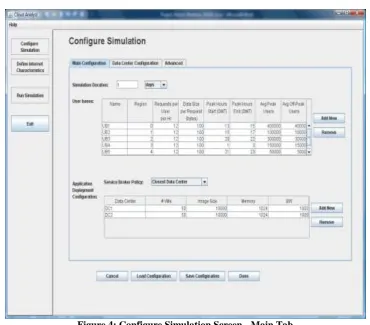
In Figure 4, the configuration options on the main tab are:
1. Simulation time – the duration of the simulation which can be given in minutes, hours or days, e.g.1 day
2. User Bases Table – Each user base has following configurable fields, represented by a single row in the table.
a. Name, e.g. UB1, UB2, UB3, UB4, UB5
b. Region, e.g. 0, 1, 2, 3, 4
c. Requests per user per hour, e.g. 12 Hr for each d. Data size per request (in bytes), e.g. 100 for each
e. Peak hours (in GMT), e.g. Start- 13,15, 20, 1, 21; End- 15, 17, 22, 3, 23
f. Average users during peak hours, e.g. 400000, 100000, 150000, 50000
g. Average users during off-peak hours, e.g. 40000, 10000, 15000, 5000
3. Application Deployment Configuration – This table lists how many virtual machines are allocated for
the application in each data center from the Data Centers tab, along with the details of a virtual machine. The fields are:
a. Data Center – names of data centers created e.g. DC1, DC2.
b. Number of VMs – How many VMs to be allocated to the application from the selected data center, e.g.
50, 50
c. Image Size – VM image size in bytes, e.g. 10000 for each
d. Memory – available to a single VM e.g. 1024 mb for each
Figure 4: Configure Simulation Screen - Main Tab
4. Service Broker Policy – This drop down allows to select the brokerage policy between data centers that
decide which data center should receive traffic from which user base. The available policies are: a. Closest data center – The data center with the least network latency (disregarding network bandwidth) from a particular user base is sent all the requests from that user base. b. Optimize response time – This policy attempts to balance the load between data centers when one data center gets over loaded.
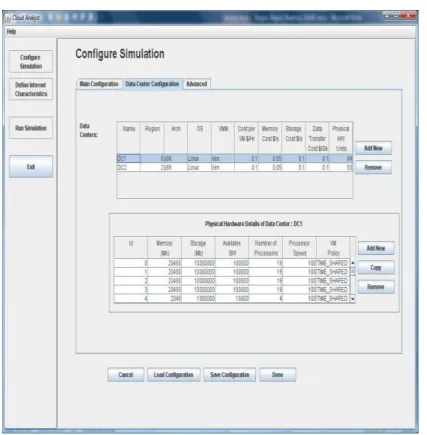
7.2.2 DATA CENTER TAB
The data center tab allows to define the configuration of a data center (see Figure 5 below). The parameter fields are:
1. Name, e.g. DC1, DC2 2. Region, e.g. 0, 2
3. Architecture – Architecture of the servers used in the data center, e.g. X86 for each 4. Operating System , e.g. Linux for each
5. Virtual Machine Monitor (VMM), e.g. Xen for each
6. Cost per VM Hour, e.g. 0.1for each
7. Cost per 1Mb Memory Hour, e.g. 0.05 for each 8. Storage cost per Gb, e.g. 0.1 for each
9. Data Transfer cost per Gb (both in and out), e.g. 0.1 10. Number of servers, e.g. 84, 83
When we select a data center from this table a second table will appear below it with the details of the server machines in the data center. The parameters for each machine can be given according to the available fields. 1. Machine Id, e.g. 0, 1, 2, 3, 4
2. Memory, e.g. 20480, 20480, 20480, 20480, 2048
3. Storage, e.g. 10000000, 10000000, 10000000, 10000000, 1000000
4. Available network bandwidth, e.g. 100000, 100000, 100000, 100000, 10000 5. Number of processors, e.g. 16, 16, 16, 16, 4
6. Processor speed (MIPS), e.g. 100 for each
Figure 5. Configure Simulation Screen - Data Center Tab
7.2.3 ADVANCED TAB
In Figure 6, the advanced tab contains some important parameters that apply to the entire simulation. 1. User Grouping Factor (in User Bases) – This parameter tells the simulator how many users should be treated as a single bundle for traffic generation. The number given here will be used as the number of requests represented by a single InternetCloudlet, e.g. 1000
2. Request Grouping Factor (in Data Centers) – This parameter tells the simulator how many requests should be treated as a single unit for processing i.e. this many requests are bundled together and assigned to a single VM as a unit, e.g. 100
3. Executable instruction length (in bytes) – This is the main parameter that affects the execution length of a request, e.g. 250
Figure 6: Configure Simulation Screen - Advanced Tab
7.3 INTERNET CHARACTERISTICS SCREEN
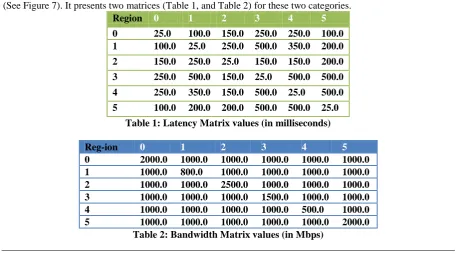
The Internet Characteristics screen can be used to set the Internet latency and bandwidth parameters (See Figure 7). It presents two matrices (Table 1, and Table 2) for these two categories.
Region 0 1 2 3 4 5
0 25.0 100.0 150.0 250.0 250.0 100.0 1 100.0 25.0 250.0 500.0 350.0 200.0
2 150.0 250.0 25.0 150.0 150.0 200.0
3 250.0 500.0 150.0 25.0 500.0 500.0
4 250.0 350.0 150.0 500.0 25.0 500.0
5 100.0 200.0 200.0 500.0 500.0 25.0
Table 1: Latency Matrix values (in milliseconds)
Reg-ion 0 1 2 3 4 5
0 2000.0 1000.0 1000.0 1000.0 1000.0 1000.0 1 1000.0 800.0 1000.0 1000.0 1000.0 1000.0 2 1000.0 1000.0 2500.0 1000.0 1000.0 1000.0 3 1000.0 1000.0 1000.0 1500.0 1000.0 1000.0 4 1000.0 1000.0 1000.0 1000.0 500.0 1000.0 5 1000.0 1000.0 1000.0 1000.0 1000.0 2000.0
Figure 7: Internet Characteristics Screen
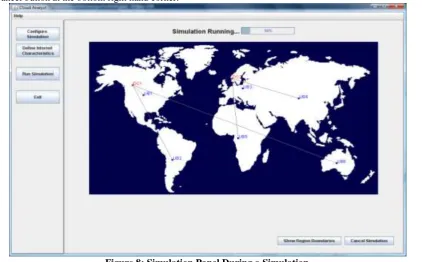
7.4 RUNNING A SIMULATION
The simulation screen (in Figure 8) will display a simple animation showing which user bases are sending messages to which data centers. A simulation can be cancelled before the completion of the run, using the cancel button at the bottom right hand corner.
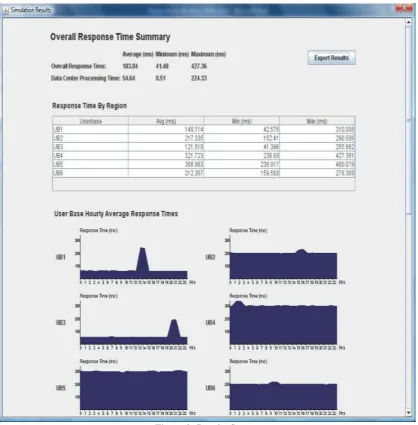
VIII. RESULTS SCREEN
The detailed results can be viewed by clicking the “View Detailed Results” button that appears at the right hand bottom corner of the screen after the simulation has completed (In Figure 9). The results screen will list out the data collected from the simulation. This includes:
1. Overall response time summary (for all the user bases) 2. Response time by user base in tabular format
3. Response time by user base in graphical format broken down into the 24 hours of the day 4. Request servicing time by each data center in tabular format
5. Request servicing time by data center in graphical format broken down into 24 hours of the day
6. Data center loading (number of requests serviced) in graphical format broken down in to 24 hours of the day 7. Cost details
Figure 9: Results Screen
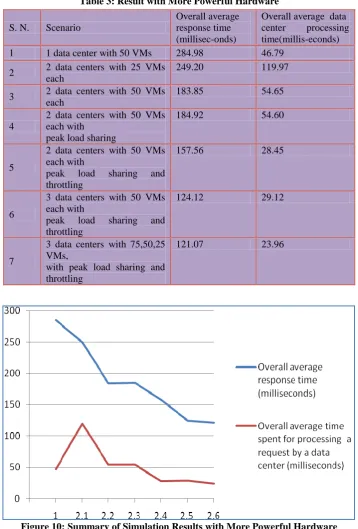
Therefore we obtained the following results for the same experiments with more powerful hardware configurations of:
Data Center – Processor speed- 10000 MIPS
VM Image Size- 100000
VM Memory- 10240 Mb
VM Bandwidth- 10000
Table 3: Result with More Powerful Hardware
Figure 10: Summary of Simulation Results with More Powerful Hardware
XI.
CONCLUSION
This paper presents a concept of Cloud Computing and simulators. In this paper, a broad survey of CloudAnalyst toolkit is carried out. It also focus on how a large scaled web application running on a cloud can be simulated using CloudAnalyst. We showed how the simulator can be used to effectively identify overall usage patterns and how such usage patterns affect the data centers hosting the application. We also showed how the simulator can be used to study how different deployment configurations would tackle these usage patterns. Such a study would benefit the application designers greatly in identifying the optimal configuration for their application. But more importantly such a study will generate valuable insights in to designing Cloud infrastructure services in areas such as coordination between Data Centers, load balancing algorithms and possible value added services such as Service Brokers to coordinate between Data Centers to optimize the application performance and cost to the owners.
S. N. Scenario
Overall average response time (millisec-onds)
Overall average data
center processing
time(millis-econds)
1 1 data center with 50 VMs 284.98 46.79
2 2 data centers with 25 VMs
each
249.20 119.97
3 2 data centers with 50 VMs
each
183.85 54.65
4
2 data centers with 50 VMs each with
peak load sharing
184.92 54.60
5
2 data centers with 50 VMs each with
peak load sharing and
throttling
157.56 28.45
6
3 data centers with 50 VMs each with
peak load sharing and
throttling
124.12 29.12
7
3 data centers with 75,50,25 VMs,
with peak load sharing and throttling
REFERENCES
[1]. Mell, P. and Grance, T. (2011) The NIST Definition of Cloud Computing. [Internet], National Institute
of Standards and Technology, September, p.1-3. Available from:
<http://csrc.nist.gov/publications/nistpubs/800-145/SP800-145.pdf> [Accessed 8th June 2012]
[2]. Deng, J et al (2010) Research and Application of Cloud Storage. 2nd International Workshop on Intelligent Systems and Applications (ISA), 22-23 May, pp. 1-5.
[3]. Vaquero, L. et al (2009) A Break in the Clouds: Towards a Cloud Definition. ACM SIGCOMM Computer Communication Review, 39(1), January, pp. 50-55.
[4]. Miller, M. (2008) Cloud Computing: Web-Based Applications That Change the Way You Work and Collaborate Online. United States of America: Que Publishing.
[5]. Velte, A., Velte, T., and Elsenpeter, R. (2010) Cloud Computing: A Practical Approach. United States
of America: McGraw-Hill.
[6]. Calheiros, R. et al (2010) CloudSim: A Toolkit for Modelling and Simulation of Cloud Computing Environments and Evaluation of Resources Provisioning Algorithms. Software – Practice and Experience 41, 24 August, pp. 23-50, John Wiley & Sons, Ltd.
[7]. Wickremasinghe, B., Calheiros, R. and Buyaa, R. (2010) CloudAnalyst: a CloudSim-based Visual Modeller for Analysing Cloud Computing Environments and Applications. 24th IEEE International Conference on Advanced Information Networking and Applications, 20-23 April, pp. 446-452.
[8]. Quiroz, A. et al (2009) Towards autonomic workload provisioning for enterprise grids and clouds. 10th IEEE/ACM International Conference on Grid Computing, 13-15 October, pp. 50-57.
[9]. George Reese. : Cloud Application Architectures, April 2009.
[10]. Calheiros Rodrigo N., Rajiv Ranjan, César A. F. De Rose, Rajkumar Buyya (2009): CloudSim: A Novel Framework for Modeling and Simulation of Cloud Computing Infrastructures and Services CoRR abs/0903.2525: (2009)
[11]. Oracle White Paper. : Architectural Strategies for Cloud Computing, August 2009
[12]. R. Buyya, and M. Murshed, “GridSim: a toolkit for the modeling and simulation of distributed resource management and scheduling for Grid computing,” Concurrency and Computation: Practice and Experience, vol. 14, Nov. 2002, pp. 1175-1220.
[13]. L. X. Song H, Jakobsen D, Bhagwan R, Zhang X, Taura K, A. Chien, "The MicroGrid: A scientific tool for modeling computational Grids," Proc. of the ACM/IEEE Supercomputing Conference, IEEE Computer Society, Nov. 2001.
[14]. C. Dumitrescu, and I. Foster. “GangSim: a simulator for grid scheduling studies,” Proc. of the 5th International Symposium on Cluster Computing and the Grid (CCGrid 05), IEEE Computer Society, May 2005.
[15]. A. Legrand, L. Marchal, and H. Casanova, "Scheduling distributed applications: the SimGrid simulation framework," Proc. of the 3rd IEEE/ACM International Symposium on Cluster Computing and the Grid (CCGrid 07), May 2001, pp. 138-145.
[16]. R. Buyya, R. Ranjan, and R. N. Calheiros, “Modeling and Simulation of Scalable Cloud Computing