GA Based Fuzzy Logic Controller For A
Pressure Process Station
C.Hemalatha
Assistant Professor
Department of Electrical and Electronics, Gnanamami College of Technology, Namakkal
Mridul Pandey
Assistant Professor
Department of Electrical and Electronics Gnanamami College of Technology, Namakkal
Amit Kumar Sinha
Research Scholar Power Electronics
Srijita Singha Roy
UG Scholar
Department of Electronics and Communications Engineering, Gnanamami College of Technology, Namakkal
Abstract- In this paper, a genetic algorithm based optimization mechanism is involved in order to optimize the mid-points of the membership functions of PD-Fuzzy logic controller. An optimization methodology for the PD-FLC is designed using the GA Tool, which can automatically optimize the mid points of the membership functions. The proposed approach is applied to a pressure process station whose simulation results are presented.
Keywords – PD-FLC, GA Tool, PD-Fuzzy,
I.INTRODUCTION
performing closed loop simulations or experiments, it is required to to refine the Fuzzy response, either online or offline. Unfortunately, the classical optimization techniques such as gradient point method cannot be easily applied for this problem. The advancement of GA and its flexibility provides an alternative solution and better results that can replace the convectional optimization techniques. The GA based algorithm came in existence in the year 1962 and it is based on Darwin’s theory ‘Survival of the Fittest’, one such application of automatic control using GA-FLC is provided in . RP Huang presents a practical approach in design of an adaptive fuzzy control system for a three phased inference engine [8].
This paper presents a simple but efficient GA based optimization mechanism involved for a Fuzzy logic controller for optimizing the mid points of the fuzzy inference system on a pressure process station.
II.EXPERIMENTAL SETUP
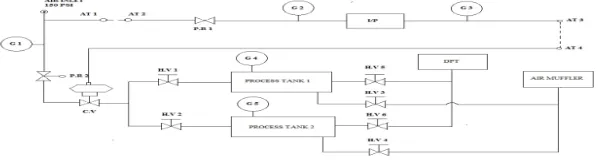
The pressure process station is interfaced with a personal computer using VD-104 module. The laboratory setup consists of two pressure tanks, a pneumatic control valve, a pressure regulator, an air muffler, a differential transmitter, release valve setup, compressor and several hand valves. The schematic of the pressure process station is as shown in Fig. 2 below.
Fig 2: Schematic of the experimental set up for pressure process station
The compressor gives the air pressure at 150 psi which is then regulated using a pressure regulator to the operable 3-15 psi. The pneumatic control valve opens or closes according to the control signal given by the PC through the interfacing module (VD-104). According to the control action, pressure is filled in the tank system and the differential pressure between the two tanks is sensed through a DPT. The main use of air muffler is to avoid the moisture content and dust prevailing in the tank system and in the pneumatic line.
III.SYSTEM IDENTIFICATION &MODEL VALIDATION OF PRESSURE PROCESS STATION
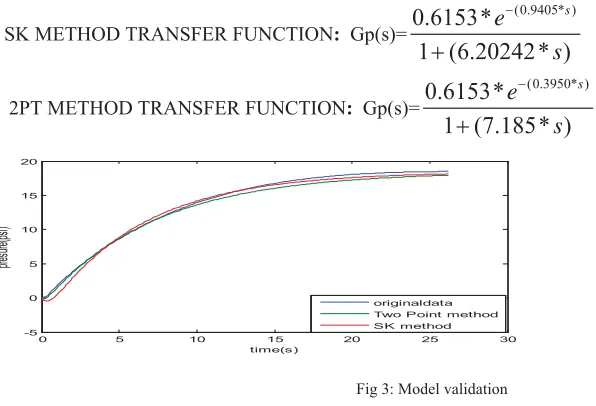
The mathematical model of the pressure process station is obtained by reaction curve method, where a step change in input is given to the system and from the output response the behavioral model is obtained. In order to obtain the model, we involve two techniques namely Sundaresan-Krishnaswamy method (SK) and Two-Point method. By these methods, the obtained model will be a First Order Plus Dead Time (FOPDT) model which is as shown below.
Gp(s)=
1
d
p s
K
e
s
T
W
SK method:
Time delay: ș (1.3*t1)-(0.29*t2) 7LPHFRQVWDQWIJ t2-t1)
Where
SK METHOD TRANSFER FUNCTION: Gp(s)=
(0.9405* )
0.6153*
1 (6.20242* )
s
e
s
2PT METHOD TRANSFER FUNCTION: Gp(s)=
(0.3950* )
0.6153*
1 (7.185* )
s
e
s
0 5 10 15 20 25 30
-5 0 5 10 15 20
time(s)
pres
ure(
psi
)
originaldata Two Point method SK method
Fig 3: Model validation
Depending on the error calculation (ITAE, ISE, IAE), the best model is chosen for controller implementation.
Table # indicates that out of the two models, the SK method is having the minimum error. So further work in this paper is based on SK method’s model (model validation).
Error S-K Method Two Point Method
ITAE 40.54557785 59.68163514
ISE 74.6476556 92.79817272
IAE 908.5598792 1586.619706
IV.FUZZY LOGIC CONTROLLER AND GA BASED FUZZY LOGIC CONTROLLER DESIGN
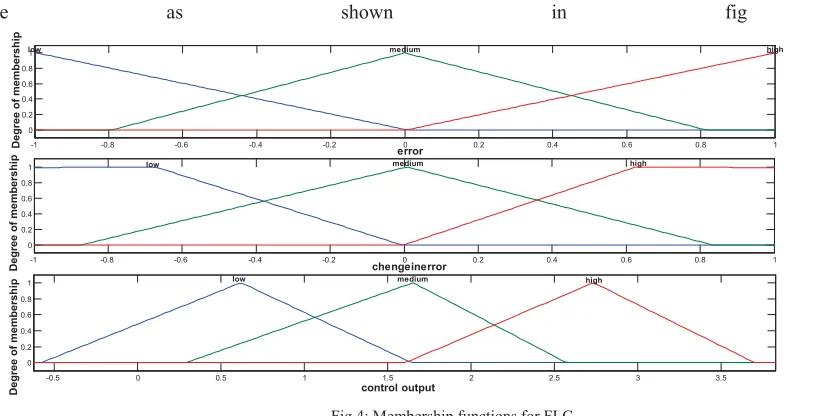
Fuzzy logic controllers are those controllers that works on the fuzzy implication, that is “if this : if that : then that” (nothing but AND logic). Design of fuzzy logic controllers mainly involves three steps, namely Fuzzification, Fuzzy rule base, Defuzzification. Fuzzification is a process in which the input’s are fuzzified between a range of 0 to 1. Rule base is formed by the experts knowledge and depending on the inputs, the rule base generates the corresponding linguistic variable output. This output is once again defuzzified from 0 to 1 to a global value.
are as shown in fig 4.
-1 -0.8 -0.6 -0.4 -0.2 0 0.2 0.4 0.6 0.8 1 0
0.2 0.4 0.6 0.8 1
error
Degree of membership
low medium high
-1 -0.8 -0.6 -0.4 -0.2 0 0.2 0.4 0.6 0.8 1 0
0.2 0.4 0.6 0.8 1
chengeinerror
Degree of membership
low medium high
-0.5 0 0.5 1 1.5 2 2.5 3 3.5
0 0.2 0.4 0.6 0.8 1
control output
Degree of membership
low medium high
Fig 4: Membership functions for FLC
Genetic Algorithm is a powerful optimizing tool that is based on the mechanism of natural selection and natural genetics. Genetic algorithm has 3 main operations, namely REPRODUCTION, CROSSOVER and MUTATION. A simple diagrammatic representation of GA is as shown in fig 5.
Fig 5: Flow chart for GA
In general, Genetic Algorithm can be used to optimize the fuzzy rules, membership functions and mid points of the membership function. In the present case, we are using the GA to optimize the mid points of the membership function of the FLC. As seen from the previous section, the designed FLC has 3 membership functions that is in total 9 mid points. These 9 mid points are taken in several combinations so as to obtain the best combination that is resulting in minimum ITAE. The several mid point combinations of the 3 membership functions (e, de, co) are as shown below.
COMBINATION 1: e, de, co (9 mid points),COMBINATION 2: e, de (6 mid points),COMBINATION 3: de, co (6 mid points),COMBINATION 4: co, e (6 mid points),COMBINATION 5: e (3 mid points),COMBINATION 6: de (3 mid points), COMBINATION 7: co (3 mid points)
ITAE FUNCTION: F(ITAE)=
0
t e dt
f
³
• The lower and upper bound for each 7 combinations of the ITAE function is as depicted below. lb=[-20.49, -0.791, 0.006475,(e)
-34.33, -0.8712, 0.0006733,(de) -0.5779, 0.2907, 1.607(co)]; • ub=[0.005291, 0.8121, 18.76,(e)
-0.007976, 0.8322, 34.33,(de) 1.643, 2.572, 3.701(co)];
VI. RESULT AND COMPARISON
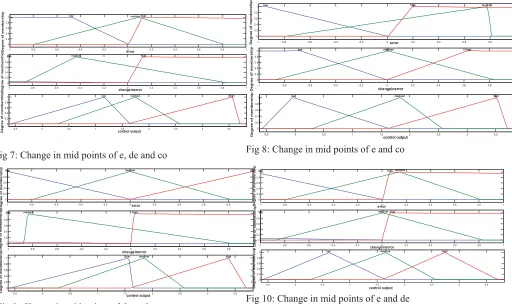
As discussed in the previous sections, the mid points of membership functions are altered according to GA satisfying the objective function. The unaltered midpoints for membership functions of simple FLC is as shown in fig 7. So the altered midpoints for all 7 combinations are given below.
-1 -0.8 -0.6 -0.4 -0.2 0 0.2 0.4 0.6 0.8 1 0 0.2 0.4 0.6 0.8 1 error
Degree of membership
low medium high
-1 -0.8 -0.6 -0.4 -0.2 0 0.2 0.4 0.6 0.8 1 0 0.2 0.4 0.6 0.8 1 chengeinerror
Degree of membership
low medium high
-0.5 0 0.5 1 1.5 2 2.5 3 3.5 0 0.2 0.4 0.6 0.8 1 control output
Degree of membership
low medium high
Fig 7: Change in mid points of e, de and co
-1 -0.8 -0.6 -0.4 -0.2 0 0.2 0.4 0.6 0.8 1 0 0.2 0.4 0.6 0.8 1 error
Degree of membership
low high medium
-1 -0.8 -0.6 -0.4 -0.2 0 0.2 0.4 0.6 0.8 1 0 0.2 0.4 0.6 0.8 1 chengeinerror
Degree of membership
low medium high
-0.5 0 0.5 1 1.5 2 2.5 3 3.5 0 0.2 0.4 0.6 0.8 1 control output
Degree of membership
low medium high
Fig 8: Change in mid points of e and co
-1 -0.8 -0.6 -0.4 -0.2 0 0.2 0.4 0.6 0.8 1 0 0.2 0.4 0.6 0.8 1 error
Degree of membership
low medium high
-1 -0.8 -0.6 -0.4 -0.2 0 0.2 0.4 0.6 0.8 1 0 0.2 0.4 0.6 0.8 1 chengeinerror
Degree of membership
low medium high
-0.5 0 0.5 1 1.5 2 2.5 3 3.5 0 0.2 0.4 0.6 0.8 1 control output
Degree of membership
low medium high
Fig 9: Change in mid points of de and co
-1 -0.8 -0.6 -0.4 -0.2 0 0.2 0.4 0.6 0.8 1 0 0.2 0.4 0.6 0.8 1 error
Degree of membership
low highmedium
-1 -0.8 -0.6 -0.4 -0.2 0 0.2 0.4 0.6 0.8 1 0 0.2 0.4 0.6 0.8 1 chengeinerror
Degree of membership
low medium high
-0.5 0 0.5 1 1.5 2 2.5 3 3.5 0 0.2 0.4 0.6 0.8 1 control output
Degree of membership
low medium high
-1 -0.8 -0.6 -0.4 -0.2 0 0.2 0.4 0.6 0.8 1 0 0.2 0.4 0.6 0.8 1 error
Degree of membership
low mediumhigh
-1 -0.8 -0.6 -0.4 -0.2 0 0.2 0.4 0.6 0.8 1 0 0.2 0.4 0.6 0.8 1 chengeinerror
Degree of membership
low medium high
-0.5 0 0.5 1 1.5 2 2.5 3 3.5
0 0.2 0.4 0.6 0.8 1 control output
Degree of membership
low medium high
Fig 11: Change in mid points of e
-1 -0.8 -0.6 -0.4 -0.2 0 0.2 0.4 0.6 0.8 0 0.2 0.4 0.6 0.8 1 error
Degree of membership
low medium h
-1 -0.8 -0.6 -0.4 -0.2 0 0.2 0.4 0.6 0.8 0 0.2 0.4 0.6 0.8 1 chengeinerror
Degree of membership
low medium high
-0.5 0 0.5 1 1.5 2 2.5 3 3.5
0 0.2 0.4 0.6 0.8 1 control output
Degree of membership
low medium high
Fig 12: Change in mid points of de
-1 -0.8 -0.6 -0.4 -0.2 0 0.2 0.4 0.6 0.8 1 0 0.2 0.4 0.6 0.8 1 error D e g re e o f me mb e rs h
iplow medium high
-1 -0.8 -0.6 -0.4 -0.2 0 0.2 0.4 0.6 0.8 1 0 0.2 0.4 0.6 0.8 1 chengeinerror D e g re e o f me mb e rs h
ip low medium high
-0.5 0 0.5 1 1.5 2 2.5 3 3.5
0 0.2 0.4 0.6 0.8 1 control output D e gr e e of m e m be rs hi
p low medium
high
Fig 13: Change in mid points of co
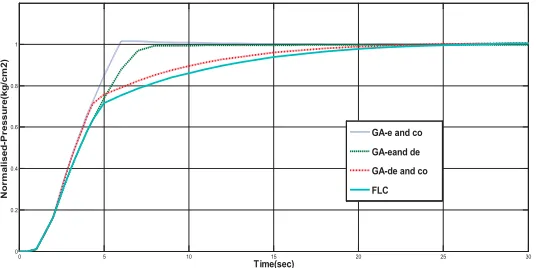
The servo output for the different combinations along with the comparison of simple FLC are as depicted in fig 14 (for 9mid points), fig15 (for 6mid points) and fig16(for 3mid points).
0 5 10 15 20 25 30
0 0.2 0.4 0.6 0.8 1 Time(sec) N o rm al ised -P re ssu re(kg /c m 2 ) FLC GA-FLC
Fig 14: Comparison of FLC with 9 mid points GA-FLC
0 5 10 15 20 25 30
0 0.2 0.4 0.6 0.8 1 1.2
Time (sec)
N o r m al is ed -P r essu r e (p si ) GA-e GA-de FLC GA-co
0 5 10 15 20 25 30 0
0.2 0.4 0.6 0.8 1
Time(sec)
N
o
rm
al
ised
-P
ressu
re
(kg
/cm
2)
GA-e and co GA-eand de GA-de and co FLC
Fig 16: Comparison of FLC with 3 mid points GA-FLC for different MF
The performance indices for all 7 combinations of the membership function for the fuzzy logic controller designed to the pressure process system is as shown in the table.
Combination ITAE ISE IAE RISE TIME SETTLING
TIME OVERSHOOT
FLC 40 9.1786 9.1786 10.6 20.5 0
GA-FLC 6.8052 9.176 9.674 3.37 5.61 1.4
GA-FLC12 7.5233 8.9289 9.4667 4.25 7.10 0
GA-FLC23 9.9776 9.2168 10.0022 4.09 15.1 0
GA-FLC31 4.9869 8.9965 9.4923 3.19 10.6 4.2
GA-FLC1 7.3854 9.1957 10.0086 5.13 6.9 1
GA-FLC2 14.7241 9.1284 10.2154 9.8 20.2 0
GA-FLC3 37.064 9.3654 10.8101 7.4 15.8 0
VII.CONCLUSION
REFERENCES
[1] Fa-Chao Li, Lian-Qing Su, Hai-Chao Ran “The fuzzy genetic algorithm based on rule” Proceeding of fourth international conference on machine learning and cybernetics, Guangzhou ,18-12 August 2005.
[2] E.H.Mamdani, “Application of fuzzy algorithm for control of simple dynamic plant”,Proc.IEEE,part D ,01.121,1585-1581987,4 [3] L.A.Zedah, “fuzzy sets”,Inform. Control,vol.8,pp.338-353,1965.
[4] T.J. Procyk and E.H. Mamdani, "A linguistic self-organizing process controller", Automatica, vol. 15, pp. 15-30, 1979.
[5] Craig D. Boesack, Tshilidzi Marwala and Fulufhelo V.Nelwamondo, “Application of GA-Fuzzy controller design to Automatic Generation Control”, Third International Workshop on Advanced Computational intelligence, august 25-27,2010
[6] Xiao-Ping Zong, Yan-Jie Kou, “Optimization design method of Fuzzy controller based on GA”, Proc. Of the fourth international conference on Machine Learning cybernetics, Guangzhou ,18-12 August 2005.
[7] Leebher Yao and Chin-chin Lin, “Design of self tuning Fuzzy PID controller by the Accumulated Genetic Algorithm”, IEEE ICIT02 Bangkok 2002.
[8] RP Huang, “Adaptive Fuzzy Control: A GA Approach” IEEE conference 1996.