R E S E A R C H
Open Access
Evaluating minimal important differences
and responder definitions for the asthma
symptom diary in patients with moderate
to severe asthma
Gary Globe
1, Ingela Wiklund
2, Maria Mattera
3, Hao Zhang
1and Dennis A. Revicki
4*Abstract
Background:The Asthma Symptom Diary was developed to assess severity of symptoms in patients with moderate to severe asthma, and has evidence supporting reliability and validity. Only limited information is available on sensitivity to change and responder definitions for the Asthma Symptom Diary.
Objectives:Main study objectives were to evaluate sensitivity to change and provide responder definitions for clinically meaningful effects for the Asthma Symptom Diary.
Methods:This is a secondary analysis of Phase II clinical trial data in patients with moderate to severe asthma, Asthma Symptom Diary (ASD) was collected daily during the 24-week study. The Asthma Control Questionnaire and the Patient Global Assessment were collected at baseline, and week 12 and 24. Analysis of covariance (ANCOVA) models were used to evaluate sensitivity to change in Asthma Symptom Diary scores after 12 and 24 weeks of treatment. Anchor-based methods, using Asthma Control Questionnaire and Patient Global Assessment defined anchors, were used to identify minimal important differences and various responder criteria for changes in mean 7-day ASD score, symptomatic days, and minimal symptom days.
Results:Sample was 59% female, 81% White, with a mean age of 47.3 (SD = 13.6) years. ANCOVAs demonstrated significant differences in baseline to week 12 and week 24 changes in mean 7-day Asthma Symptom Diary scores and symptomatic days by Asthma Control Questionnaire (allp< 0.001) and Patient Global Assessment anchors (all p< 0.001). Meaningful responders, from the patient’s perspective, were defined as improvements of 0.5–0.6 points (SD = 0.6; scale range 0 to 4) in mean 7-day Asthma Symptom Diary scores, and as a reduction of 2 to 3 Asthma Symptom Diary-based symptomatic days.
Conclusion:The Asthma Symptom Diary was responsive to changes in clinical status in patients with moderate to severe asthma. Responder definitions were identified, including symptomatic days, for evaluating individual level treatment effects in clinical trials.
Keywords:Asthma, Asthma symptom diary, Interpretation guidelines, Minimal important difference, Responder definitions, Responsiveness to change
© The Author(s). 2019Open AccessThis article is distributed under the terms of the Creative Commons Attribution 4.0 International License (http://creativecommons.org/licenses/by/4.0/), which permits unrestricted use, distribution, and reproduction in any medium, provided you give appropriate credit to the original author(s) and the source, provide a link to the Creative Commons license, and indicate if changes were made.
Background
Asthma is a chronic respiratory illness characterized by airway remodeling, inflammation, and immunological hyper-responsiveness to allergens [22]. Approximately 300 million people worldwide suffer from asthma and many of these patients are poorly controlled [9]. Based on the 2014 Centers for Disease Control estimates, the overall prevalence of asthma is 8% in the US, with preva-lence rates of 9% in children and 7% in adults [5]. In 2009, 52% of asthmatics (both adults and children) expe-rienced an asthma attack that increased their risk for an emergency department visit or an inpatient hospitalization [1]. Patient reported symptoms and health-related quality of life (HRQL) are important mea-sures of disease experience and impact of asthma, and previous research has demonstrated the HRQL burden of asthma [2,6,28–30].
Daily diaries have frequently been used to assess symptom severity and treatment effectiveness in asthma clinical trials [16, 20, 26]. However, few of these symptom diaries have been systematically developed, and have evidence supporting their reliability and validity, and established responder definitions [3, 25, 31]. The Food and Drug Administration (FDA) has recommended that patient reported outcome (PRO) measures, including daily symptom diaries, are developed based on patient qualita-tive information and that these measures have evidence supporting reliability, validity and responsiveness [8].
The Asthma Symptom Diary (ASD) was developed to assess severity of asthma symptoms, nocturnal awaken-ings and activity limitations in patients with moderate to severe asthma. The symptom content of the ASD was based on concept elicitation and cognitive interviews in patients with moderate to severe persistent asthma [10]. Previous studies have supported the content validity of the ASD [10] and the psychometric characteristics of the ASD [11]. The ASD has good evidence supporting reli-ability, validity and responsiveness of the average 7-day score. However, the original psychometric evaluation study was conducted in a sample of asthma patients in a 4-week observational study, limiting the evaluation of minimal important differences (MID) and providing no responder definitions, reflecting important changes from the patient’s perspective. The psychometric evaluation of a new measure, such as the ASD, is an ongoing exercise with additional evidence on reliability, validity, and inter-pretation guidelines providing additional confidence in the instrument’s measurement properties. The current psychometric analysis was designed to further confirm the measurement qualities of the ASD using data from a much larger, 24-week clinical trial.
Information on the interpretation and responder defi-nitions of new PRO measures are needed to assist clini-cians, patients and regulatory agencies in understanding
the effectiveness of treatments. For regulatory agencies, such as the FDA and [7]). Evaluation of MID and re-sponder definitions are critical for interpreting the ef-fects of treatment on PRO measures, such as the ASD [4, 12, 23, 24]. The MID is often used for interpreting mean group differences between treatments and reflects the smallest score or change in scores on the PRO meas-ure that would likely be important from the patient’s perspective [12,23]. However, some researchers base re-sponder definitions on the MID.
Responder definitions focus on the individual level and assist in understanding percent of patients benefiting from treatment. One definition of a responder is a pa-tient who has experienced a change that is important to that patient, that is, has experienced the MID. Thus, the change as great or greater than the MID can be selected as the criterion for defining a responder, that is, the MID represents the threshold for response, though in-vestigators may choose other thresholds (e.g. moderate or large responses). Responder definitions are based on a threshold of changes in endpoint scores based on psy-chometric evidence and are defined as a magnitude of change that is considered important to the patient. The patient’s perspective is critical, and meaningful change (or improvement) needs to be determined based on patient input. Responder definitions for interpreting individual patient-level change are normally larger than the MID (for group or individual level interpretation) [13,19]. The US FDA has expressed concern that the MID, as a basis for defining responders, reflects minimal rather than more than minimal levels of change in PRO endpoints.
Both MIDs and responder definitions are based on anchor-based criteria measures [23]. These anchor scores may be patient derived (i.e., patient global assess-ment of change or severity), clinician derived (i.e., clin-ician global rating of change or severity), based on relevant clinical indicators (i.e., hematocrit), or other established PRO endpoints (i.e., Asthma Control Ques-tionnaire; ACQ).
current study, we evaluate changes in mean 7-day ASD scores and in symptomatic and minimal symptom days as potential endpoints for clinical trials comparing asthma treatments. Psychometric criteria are based on the anchor-based and distribution-based analyses, while clinical criteria are related to ensuring that any re-sponder definition reflects the underlying clinical con-text, that is, represents meaningful information from the perspective of both the patient and the clinician.
In the current study, Phase II clinical trial data were analyzed to evaluate the MID and to identify various re-sponder definitions based on the ASD measure in pa-tients with persistent moderate to severe asthma. The main objective was to provide meaningful interpretation guidelines for the ASD with respect to its application in randomized clinical trials comparing asthma treatments.
Methods
Study design and patients
This was a secondary analysis of data collected from a Phase II clinical trial in patients with moderate to severe persistent asthma. The Phase II clinical trial was a randomized, double-blind, placebo-controlled, multiple dose study to evaluate the safety and efficacy of brodalumab in subjects with moderate to severe asthma (NCT01902290). The clinical trial involved 566 subjects with asthma recruited from 147 study centers worldwide. Study subjects were randomized in a 1:1 ratio to brodalumab 210 mg or placebo every two weeks with approximately 283 subjects per treat-ment group. This study enrolled men and women be-tween 18 and 75 years of age, with a diagnosis of asthma, with inadequately controlled asthma (ACQ≥ 1.5 at both screening and baseline), and with a forced expiratory volume in one second (FEV1)≥40% and≤ 80% (at screening and baseline). All subjects needed to be treated with a stable dose of ICS (≥ 200 and≤ 1000/μg/day fluticasone powder or equivalent) and if on a long acting beta-adrenoceptor agonist, must have been on a stable dose. Additionally, subjects must have had≥1, but < 5 exacerbations in the year before screening. Patients were excluded if they had an acute asthma ex-acerbation requiring emergency room treatment with sys-temic corticosteroids or hospitalization within 30 days of screening or any exacerbation between screening and baseline, use of systemic corticosteroids within the period starting 4 weeks before screening, ≥ 5 asthma exacerba-tions in the year prior to screening, history of chronic ob-structive pulmonary disease or other chronic pulmonary condition, or sleep apnea, respiratory infection, any clinic-ally significant and unstable systemic disease, or pregnant or breastfeeding.
Following randomization, subjects received brodalu-mab 210 mg or placebo. The primary endpoint was
change in asthma control (based on the ACQ; [17]) from baseline to week 24, and all subjects were followed for up to 24 weeks. The clinical trial protocol was approved by an Institutional Review Board (Chesapeake Research Review; Pro00007797), and each patient provided writ-ten informed consent before participating in the study. This psychometric analysis was based on pooled and masked PRO and other clinical data from the treatment and placebo groups in the Phase II clinical trial.
Measures
Asthma symptom diary
The ASD was developed to evaluate the severity of asthma-related symptoms, nocturnal awakenings and ac-tivity limitations based on a daily diary which is com-pleted in the morning and evening each day [10, 11]. The ASD contains 10 questions, with 5 questions pleted every morning and another 5 questions com-pleted every evening. The morning diary comprises questions on four asthma-related symptoms (wheezing, shortness of breath, cough, chest tightness), rated using a 5-point severity scale from 0 (no symptom) to 4 (very severe symptoms), and one question on nocturnal awak-enings, rated on a scale from 0 (did not wake up) to 4 (unable to sleep due to asthma). The evening diary has questions on the same four asthma-related symptoms and one question on limitations of activities, rated on a scale from 0 (not at all) to 4 (extremely). The ASD daily score is computed by averaging the responses to the 10 items, and a mean 7-day ASD score is calculated by averaging the 7 daily scores (range 0 to 4). The daily score is not calculated if any item responses are missing. The mean ASD 7-day score is only calculated if at least 4 of 7 ASD daily scores are not missing. The ASD has evidence supporting reliability (internal consistency, test-retest reliability), concurrent and known groups val-idity, and responsiveness [11]. The ASD was collected daily over the course of the clinical trial.
In addition to the average 7-day ASD scores, three other scores were derived from the ASD daily scores based on previous ASD data [11] and clinician review. Definitions of Symptomatic Days and Minimum tom Days were based on daily ASD scores, and Symp-tomatic and Minimal Symptom Days were examined over 7-day time periods. In addition, mean changes in average 7-day ASD scores were also evaluated.
score > 1, and activity limitations or nighttime awakening item scores = 0, otherwise non-Minimal Symptom Day-2).
Asthma control questionnaire
The ACQ is a 7-item disease-specific instrument designed to assess asthma control [17, 18]. Five items assess asthma-related symptoms and activity limitations; one item on FEV1% predicted; and one item on beta-agonist use. All seven items are scored on a 7-point scale, with 0 indicating good control and 6 indicating poor control; the total score is the mean of the seven items. A change of 0.50 points is considered clinically meaningful [18] and a total score of < 1.0 indicates good asthma control [15, 21, 27]. Analyses were completed using the 5-item ACQ total score (which excludes the FEV1 and beta-agonist ques-tions). ACQ-5 was collected at baseline and at every study visit; the baseline, week 12 and week 24 data was used in this analysis.
Patient global assessment (PGA)
The PGA was a single-item patient-rated assessment of disease severity on a scale of 0 (no asthma symptoms) to 5 (very severe). The PGA measures the patient’s asthma disease state at the time of assessment and was mea-sured at every study visit. The PGA response scale was 0 = no asthma, 1 = very mild, 2 = mild, 3 = moderate, 4 = severe, and 5 = very severe.
Statistical analysis
This secondary statistical analysis was based on those pa-tients with complete baseline to 12-week and baseline to 24-week ASD data. All the psychometric data analyses were conducted masked to treatment group, as the focus on this study was the measurement performance of the ASD. No adjustments were made for multiplicity and the nominal p-values < 0.05 were used to evaluate statistical significance.
Descriptive statistics
Demographic and clinical characteristics for the study sample were summarized using descriptive statistics (mean, standard deviation, and range for quantitative vari-ables; frequency, and percentage for categorical variables).
Responsiveness (sensitivity to change)
Ability to detect change is a type of validity in health out-comes measurement and refers to the extent to which the instrument can detect change in the predicted direction when there has been a notable change in patient status [14, 23]. Anchor-based methods are recommended for evaluating MID, and for identifying responder definitions for PRO measures. Distribution-based methods may be helpful in supporting the anchor-based findings. We first examined the correlations between baseline to 12 and 24 weeks changes in ASD scores and changes in
the ACQ and PGA scores using Spearman correla-tions to ensure that the anchors were sufficiently cor-related with the ASD [23].
Analysis of covariance (ANCOVA) was used to exam-ine the difference in the mean change scores of average 7-Day ASD scores from baseline to weeks 12 and 24 between ACQ and PGA defined responder and non-responder groups, controlling for age, gender, FEV1% predicted, and baseline mean 7-Day ASD score. A significant main effect of the overall model atp< 0.05, and a significant post-hoc difference among each pair-wise comparison (p < 0.05) was considered supportive of the responsiveness of the ASD scores. Effect size was also estimated for the ACQ and PGA defined responder and non-responder groups.
Ability of the ASD to detect change was assessed by comparing changes in mean 7-Day Asthma Symptom Diary scores. ASD change scores were evaluated from baseline to weeks 12 and 24 based on the ACQ-5 and PGA responder groups. For the responsiveness analyses, responders and non-responders were defined as follows:
ACQ-5 score: responders were defined as patients with an ACQ-5 change score of≤ −0.5 from base-line to weeks 12 and 24; and non-responders were defined as patients with an increase in ACQ-5 score or a decrease in ACQ-5 score of less than 0.5 from baseline to weeks 12 and 24. Previous research has identified a change of 0.5 in ACQ scores as mean-ingful for patients [18].
ACQ-5 score: responders were defined as patients with an ACQ-5 change score≤ −1.0 from baseline to weeks 12 and 24; and non-responders were de-fined as patients with an increase in ACQ-5 score or a decrease in ACQ-5 score of less than 1.0 from baseline to weeks 12 and 24. This anchor responder definition was used as a more stringent indicator of treatment response based on twice the ACQ MID.
PGA score: responders were defined as patients with a≥1 or more change from baseline to weeks 12 or 24; and non-responders were defined as patients with a < 1 change from baseline to weeks 12 and 24. For the PGA, a one-unit change is the smallest pos-sible improvement (or worsening) that can be ob-served. The one-unit improvement in PGA scores may be considered the MID.
Evaluation of MID and responder definitions
FEV1% predicted, and baseline average 7-Day ASD score. Separate ANCOVA models were conducted for each responder definition based on the ACQ independent variables. A significant main effect of the overall model at p< 0.05, and a significant post-hoc difference among each pairwise comparison (p < 0.05) was considered supportive of the ACQ-based responder definition. The ACQ 0.5 and ACQ 1.0 anchors can be considered reflective of the MID and individual responder definitions, respectively.
In addition, cumulative distribution function (CDF) ana-lysis was conducted based on the three anchor scales and changes in mean 7-day ASD scores, symptomatic days and minimal symptom days [4]. For CDFs, the continuous plot of change from baseline is included on the horizontal axis and the cumulative percentage of patients reporting up to that change is included on the vertical axis.
Results
Sample characteristics
These analyses are based on the 417 (74%) of study par-ticipants with complete baseline and 12-week follow-up ASD data, and complete baseline to 24-week follow-up ASD data (n= 345, 61%). The total sample was 59% fe-male, 81% White, with a mean age of 47.3 (SD = 13.6) years. Mean number of years with asthma was 22.6 (SD = 14.6, range 0.4 to 62 years). For the overall analytic sample, mean baseline 7-day ASD scores were 0.97 (SD = 0.6), and mean baseline ACQ scores were 2.5 (SD = 0.8). Mean baseline Symptomatic Days scores were 3.33 (SD = 3.01), Minimal Symptom Days-1 scores were 3.01 (SD = 2.85), and Minimal Symptom Days-2 scores were 1.43 (SD = 2.27).
Correlations between changes in ASD scores and changes in ACQ and PGA scores
The Spearman correlations between baseline to 12-week changes in ASD scores and baseline to 12-week changes in ACQ and PGA scores were 0.59 and 0.57, respectively. The correlations between baseline to 24-week changes in ASD scores and baseline to 24-week changes in ACQ and PGA scores were 0.67 and 0.53, respectively.
Responsiveness (sensitivity to change)
Mean 7-day ASD scores
The results of the ANCOVA evaluating differences in mean 7-day ASD scores by the ACQ and PGA anchors are summarized in Table1. At week 12, statistically sig-nificant differences were observed in mean 7-day ASD scores based on the ACQ 0.5 (p< 0.001) and ACQ 1.0 (p< 0.001) definitions of responders. For example, based on the ACQ 0.5 responder criteria, responders reported a mean change of −0.49 points compared to −0.05 points for non-responders on the average 7-day ASD (difference 0.43 points; p< 0.001). The baseline to week
12 changes in average 7-day ASD scores were similar for the PGA based responder groups (−0.48 versus -0.07; difference 0.41 points; p < 0.001). Comparable, although somewhat larger differences between ACQ or PGA based responders and non-responders, were seen at week 24 (p < 0.001; Table 1). Effect sizes for the anchor-based responder groups ranged from 0.80 to 1.13 for mean 7-day ASD scores.
ASD-based symptomatic days
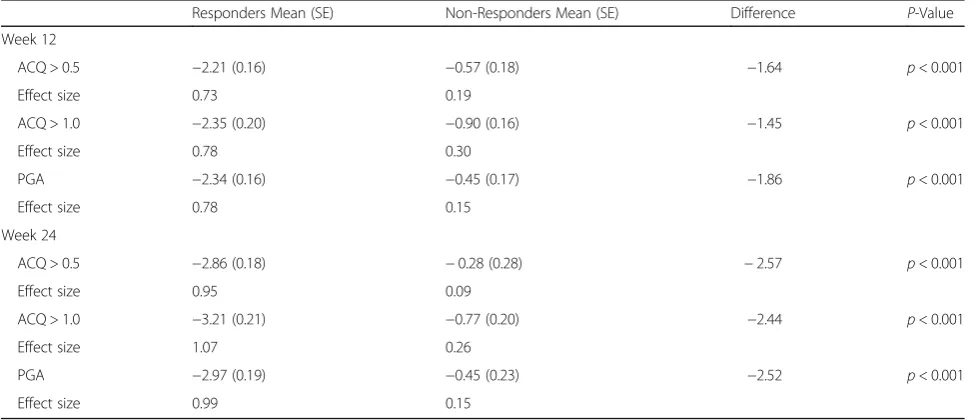
The ANCOVA results evaluating differences in ASD based Symptomatic Days by the ACQ and PGA anchors are summarized in Table2. At week 12, statistically sig-nificant differences were observed in Symptomatic Days based on the ACQ 0.5 responder criteria (p< 0.001) and the ACQ 1.0 responder criteria (p< 0.001). For example, based on the ACQ 0.5 responder criteria, responders re-ported a mean decrease of −2.21 Symptomatic Days compared with −0.57 days for non-responders (differ-ence 1.64 days; p< 0.001). The baseline to week 12 changes in Symptomatic Days were similar for the PGA based responder groups (−2.34 versus −0.45; difference 1.86 days; p < 0.001). Comparable, although larger differ-ences between ACQ or PGA based responders and non-responders, were seen in Symptomatic Days in the week 24 analyses (all p < 0.001; Table 2). Effect sizes for the anchor-based responder groups ranged from 0.73 to 1.07 for Symptomatic Days.
ASD-based minimal symptom days
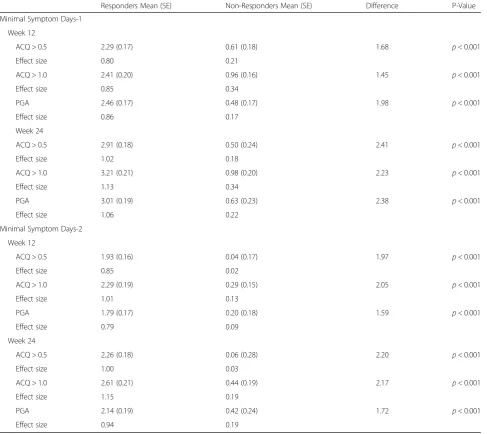
For the first definition of Minimal Symptom Days (i.e., mean of the 10 ASD daily symptom items ≤1 and no single symptom item score > 1), the ANCOVA results evaluating differences in ASD based Minimal Symptom Days by ACQ and PGA-based responders are summarized in Table 3. At week 12, statistically significant differences were observed in Minimal Symptom Days-1 for the ACQ 0.5 responder criteria (p< 0.001) and ACQ 1.0 re-sponder criteria (p < 0.001). Based on the ACQ 0.5 responder criteria, responders reported a mean in-crease of 2.29 Minimal Symptom Days-1 compared with 0.61 days for non-responders (difference 1.68 days; p< 0.001). The baseline to week 12 changes in Minimal Symptom Days-1 were similar for the PGA based responder groups (2.46 versus 0.48; difference 1.98 days; p< 0.001). Comparable, although larger dif-ferences between ACQ or PGA based responders and non-responders, were seen in changes in mean Minimal Symptom Days-1 in the week 24 analyses (all p< 0.001; Table 3).
= 0), the findings of the ANCOVA evaluating differences in ASD based Minimal Symptom Days by ACQ and PGA-based responders are summarized in Table 3. At week 12, statistically significant differences were observed in Minimal Symptom Days-2 for the ACQ 0.5 re-sponder criteria (p< 0.001) and ACQ 1.0 criteria (p< 0.001). Based on the ACQ 0.5 responder criteria, re-sponders reported a mean increase of 1.93 Minimal Symptom Days-2 compared to a decrease of 0.04 days for non-responders (difference 1.97 days; p< 0.001). The baseline to week 12 changes in Minimal Symptom Days-2 were similar for the PGA based re-sponder groups (1.79 versus 0.20; difference 1.59 days; p< 0.001). Comparable, although larger differences
between ACQ or PGA based responders and non-responders, were seen in changes in mean Min-imal Symptom Days-2 in the baseline to week 24 ana-lyses (all p< 0.001; Table 3). Effect sizes for anchor-based responder groups range from 0.80 to 1.13 for Minimal Symptoms Days-1 and 0.79 to 1.15 for Minimal Symptom Days-2.
MID and responder definitions
Mean 7-day ASD scores
The results of the ANCOVA evaluating differences in mean 7-day average ASD scores by the ACQ anchors are summarized in Table 4. The ACQ 0.5 and ACQ 1.0 anchors can be considered reflective of the MID
Table 1Responsiveness of the Average 7-Day ASD Score at Weeks 12 and 24
Responders Mean (SE) Non-Responders Mean (SE) Difference P-Value
Week 12
ACQ > 0.5 −0.49 (0.03) −0.05 (0.03) −0.43 p< 0.001
Effect size 0.82 0.08
ACQ > 1.0 −0.54 (0.03) −0.13 (0.03) −0.42 p< 0.001
Effect size 0.90 0.22
PGA −0.48 (0.03) −0.07 (0.03) −0.41 p< 0.001
Effect size 0.80 0.12
Week 24
ACQ > 0.5 −0.59 (0.03) −0.06 (0.03) −0.53 p< 0.001
Effect size 0.98 0.10
ACQ > 1.0 −0.68 (0.04) −0.15 (0.03) −0.53 p< 0.001
Effect size 1.13 0.25
PGA −0.60 (0.03) −0.10 (0.04) −0.49 p< 0.001
Effect size 1.00 0.17
Table 2Responsiveness of ASD Symptomatic Days in a 7-Day Period at Weeks 12 and 24
Responders Mean (SE) Non-Responders Mean (SE) Difference P-Value
Week 12
ACQ > 0.5 −2.21 (0.16) −0.57 (0.18) −1.64 p< 0.001
Effect size 0.73 0.19
ACQ > 1.0 −2.35 (0.20) −0.90 (0.16) −1.45 p< 0.001
Effect size 0.78 0.30
PGA −2.34 (0.16) −0.45 (0.17) −1.86 p< 0.001
Effect size 0.78 0.15
Week 24
ACQ > 0.5 −2.86 (0.18) −0.28 (0.28) −2.57 p< 0.001
Effect size 0.95 0.09
ACQ > 1.0 −3.21 (0.21) −0.77 (0.20) −2.44 p< 0.001
Effect size 1.07 0.26
PGA −2.97 (0.19) −0.45 (0.23) −2.52 p< 0.001
Effect size 0.99 0.15
and individual responder definitions, respectively. At week 12, statistically significant differences were ob-served in mean 7-day ASD scores based on the ACQ change groups (p< 0.0001). For example, the ACQ 0.5 change group reported a mean change of −0.35 and the ACQ 1.0 change group reported a mean change of− 0.54 points on the average 7-day ASD scores compared with a change on only −0.05 points for the ACQ > 0.5 group (differences all p< 0.01). Comparable differences between ACQ based change groups were observed in average 7-day ASD scores in the week 24 analyses (all p< 0.01; Table 4). Therefore, the MID for mean 7-day ASD scores may be 0.35.
Table 3Responsiveness of ASD Minimal Symptom Days in a 7-Day Period at Weeks 12 and 24
Responders Mean (SE) Non-Responders Mean (SE) Difference P-Value
Minimal Symptom Days-1
Week 12
ACQ > 0.5 2.29 (0.17) 0.61 (0.18) 1.68 p< 0.001
Effect size 0.80 0.21
ACQ > 1.0 2.41 (0.20) 0.96 (0.16) 1.45 p< 0.001
Effect size 0.85 0.34
PGA 2.46 (0.17) 0.48 (0.17) 1.98 p< 0.001
Effect size 0.86 0.17
Week 24
ACQ > 0.5 2.91 (0.18) 0.50 (0.24) 2.41 p< 0.001
Effect size 1.02 0.18
ACQ > 1.0 3.21 (0.21) 0.98 (0.20) 2.23 p< 0.001
Effect size 1.13 0.34
PGA 3.01 (0.19) 0.63 (0.23) 2.38 p< 0.001
Effect size 1.06 0.22
Minimal Symptom Days-2
Week 12
ACQ > 0.5 1.93 (0.16) 0.04 (0.17) 1.97 p< 0.001
Effect size 0.85 0.02
ACQ > 1.0 2.29 (0.19) 0.29 (0.15) 2.05 p< 0.001
Effect size 1.01 0.13
PGA 1.79 (0.17) 0.20 (0.18) 1.59 p< 0.001
Effect size 0.79 0.09
Week 24
ACQ > 0.5 2.26 (0.18) 0.06 (0.28) 2.20 p< 0.001
Effect size 1.00 0.03
ACQ > 1.0 2.61 (0.21) 0.44 (0.19) 2.17 p< 0.001
Effect size 1.15 0.19
PGA 2.14 (0.19) 0.42 (0.24) 1.72 p< 0.001
Effect size 0.94 0.19
Minimal Symptom Days-1 defined as mean of the 10 ASD daily symptom items≤1 and no single symptom item score > 1
Minimal Symptom Days-2 defined as no single ASD daily symptom item score > 1, and activity limitations or nighttime awakening item scores = 0
Table 4Changes in Average 7-Day ASD Score by ACQ Change Groups at Weeks 12 and 24
ACQ Group Week 12 Week 24
1 Change≤ −1.0 [Responder] −0.54 −0.68
2 Change−0.5 to−1.0 [MID] −0.35 −0.35
3 Change≥ −0.5 −0.05 −0.05
Model p-value < 0.0001 < 0.0001
ASD-based symptomatic days
The results of the ANCOVA evaluating differences in mean 7-day average ASD scores by the ACQ anchors are summarized in Table5. At week 12, statistically sig-nificant differences were observed in changes in ASD Symptomatic Days based on the ACQ change groups (p< 0.0001). For example, the ACQ 0.5 change group reported a mean change of −1.75 (i.e., MID) and the ACQ 1.0 change group reported a mean change of − 2.34 points in ASD Symptomatic Days compared with a change of only −0.61 days for the ACQ > 0.5 group (differences all p< 0.01). Comparable, although some-what larger, differences between ACQ based change groups were seen in changes in ASD Symptomatic Days in the week 24 analyses (all p< 0.01; Table 5).
ASD-based minimal symptom days
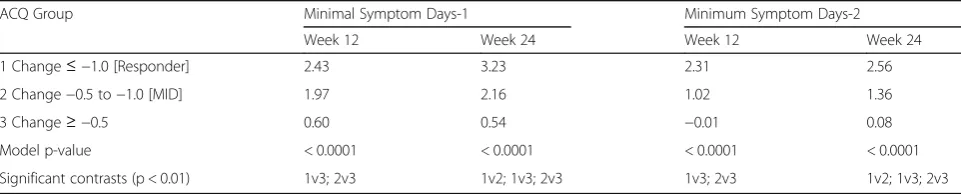
For the first definition of Minimal Symptom days (i.e., mean of the 10 ASD daily symptom items ≤1 and no single symptom item score > 1), the ANCOVA results evaluating differences in Minimal Symptom Days by ACQ-based change groups are summarized in Table 6. At week 12, statistically significant differences were ob-served in Minimal Symptom Days-1 for the ACQ 0.5 change group (p< 0.01) and ACQ 1.0 change group (p< 0.01), compared to the ACQ > 0.5 change group. The ACQ 0.5 change group reported a mean increase of 1.97 Minimal Symptom Days-1 compared with an increase of 0.6 days for no change group (difference 1.37 days; p< 0.01). Comparable, although larger, differences between
ACQ based change groups were seen in changes in mean Minimal Symptom Days-1 in the week 24 analyses (allp< 0.01; Table6).
For the second definition of Minimal Symptom Days (i.e., no single ASD daily symptom item score > 1, and activity limitations or nighttime awakening item scores = 0), the findings of the ANCOVA evaluating changes in ASD based Minimal Symptom Days by ACQ-based responders are summarized in Table6.
At week 12, statistically significant differences were observed in Minimal Symptom Days-2 for the ACQ 0.5 responder criteria (p< 0.01) and ACQ 1.0 change groups (p< 0.01). Those patients in the ACQ 0.5 change group reported a mean increase of 1.02 Minimal Symptom Days-2 compared to a decrease of 0.01 days for those in the ACQ > 0.5 change group (difference 1.01 days; p< 0.01). Comparable, although slightly larger, differences between ACQ change groups were seen in changes in Minimal Symptom Days-2 in the baseline to week 24 analyses (allp< 0.01; Table6).
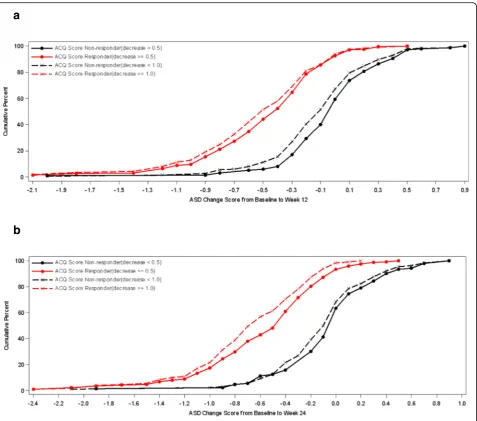
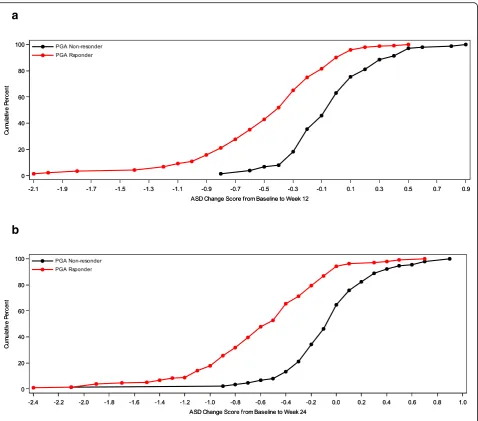
Cumulative distribution functions
Cumulative distribution function (CDF) analyses were conducted for 7-Day Average ASD scores, Symptomatic Days, and the two definitions of Minimal Symptom Days based on ACQ criteria of ≥0.5 improvements and based on PGA improvements of 1 or more at weeks 12 and 24. For 7-Day Average ASD scores, CDF results are dis-played for the ACQ criteria and for the PGA criteria (see Figs 1 and 2). Clearly, there is discrimination in ASD scores across most of the distribution of changes for baseline to week 12 and baseline to week 24. Based on the CDF results, the responders demonstrated a de-crease of 0.40 to 0.50 points in 7-Day Average ASD scores, while non-responders showed only a zero to 0.05-point change.
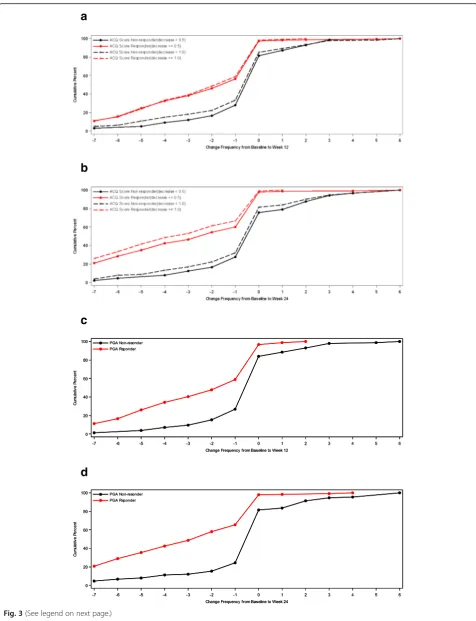
For ASD-based Symptomatic Days, CDF results are sum-marized for the ACQ-based criteria and for the PGA-based criteria (see Fig. 3). Clearly, there is significant discrimin-ation in Symptomatic Days for most of the distribution of changes for baseline to week 12 and baseline to week 24.
Table 5Changes in ASD Symptomatic Days in a 7-Day Period by ACQ Change Groups at Weeks 12 and 24
ACQ Group Week 12 Week 24
1 Change≤ −1.0 [Responder] −2.34 −3.22
2 Change−0.5 to−1.0 [MID] −1.75 −1.98
3 Change≥ −0.5 −0.61 −0.35
Modelp-value < 0.0001 < 0.0001
Significant contrasts (p < 0.01) 1v3; 2v3 1v2; 1v3; 2v3
Table 6Changes in ASD Minimal Symptom Days in a 7-Day Period by ACQ Change Groups at Weeks 12 and 24
ACQ Group Minimal Symptom Days-1 Minimum Symptom Days-2
Week 12 Week 24 Week 12 Week 24
1 Change≤ −1.0 [Responder] 2.43 3.23 2.31 2.56
2 Change−0.5 to−1.0 [MID] 1.97 2.16 1.02 1.36
3 Change≥ −0.5 0.60 0.54 −0.01 0.08
Model p-value < 0.0001 < 0.0001 < 0.0001 < 0.0001
Significant contrasts (p < 0.01) 1v3; 2v3 1v2; 1v3; 2v3 1v3; 2v3 1v2; 1v3; 2v3
Minimal Symptom Days-1 defined as mean of the 10 ASD daily symptom items≤1 and no single symptom item score > 1
Based on the CDF results, the responders demonstrated a decrease of 1.0 to 2.2 Symptomatic Days (over a 7-day period), while non-responders demonstrated only a 0.4 to 0.5- day decrease.
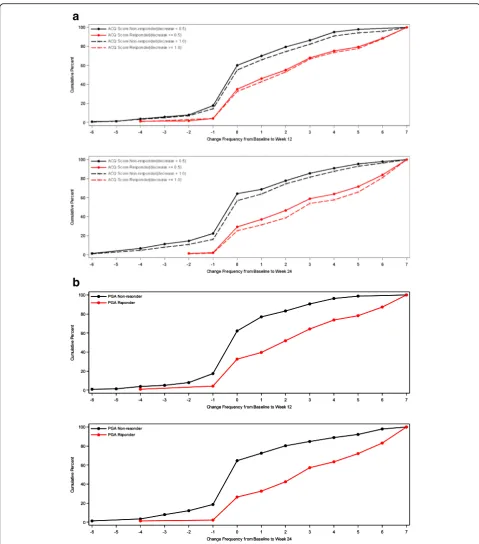
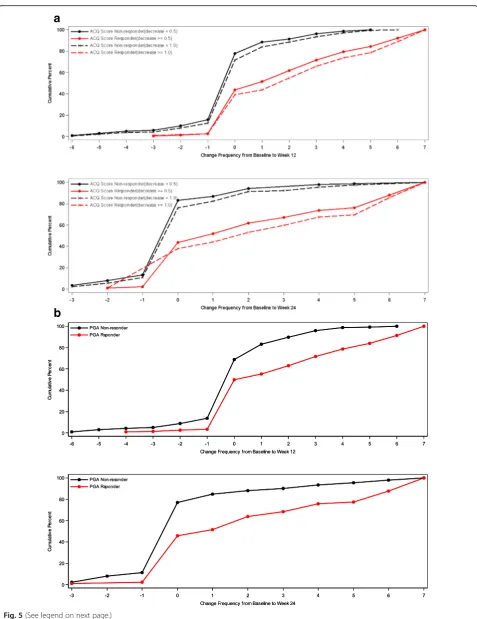
For ASD-based Minimal Symptom Days, CDF results are summarized for the ACQ-based responder criteria and the PGA-based responder criteria (see Figs.4 and5). There is significant discrimination in the distribution of changes from baseline to week 12 and baseline to week 24 Minimal Symptom Days. For Minimal Symptom Days-1 (Figs.4a and b), based on the CDF findings, the responders demonstrated an increase of approximately 1.0 day (over a 7-day period), while non-responders demonstrated only a 0.2 to 0.5-day decrease. Somewhat larger effects were ob-served for Minimal Symptom Days-2 (Figs.5a and b), with
responders demonstrating an increase of 1.7 to 2.6 days (during a 7-day period),while non-responders demonstrated only a 0.2 to 0.4-day decrease.
Discussion
The ASD was developed to evaluate daytime and night-time asthma symptom outcomes for clinical trials, and has evidence supporting content validity and good measure-ment properties [10, 11]. Extensive patient engagement and clinician review and input provided the basis for the development of the ASD. Previous research has demon-strated that the ASD has good evidence supporting reli-ability and validity, and provides preliminary evidence supporting responsiveness [11]. The current secondary analysis utilizes Phase II clinical trial data to evaluate
a
b
the sensitivity to change of the ASD, and evaluates sev-eral ASD-based responder endpoint definitions. Defini-tions of days with asthma symptoms and days with minimal asthma symptoms were developed to evaluate treatments for asthma and were evaluated in this study.
These analyses further confirm the responsiveness of the ASD scores. The 7-day average asthma symptom scores demonstrated significant differences between re-sponders and non-rere-sponders based on ACQ- and PGA-derived anchors. Consistently, anchor-based meas-ure responders reported changes of between 0.48 to 0.54 points after 12 weeks of treatment, and 0.59 to 0.68 points after 24 weeks of treatment. Non-responders re-ported changes of only 0.05 to 0.13 points in ASD 7-day average scores after 12 weeks, and 0.06 to 0.15 points
after 24 weeks of treatment. The magnitude of these sta-tistically significant effects were large, with effect sizes of 0.80 to 0.90 and 0.98 to 1.13 at 12 and 24 weeks, respect-ively. These changes in 7-day mean ASD scores were seen regardless of using an ACQ or PGA defined an-chor. The current study observed changes in 7-day mean ASD scores are consistent with the changes seen for non-responders (0.0 to−0.1), but were somewhat larger than responders (−0.2 to −0.3) in the Globe et al. [11] study. These differences may be attributable to the ab-sence of an asthma severity inclusion criteria and rela-tively short follow-up (i.e., 4 weeks) in the Globe et al. [11] study. The intent for the Globe et al. [11] study was to recruit across severity levels consistent with [9] guidelines.
a
b
a
b
c
d
For ASD symptomatic days, responsiveness was dem-onstrated for both the ACQ defined and PGA defined anchors after 12 and 24 weeks of treatment. The study findings showed decreases in 2.2 to 2.4 symptomatic days after 12 weeks of treatment, and decreases of 2.9 to 3.2 symptomatic days were observed after 24 weeks of treatment for the ACQ and PGA defined anchors. This observed magnitude of change in number of symptom-atic days is substantial, and likely reflects important im-provements in asthma-related outcomes for patients with moderate to severe asthma. The effect sizes ranged from 0.73 to 1.07. The results suggest that a reduction of 2 to 3 symptomatic days may be important in moder-ate to severe asthma patients.
As expected, the findings for ASD defined minimal symptom days, also mirrored the effects for ASD based symptomatic days. For example, for ASD Minimal Symptom Days-1, improvements of 2.3 to 2.5 days were seen after 12 weeks of treatment, and 2.9 to 3.2 days after 24 weeks of treatment. The Minimal Symptoms Days-2 version also showed comparable, but slightly at-tenuated effects at 12 and 24 weeks. Based on these study results, we recommend that minimal symptom days are defined, based on the first version, as the mean of the ASD daily symptoms less than or equal to 1 with no single symptom item score with a response greater than 1. Both definitions of minimal symptom days dem-onstrated good responsiveness and differentiation across different anchors, however, reductions in symptomatic days is recommended as a clinical trial endpoint as this outcome may resonate more with clinicians and may better reflect outcomes important to patients.
For patient-reported outcomes, guidelines are neces-sary for interpreting changes in outcomes either for ap-plications in clinical trials comparing treatment and for clinical practice settings. For the FDA and other regula-tory agencies, their main concern relates to identifying clinical differences that are greater than minimal and that are important to patients, therefore the responder thresholds were based on PGA score changes of greater than or equal to 1 and ACQ scores of 1.0 or greater. For ASD 7-day average scores, responders may be defined as those patients who report improvements of 0.50 to 0.60 points, based on the results of this study. The patient’s perspective is important for understanding meaningful outcomes, and the two patient-reported anchors used in this study are relevant for identifying responders. Al-though distribution-based methods may provide insight
as to the magnitude of change, they do not provide in-formation as to what level of change is important to pa-tients and clinicians [23]. Clearly, treatment effects in this range of magnitude of change are likely to be import-ant to patients with moderate to severe persistent asthma and clinically important to their clinicians when evaluating treatment effects. The MID for the ASD 7-day average scores were estimated at 0.35, which reflects a 0.58 effect size, and may be considered moderate.
For the ASD defined symptomatic days, decreases of 2 to 3 days are important to patients with moderate to se-vere asthma. Decreases as small as 1.75 symptomatic days may also be considered meaningful outcomes from a patient’s perspective. Responder definitions based on this magnitude of change are likely to differentiate highly effective from less effective treatments for asthma. Fu-ture research is needed to further confirm this responder definition for asthma symptomatic days. Based on the range of asthma-specific anchors included in this study and the CDF analyses, however, these findings are likely to be confirmed with future research.
Similar responder criteria can be derived for different versions of minimal symptom days based on the ASD. Clearly, as expected, minimal symptom days represent the reverse reflection of asthma symptom days. As with the ASD defined symptomatic days, increases of 2 to 3 days with minimal asthma symptoms are likely meaning-ful for moderate to severe asthma patients and their cli-nicians. An improvement of two days per week in minimal symptom days may represent an acceptable cri-terion for defining responders in clinical trials compar-ing treatments of moderate to severe persistent asthma. However, smaller improvements may also reflect import-ant changes. Future research is needed to further con-firm these findings, but given the range of asthma related anchors and various analyses, these results are likely to be confirmed as the results are consistent irre-spective of method used.
There are significant challenges in defining re-sponders, based on the magnitude of change consid-ered important by patients, and in evaluating the statistical significance of within-patient changes [13,
19]. Although some researchers apply the MID as the threshold for identifying individual patient responders, higher thresholds of often necessary for defining within-patient responders, given the variability and less reliability in individual patient scores compared to group mean scores. Hays et al. [13] have examined (See figure on previous page.)
the reliable change index and standard error of meas-urement for understanding individual patient level changes in health-related quality of life, while Kemm-ler et al. [19] combine both clinical relevance and
statistical significance in evaluating within-patients changes in patient reported outcomes.
Several limitations should be acknowledged related to interpreting the findings of this study. First, the analyses
a
b
a
b
were based on a clinical trial sample, and any demo-graphic or clinical differences of the clinical trial sample and the asthma general population may impact on the generalizability of these results. However, the analysis of sensitivity to change from a clinical trial sample has cer-tain advantages, since there will likely be some patients who improve, remain stable and worsen over the course of the study [23]. Second, the anchors used to evaluate responsiveness and responder definitions are derived from patient reports and may be associated with some measurement bias. Given that the ASD is a PRO meas-ure, the perspective of patients is most important in examining sensitivity to change in clinical status and for understanding the importance of these changes. Finally, multiplicity of statistical tests may be an issue, however, the consistency of findings across different anchors obvi-ates concern associated with multiple statistical tests.
Conclusion
Interpretation guidelines based on the MID estimates can be used to evaluate clinical significance of mean dif-ferences in ASD scores and for determining sample size estimates for clinical trials. The identification of re-sponder definitions and interpretation guidelines pro-vides further insight into individual level treatment benefits. The findings of this study indicate that the ASD is a good symptom assessment tool for asthma clinical trials in patients with moderate to severe persist-ent asthma. Several responder definitions, based on to the ASD to define symptomatic and minimal symptom days, may be useful in evaluating treatment effects at the individual patient level in clinical trials.
Abbreviations
ACQ:Asthma Control Questionnaire; ANCOVA: Analysis of covariance; ASD: Asthma Symptom Diary; CDF: Cumulative distribution function; EMA: European Medicines Agency; FDA: Food and Drug Administration; FEV1: Forced expiratory volume in one second; HRQL: Health-related quality of life; MID: Minimal important differences; PGA: Patient Global Assessment; PRO: Patient reported outcome
Acknowledgments
At the time this work was conducted, MM and IW were employees of Evidera. We thank Diane Whalley, PhD for her meticulous review and extremely helpful feedback during the final editing of the manuscript.
Funding
This study was funded by Amgen Inc.
Availability of data and materials
The datasets generated and/or analyzed during the current study are not publicly available as they are owned by Amgen Inc., but are available from the corresponding author on reasonable request.
Authors’contributions
GG, MM, IW and DAR conceptualized and designed the study and all authors provided critical comment on the study plan. HZ performed statistical analyses and GG and DAR analyzed and interpreted the outputs and made
recommendations for iterative rounds of analyses. GG and DAR developed the initial manuscript and all authors provided critical review of drafts and approved the final manuscript.
Ethics approval and consent to participate
The clinical trial protocol was approved by an Institutional Review Board (Chesapeake Research Review; Pro00007797), and each patient provided written informed consent before participating in the study.
Consent for publication Not applicable.
Competing interests
DAR and IW are employees of Evidera. Evidera received funding from Amgen Inc. for the conduct of this study and for the preparation of the manuscript. DAR has research grants with and receives consulting fees from Amgen Inc., Allergan, GlaxoSmithKline, Abbvie, and Takeda.
GG and HZ are employees and shareholders of Amgen Inc.
MM is currently an employee of the PRO Consortium (formerly was employed by Evidera).
Publisher’s Note
Springer Nature remains neutral with regard to jurisdictional claims in published maps and institutional affiliations.
Author details 1
Amgen, Thousand Oaks, CA, USA.2Gothenburg University, Gothenburg, Sweden.3Patient Reported Outcome Consortium, Critical Path Institute, Tucson, AZ, USA.4Patient-Centered Research, Evidera, Bethesda, MD, USA.
Received: 11 October 2018 Accepted: 12 March 2019
References
1. Akinbami, L. J., Moorman, J. E., & Liu, X. (2011). Asthma prevalence, health care use, and mortality: United States, 2005-2009.National Health Stat Report, 1–14. 2. Braido, F., Brusselle, G., Guastalla, D., Ingrassia, E., Nicolini, G., Price, D., et al.
(2016). Determinants and impact of suboptimal asthma control in Europe: The international cross-sectional and longitudinal assessment on asthma control (LIAISON) study.Respir Res, 17, 51.
3. Busse, W. W., Morgan, W. J., Taggart, V., & Togias, A. (2012). Asthma outcomes workshop: Overview.J Allergy Clin Immunol, 129, S1–S8. 4. Cappelleri, J. C., Zou, K. H., Bushmakin, A. G., Alvir, J. M. J., Alemayehu, D., &
Symonds, T. (2014).Patient-reported outcomes: Measurement, implementation and interpretation. Boca Raton: Chapman & Hall/CRC Biostatistics Series. 5. Centers for Disease Control, Asthmas Surveillance Data, March 2016 (2016).
www.cdc.gov/asthma/asthmadata. Accessed June 29, 2016.
6. Chen, H., Gould, M. K., Blanc, P. D., Miller, D. P., Kamath, T. V., Lee, J. H., & Sullivan, S. D. (2007). Asthma control, severity, and quality of life: Quantifying the effect of uncontrolled disease.J Allergy Clin Immunol, 120(2), 396–402. 7. European Medicines Agency, Committee for Medicinal Products for Human
Use (2005) Reflection paper on the regulatory guidance for the use of health-related quality of life (HRQL) measures in the evaluation of medicinal products.http://www.ema.europa.eu/docs/en_GB/document_library/ Scientific_guideline/2009/09/ WC500003637.pdf. Accessed October 31, 2017. 8. Food and Drug Administration. (2009). Guidance for industry on
patient-reported outcome measures: Use in medical product development to support labeling claims.Fed Regist, 74(235), 65132–65133.
(See figure on previous page.)
9. Global strategy for asthma management and prevention (2016).www. ginasthma.org. Accessed 28 June 2016.
10. Globe, G., Martin, M., Schatz, M., Wiklund, I., Lin, J., von Maltzahn, R., et al. (2015). Symptoms and markers of symptom severity in asthma-content validity of the asthma symptom diary.Health Qual Life Outcomes, 13, 21.
11. Globe, G., Wiklund, I., Lin, J., Chen, W. H., Martin, M., Mattera, M., von Maltzahn, R., Feng, J. Y., Chon, Y., Viswanathan, H. N., & Schatz, M. (2016). Psychometric properties of the asthma symptom scale (ASD), a diary for use in clinical trials of persistent asthma.J Allergy Clin Immunol Prat, 4(1), 60–66. 12. Guyatt, G., Osoba, D., Wu, A. W., Wyrwich, K. W., & Norman, G. R. (2002).
Methods to explain the clinical significance of health status measures.Mayo Clin Proc, 77, 371e83.
13. Hays, R., Brodsky, M., & Johnston, M. F. (2005). Evaluating the statistical significance of health-related quality-of-life change in individual patients. Eval Health Profess, 28, 160–171.
14. Hays, R., & Revicki, D. (2005). Reliability and validity (including responsiveness). In P. Fayers & R. Hays (Eds.),Assessing quality of life in clinical trials(2nd ed., pp. 25–39). Oxford: Oxford University Press. 15. Juniper, E. F., Bousquet, J., Abetz, L., & Bateman, E. D. (2006). Identifying
‘well-controlled’and‘not well-controlled’asthma using the asthma control questionnaire.Respir Med, 100(4), 616–621.
16. Juniper, E. F., O'Byrne, P. M., Ferrie, P. J., King, D. R., & Roberts, J. N. (2000). Measuring asthma control. Clinic questionnaire or daily diary?Am J Respir Crit Care Med, 162(4 Pt 1), 1330–1334.
17. Juniper, E. F., O'Byrne, P. M., Guyatt, G. H., Ferrie, P. J., & King, D. R. (1999). Development and validation of a questionnaire to measure asthma control. Eur Respir J, 14(4), 902–907.
18. Juniper, E. F., Svensson, K., Mork, A. C., & Stahl, E. (2005). Measurement properties and interpretation of three shortened versions of the asthma control questionnaire.Respir Med, 99(5), 553–558.
19. Kemmler, G., Zabernigg, A., Gattringer, K., Rumpold, G., Giesinger, J., Sperner-Unterweger, B., & Holzner, B. (2010). A new approach to combining clinical relevance and statistical significance for evaluation of quality of life changes in the individual patients.J Clin Epidemiol, 63, 171–179.
20. Mocarski, M., Gater, A., Fleming, S., Nelson, L., & Coons, S. J. (2014). Development of the initial version of the asthma daily symptom diary. San Diego: Annual Meeting of the American Thoracic Society May 2014. 21. Olaguibel, J. M., Quirce, S., Juliá, B., Fernández, C., Fortuna, A. M., Molina, J., &
Plaza, V. (2012). Measurement of asthma control according to global initiative for asthma guidelines: A comparison with the asthma control questionnaire.Respire Res, 22, 13–50.
22. Reddel, H. K., Taylor, D. R., Bateman, E. D., Boulet, L. P., Boushey, H. A., Busse, W. W., et al. (2009). An official American Thoracic Society/European Respiratory Society statement: Asthma control and exacerbations: Standardizing endpoints for clinical asthma trials and clinical practice.Am J Respir Crit Care Med, 180, 59–99.
23. Revicki, D. A., Hays, R., Cella, D., & Sloan, J. (2008). Recommended methods for determining responsiveness and minimally important differences for patient-reported outcomes.J Clin Epidemiology, 61(2), 102–109.
24. Revicki, D. A., Osoba, D., Fairclough, D., Barofsky, I., Berzon, R., Leidy, N. K., & Rothman, M. (2000). Recommendations on health-related quality of life research to support labeling and promotional claims in the United States. Qual Life Res, 9(8), 887–900.
25. Revicki, D. A., & Weiss, K. B. (2006). Clinical assessment of asthma symptom control: Review of current assessment instruments.J Asthma, 43(7), 481–487.
26. Santanello, N., Davies, G., Galant, S. P., Pedinoff, A., et al. (1999). Validation of an asthma symptom diary for interventional studies.Arch Dis Child, 80(5), 414–420. 27. Sastre, J., Olaguibel, J., Vega, J. M., Del Pozo, V., Oicado, C., & Lopez Vina, A.
(2010). Cut-off points for defining asthma control in three versions of the asthma control questionnaire.J Asthma, 47(8), 865–870.
28. Sullivan, P. W., Smith, K. L., Ghushchyan, V. H., Globe, D. R., Lin, S. L., & Globe, G. (2013). Asthma in USA: Its impact on health-related quality of life.J Asthma, 50(8), 891–899.
29. Taylor, D. R., Bateman, E. D., Boulet, L. P., Boushey, H. A., Busse, W. W., Casale, T. B., et al. (2008). A new perspective on concepts of asthma severity and control.Eur Respir J, 32, 545–554.
30. Williams, S. A., Wagner, S., Kannan, H., & Bolge, S. C. (2009). The association between asthma control and health care utilization, work productivity loss and health-related quality of life.J Occup Environ Med, 51, 780–785.