O R I G I N A L C O N T R I B U T I O N
Open Access
Timing and effect of a safe routes to school
program on child pedestrian injury risk during
school travel hours: Bayesian changepoint and
difference-in-differences analysis
Charles DiMaggio
1*, Qixuan Chen
2, Peter A Muennig
3and Guohua Li
1Abstract
Background:In 2005, the US Congress allocated $612 million for a national Safe Routes to School (SRTS) program to encourage walking and bicycling to schools. We evaluated the effectiveness of a SRTS in controlling pedestrian injuries among school-age children.
Methods:Bayesian changepoint analysis was applied to model the quarterly counts of pedestrian injuries among 5- to 19-year old children in New York City between 2001 and 2010 during school-travel hours in census tracts with and without SRTS. Overdispersed Poisson model was used to estimate difference-in-differences in injury risk between census tracts with and without SRTS following the changepoint.
Results:In SRTS-intervention census tracts, a change point in the quarterly counts of injuries was identified in the second quarter of 2008, which was consistent with the timing of the implementation of SRTS interventions. In census tracts with SRTS interventions, the estimated quarterly rates of pedestrian injury per 10,000 population among school-age children during school-travel hours were 3.47 (95% Credible Interval [CrI] 2.67, 4.39) prior to the changepoint, and 0.74 (95% CrI 0.30, 1.50) after the changepoint. There was no change in the average number of quarterly injuries in non-SRTS census tracts. Overdispersed Poisson modeling revealed that SRTS implementation was associated with a 44% reduction (95% Confidence Interval [CI] 87% decrease to 130% increase) in school-age pedestrian injury risk during school-travel hours. Conclusions:Bayesian changepoint analysis of quarterly counts of school-age pedestrian injuries successfully identified the timing of SRTS intervention in New York City. Implementation of the SRTS program in New York City appears to be effective in reducing school-age pedestrian injuries during school-travel hours.
Keywords:Pediatric; Pedestrian; Injury; School travel; Changepoint; Bayesian
1 Background
In 2005, to help address the health and societal conse-quences of the decline in walking and bicycling to school, the US Congress created the federal Safe Routes to School (SRTS) program as part of the federal Safe,
Accountable, Flexible and Efficient Transportation
Equity Act (SAFETEA). The program allocated $612 million dollars for fiscal years 2005 to 2009 for state
departments of transportation to build sidewalks, bicycle lanes, safe crossings, improve signage and make other improvements to the built environment to allow chil-dren to more safely travel to school (Safe Routes to School National Partnership 2012). As of 2010, depart-ments of transportation in all 50 states had introduced safety improvements at 10,400 of the nation’s 98,706 elementary and secondary schools. Interventions consist primarily of sidewalk improvements (19%), traffic calm-ing (14%), pedestrian/bicycle access (14%), and education (14%). The distribution of projects mirrored the popula-tion density of school-age children across the United States (National Center for Safe Routes to School 2012). * Correspondence:[email protected]
1
Columbia University College of Physicians and Surgeons Department of Anesthesiology; Mailman School of Public Health Department of Epidemiology; Center for Injury Epidemiology and Prevention, Columbia University Medical Center, 622 West 168 Street, New York, NY 10032, USA Full list of author information is available at the end of the article
New York State received $31 million dollars from the 2005 SAFETEA SRTS federal budget allocation of which $10,298,000 was allocated to New York City (National Center for Safe Routes to School 2013). As part of this funding, the New York City Department of Transportation introduced safety improvements at 124 schools with the highest injury rates. The work included traffic calming measures like narrowing roads, new traffic and pedestrian signals, the addition of timed crossings that allow pedes-trians to cross before cars, speed bumps, speed boards (radar-equipped digital signs that tell drivers how fast they are moving), high visibility crosswalks and new parking regulations. These changes reduce pedestrian injuries by slowing traffic, ceding rights to pedestrians, and providing disincentives for driving. As of 2009, the New York City Department of Transportation reported that “100% of the short-term safety improvements … are complete”, and that additional longer term capital improvements had advanced far enough for the department of trans-portation to propose expanding the program to an add-itional group of approximately 100 schools (New York City Department of Transportation 2012).
A number of studies have demonstrated the impact of SRTS programs on children’s physical activity, such as walking and biking to school, but less is known about the effectiveness of the SRTS program in reducing ped-estrian injury risk in school-age children (Cradock et al. 2012; Chriqui et al. 2012; Levin Martin et al. 2009). In a previous analysis of an SRTS program in New York City, we demonstrated the association of SRTS interventions with decreased pediatric pedestrian injury risk (DiMaggio and Li 2013). In this paper, we present a Bayesian change-point approach to more precisely determine if and when the change in risk was associated with the timing of the program, and measure the extent to which the post-changepoint risk declined in SRTS compared to non-SRTS areas.
2 Methods
2.1 Data sources
Motor-vehicle crash data were obtained from the New York City Department of Transportation. The data were based on police investigations for all crashes in New York City involving “death, personal injury or property
damage to any one person in excess of $1,000” for
the years 2001 to 2010. The data were entered by an investigating law enforcement officer onto a form (MV104AN) and abstracted into a Microsoft Access database by personnel of the New York City Depart-ment of Transportation.
Both pedestrians and bicyclists were included in the analysis, though only 0.7% of crashes were coded as bicyclists. School-age children were defined as those 5 to 19 years old at the time of injury as listed on the crash
report. The data were read into the R statistical analysis program (R Development Core Team 2011), and evalu-ated for outliers, inconsistent values and missing entries.
Date and time variables were translated into Portable Operating System Interface (POSIX) time objects to ex-tract variables for year, month, day and hour. A school-time indicator variable was created to identify crashes that occurred during days and hours when school-age children would be expected to be traveling to or from school, defined as 7 AM to 9 AM or 2 PM to 4 PM, Monday to Friday between September and June. A geo-graphic variable was created using crash latitude and lon-gitude coordinates, and were assigned to census tracts using the R maptools package (Lewin-Koh Roger 2012).
The SRTS school location data were similarly obtained from the New York City Department of Transportation, and consisted of ArcGIS (ESRI, Redlands, California, USA) files for 124 New York City schools selected by the Department of Transportation for SRTS interven-tions. These schools, chosen from among the city's 1,471 schools, had the highest rates of pedestrian injury. The New York City Department of Transportation developed a ranking system to prioritize schools for SRTS interven-tions based on school-age pedestrian crash counts and in-jury severity within a 700-foot radius of geocoded school locations for the three-year period 1998–2000. A detailed description is available (The RBA Group Urbitran Associ-ates, Inc 2013). By 2009, 12 schools had completed short-term intervention measures such as new crosswalk markings, and replaced or improved signage and had completed capital construction projects; 18 schools had completed short-term interventions and had capital con-struction under way; and 94 schools had either started or planned to start interventions, but had not yet started capital construction.
The 12 schools that had completed both short-term measures and capital construction by 2009 and the 18 schools that had completed short-term interventions and had capital construction projects ongoing by 2009 were combined into a group of 30 SRTS intervention schools located within 30 census tracts. For comparison, the non-intervention census tracts were defined as those containing schools that were not included as one of the 124 SRTS schools. While the implemented interventions differed somewhat from one census tract to the other, our goal was to measure the net effect across interven-tions rather than the efficacy of any given measure.
for sensitivity analysis of the overdispersed Poisson difference-in-differences model. Population data were based on age-stratified United States Census files from both the 2000 and 2010 decennial census at the census tract level (US Census Bureau 2010). The population count at the census tract level was extrapolated over the intervening decade using linear interpolation. Counts of pedestrian crashes involving school-age children during school-travel hours were aggregated by year and quarter and stratified by intervention vs. non-intervention census tracts.
2.2 Bayesian changepoint model
In a Bayesian approach, we base our conclusions about the probability of a value for a parameter given our data, Pr(θ|y), on a combination of our prior expectation for the value of that parameter, expressed as the probability of observing the parameter Pr(θ), and the likelihood of observing the data we have collected, Pr(y|θ) given that parameter:
PrðθjyÞ∝Pr yð jθÞ Prð Þθ ;
For a changepoint problem, we are interested in esti-mating the time point in which a change occurred in a time series, conditioned on the data we have observed (Albert 2008). We assume that at some critical‘ change-point’, t =τ, during our 10 years of observation, the rate of school-travel pediatric pedestrian crashes changed.
The data series in this study wereytand Ot, the quar-terly count of school-age, school-hour pedestrian injuries and population offset at time period t. The data were assumed to be Poisson distributed and were modeled using Model (1) for census tracts with SRTS interven-tion and using Model (2) for census tracts without SRTS intervention:
ytePoi μt ;
log μt ¼β0þβ1tþβ2δðt–τÞ þβ3δðt–τÞðt–τÞ þlog Oð Þt ; ð1Þ
logð Þ ¼μt β0þβ2δðt–τÞ þ log Oð Þt ; ð2Þ
t¼1;…;40:
A binary 1/0 changepoint function, δ, is defined as 1 only if its argument is non-negative (t≥τ). Model (1) as-sumes that both the intercept and the slope of the Pois-son model changed post τ, while Model (2) assumes no time effect (β1 =β3 = 0) except the difference in the mean injury rate pre- and post-change. Model (2) is a special case of Model (1) withβ1=β3= 0 and was fitted in the non-SRTS group because convergence could not be achieved using Model (1) and a linear time effect was not observed in this group. Completing the model
description,β0is the pre-change intercept,β1is the pre-change slope, β0+β2 is the post-change intercept, and
β1+β3 is the post-change slope. Working on the log scale, prior to t =τ the log mean injury rate at time t is equal toβ0+β1t andβ0, for census tracts with and with-out SRTS interventions, respectively. On or after the changepoint, the log mean is hypothesized to reset to a new level, with β0+β2+β1t +β3(t-τ) and β0+β2, for census tracts with and without SRTS interventions, respectively.
A prior distribution for the parameters in the model is defined to reflect uncertainty about whether there actually was a change in injury counts during the study period by placing a uniform distribution on the interval of 40 quar-ters of observation in census tracts with and without SRTS interventions for the changepoint τ, and a normal distri-bution centered at 0 for the beta coefficients:
τeU 1ð ;40Þ
β0;β1;β2;β3eN 0;10 6
:
The model was evaluated with Monte Carlo Markov chain simulations using the JAGS Gibb’s sampler program (Plummer 2010) under the R2jags interface (Su and Masa-nau 2012).
Convergence to a stable posterior sample of values was assessed by visually inspecting the traceplot of simu-lated values and with the R coda package to calculate the Brooks-Gellman-Rubin statistic, which compares within chain variation to across chain variation (Plummer et al. 2012). Injury count and population data, JAGS model syntax, and quarterly posterior means and statistics for SRTS-intervention sites can be found in the Additional file 1.
2.3 Poisson model
To assess the impact of SRTS interventions on school-travel pediatric pedestrian injuries following the pro-posed changepoint, we fit an overdispersed Poisson model (Gelman and Hill 2007):
log μt ¼β0þβ1Periodtþβ2SRTS
þβ3PeriodtSRTSþ log Oð Þt ;
ð8Þ
exponentiated coefficients to be interpreted as incidence rate ratios.
The primary model compared the experience in census tracts with schools that had completed SRTS interven-tions to census tracts in which there were no schools that had completed SRTS interventions. As a sensitivity analysis, we conducted an additional analysis in which census tracts with schools that had completed SRTS in-terventions were compared to census tracts in which there was a school that had been identified for SRTS in-terventions, but for which no or only short-term or tem-porary interventions, such as lighting and signage replacement, had been completed. The study protocol was approved as exempt by the Columbia University Medical Center institutional review board.
3 Results
The full data set consisted of 140,835 pedestrian crashes, which occurred between 2001 and 2010 in 1,929 New York City census tracts. There were 35,587 pedestrian injuries among school-age children (ages 5 to 19). The largest proportion of school-age pedestrian injuries oc-curred during the non-school months of July and August (11.6% and 9.6% respectively). A total of 4,021 (11.3%) age pedestrian injuries occurred during school-travel hours (7 AM to 9 AM or 2 PM to 4 PM).
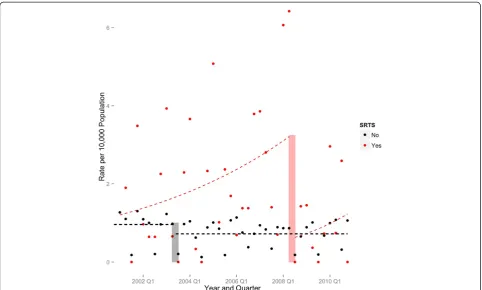
In census tracts with SRTS interventions, the quarterly rate of school-age pedestrian injuries during school hours appeared to be increasing in the earlier years of the study period and then sharply declined at some point following 2008. There was no similar change in the quarterly time series for census tracts without SRTS in-terventions (Figure 1).
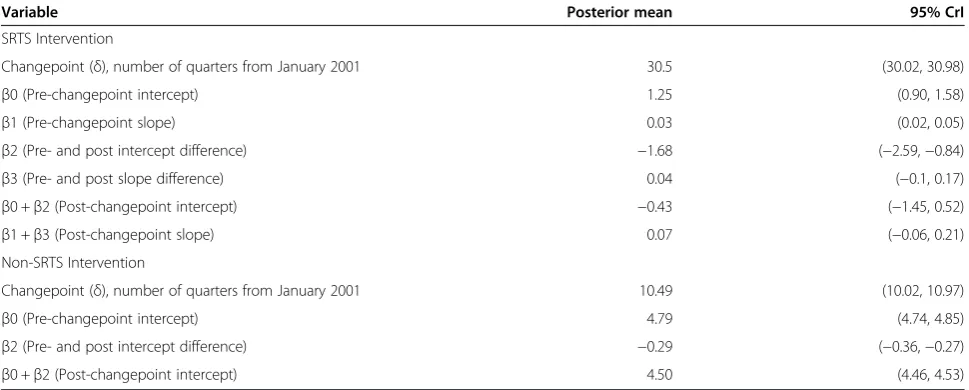
In the Bayesian changepoint analysis of the quarterly count data for the SRTS intervention group, the most likely changepoint occurred between the 30th and 31st quarter, which corresponds to the second or third quar-ter of 2008 (Table 1).
In the SRTS intervention areas, there were an estimated 3.66 (95% Credible Intervals [CrI] 2.58, 4.96) school-travel school-age injuries in the first quarter of 2001. This trans-lates to a quarterly injury rate of 1.16 per 10,000 (95% CrI 0.84, 1.66) in the first quarter of 2001. The number of injur-ies increased until the changepoint of the second quarter of year 2008 (τ = 30). The injury count was estimated to be exp(0.03)-1= 3% (95% CrI 2%, 5%) higher for each quarter prior to the changepoint (Table 1). The average number of injuries in the quarter just before and after the change-point was estimated to be 9.73 (95% CrI 7.49, 12.31) and 2.06 (95% CrI 0.84, 4.08), respectively. These counts translated to an estimated pre-changepoint quarterly rate of 3.47 per 10,000 (95% CrI 2.67, 4.39), and a
changepoint quarterly rate of 0.74 per 10,000 (95% CrI 0.30, 1.5).
We contrasted these results to those for the non-SRTS intervention areas, which used a simplified model (2) to achieve convergence (Table 1). The most likely change-point occurred between the 10thand 11thquarter, which corresponds to the 2ndor 3rdquarter of 2003. In the non-SRTS areas, the average number of pre-changepoint injur-ies was estimated to be 120.30 (95% CrI 114.43, 127.74). The average number of post-changepoint injuries was exp (4.50) = 90.02 (95% CrI 86.49, 92.76). These counts trans-late to pre and post changepoint quarterly injury rates of 0.96 (95% CrI, 0.92, 1.02) and 0.72 (95% CrI 0.69, 0.74) per 10,000 population.
The changepoint results for both the SRTS and non-SRTS areas are illustrated in Figure 2.
Table 2 presents the results of the overdispersed Poisson model. Theβ3coefficient represents the difference between intervention and non-intervention census tracts in the inci-dence density ratio of injuries pre- and post-changepoint. In the model comparing census tracts with completed SRTS improvements to non-SRTS census tracts, there was a 1-exp(-0.58) = 44% overall risk reduction (95% Confi-dence Interval [CI] 87% decrease to 130% increase). In the model comparing census tracts with completed SRTS in-terventions to census tracts with incomplete SRTS inter-ventions, there was an overall risk reduction of 32% (95% CI 74% decrease to 78% increase). The insignificance of the interaction term here might be due to small numbers of data points used in the regression model.
4 Discussion
Though intended primarily to encourage physical activ-ity among school children, the national SRTS program
represents perhaps the largest single United States fed-eral government expenditure for pediatric pedestrian safety in US history. In this study, SRTS interventions in New York City were associated with a decline in pedes-trian injuries among school-age children traveling to or from school. The changepoint occurred at the time SRTS interventions were implemented, and followed years of increasing numbers of injuries.
Our primary intention in this paper was to precisely estimate the point at which declines in school-age, school-travel pedestrian injury in SRTS areas are likely to have occurred, and to estimate the change in risk based on this more precise estimate. A previous analysis of these data similarly demonstrated the association of SRTS interventions with decreased pediatric pedestrian injury risk, but one could reasonably interpret the time series as indicating changes prior to the implementation of interventions (DiMaggio and Li 2013). The current analysis indicates the change was very likely to have oc-curred at or about the time SRTS interventions were im-plemented, and was associated with meaningful, though in this analysis not statistically significant, decreases in risk. These results argue for the effectiveness of SRTS in-terventions in controlling school-travel related pediatric pedestrian injury.
It should perhaps not come as a surprise that SRTS in-terventions are effective in preventing school-travel pedes-trian injuries. Engineering approaches to injury control are often the most effective (Haddon 1980), and SRTS le-gislation requires that 70 to 90% of SRTS funds be used for infrastructure projects like sidewalk construction, compared to 10 to 30% for education projects (Levin Martin et al. 2009). Fully 63% of all SRTS projects nation-wide involve some change to the built environment.
Table 1 Results from the Bayesian changepoint analysis
Variable Posterior mean 95% CrI
SRTS Intervention
Changepoint (δ), number of quarters from January 2001 30.5 (30.02, 30.98)
β0 (Pre-changepoint intercept) 1.25 (0.90, 1.58)
β1 (Pre-changepoint slope) 0.03 (0.02, 0.05)
β2 (Pre- and post intercept difference) −1.68 (−2.59,−0.84)
β3 (Pre- and post slope difference) 0.04 (−0.1, 0.17)
β0 +β2 (Post-changepoint intercept) −0.43 (−1.45, 0.52)
β1 +β3 (Post-changepoint slope) 0.07 (−0.06, 0.21)
Non-SRTS Intervention
Changepoint (δ), number of quarters from January 2001 10.49 (10.02, 10.97)
β0 (Pre-changepoint intercept) 4.79 (4.74, 4.85)
β2 (Pre- and post intercept difference) −0.29 (−0.36,−0.27)
β0 +β2 (Post-changepoint intercept) 4.50 (4.46, 4.53)
Approximately 39% of urban land areas are within a half mile of a school, leading some investigators to conclude that SRTS programs have the potential to benefit 65.5 mil-lion people in the United States (Watson and Dannenberg 2008).
Evaluations of change following policy interventions can be challenging. Sequential observations are not inde-pendent. Secular trends and seasonal variations make it difficult to draw conclusions based on simple pre-post comparisons. Bayesian methods have been proposed as effective approaches to changepoint problems (Carlin et al. 1992), which address the identification of the point at which a change occurs in a time series. While not com-mon in injury research, Bayesian changepoint methods
have been applied to such public health questions as de-clines in violent assault following closings of alcohol out-lets (Yu et al. 2008), evaluating the clinical significance of serial CD4 counts (Ghosh and Vaida 2007), and biomarker assays (Bellera et al. 2008), and predicting cancer recur-rence (Pauler and Finkelstein 2002).
Bayesian changepoint methods hold several advantages for injury researchers. The approach lends itself to the setting where data are scarce, expectations are uncertain, and the underlying data series may be difficult to model using either deterministic or stochastic time series ap-proaches. The Bayesian approach ‘treats the timing of change as uncertain”and allows the analyst to“discover” the changepoint from the data (Western and Kleykamp
Table 2 Regression coefficients and 95% confidence intervals from overdispersed Poisson models
Census Tracts with Completed SRTS Interventions Vs. Census Tracts with No SRTS Interventions
Census Tracts with Completed SRTS Interventions Vs. Census Tracts with Partially Completed SRTS Interventions
Variable
β0 −9.43 (−9.55,−9.31) −8.51 (−8.69,−8.33)
β1 0.95 ( 0.42, 1.48) 0.03 (−0.32, 0.38)
β2 −0.13 (−0.40, 0.14) −0.33 (−0.76, 0.10)
β3 −0.58 (−2.01, 0.85) −0.38 (−1.34, 0.58)
Coefficients and 95% Confidence Intervals (CI) on log scale. Completed Safe Routes to School(SRTS) interventions census tracts and non-SRTS intervention census tracts (model 1) and completed SRTS census tracts vs. not-completed SRTS intervention census tracts (model 2), New York City, 2001–2010.
2004). Changepoint analysis also lends itself naturally to hierarchical modeling, since the parameters for prior distributions may be assigned their own prior distribu-tions. This can allow us to incorporate additional sources of uncertainty, such as changepoints varying across geographic regions. This method also has the ad-vantage of returning direct probability statements that may be more easily interpretable by policy makers (Kim and Nelson 1999).
One of the drawbacks to a changepoint analysis is that the approach is inherently limited to a single series of observations. Our motivation for this changepoint ana-lysis was to establish the temporal relationship between the SRTS interventions in the target population, and to contrast that to the lack of such a temporal relationship in a non-target population. To accomplish this, we stratified our analyses by target group, and based our comparisons on two separate changepoint models. While, in general, a single model of all the data is prefer-able and less prone to bias, changepoint modeling does not lend itself easily or intuitively to that approach and this is an area of research (Seidou et al. 2007; Cai et al. 2012), and we believe a stratified approach is valid for the temporal conclusions we draw from the analysis.
4.1 Limitations
The study is subject to a number of important limitations. The demonstrated declines cannot be separated from underlying secular trends, and indeed declines in overall pedestrian injury rates predate the SRTS program. New York City, through the efforts of the City Department of Transportation and the Department of Health and Mental Hygiene, has made important strides in making the city safer for all road users. This renders it difficult to tease out the effects of any single program or intervention.
The City Department of Transportation has taken a proactive approach to making the city walkable and safe. Total traffic fatalities decreased 35% between 2001 and 2009, making 2009 the safest year on record in terms of traffic crashes. The department issued a landmark Ped-estrian Safety Study and Action Plan and continues efforts to install 1,500 pedestrian signals, re-engineer 60 miles of streets and 20 intersections, evaluate 20 mile-per-hour pedestrian safety zones, and pilot a program to improve left-turn visibility in Manhattan (Viola et al. 2010). Also, the target groups and areas started at higher injury rates than non-intervention groups, and there may have been some regression to the mean in the time series. Despite these caveats, there is evidence of a tem-poral change only in those areas in which there were completed interventions, occurring only when the inter-ventions were completed, and associated with a decline in risk only in those areas, and only after the SRTS inter-ventions were put in place.
To ensure the consistency and reliability of the popu-lation data across the 10 years of study, and across the analytic approaches that took geography into account, we restricted the analyses to those census tracts that were present in both census years. Because injury rates have been dropping over time, this resulted in slightly inflated absolute injury rates. However, it allowed for more valid comparisons across space and time, and be-tween intervention and non-intervention sites.
Census tracts are most often not ideal geographies at which to measure traffic injury control interventions, and many such analyses use data based on intersections or geographic buffers based on an intersection. If exposures were based on traffic volume, or if the interventions were limited to single sites, then an intersection-based approach might make more sense. That was not the case with these interventions. The New York City Department of Trans-portation describes the extent of SRTS interventions to be approximately 800 feet surrounding a school, and it is this somewhat diffuse extent that may contribute to overall traf-fic calming in the area around a school. We note that the average area of a census tract in New York City is 90 acres or 3,920,400 square feet. An 800-foot circular geographic buffer would cover about 2,010,619 square feet. We note as well that our exposures are population-based, and that census tracts, which are defined to have stable underlying population estimates of between 3,000 and 4,000 may be more appropriate in this setting.
There were also important and significant changes in the demographics and population of New York City from 2000 to 2010. While there was an 2.08% increase (from 8,008,278 to 8,175,133 ) in the overall city popula-tion, there was at the same time a 9.2% decrease (1,612,572 to 1,477,146) in the number school-age children as we defined them for this study (US Census Bureau 2010). While we do not have any data on the number of children actually walking to school, SRTS programs have been consistently demonstrated to increase the number of children walking to school, so the population exposure may likely have increased following the interventions.
There were also changes in the geographic make up of New York City during the study period. There were 2,217 census tracts in 2000, and 2,168 tracts in 2010, for an overall decrease of 2.2%. There were 288 census tracts in the 2000 data set that were not in the 2010 data set. There were conversely 239 census tracts in the 2010 data set that were not in the 2000 data set.
5 Conclusions
Manipulating the physical environment is an effective, though often difficult and expensive, approach to pedes-trian injury control (DiMaggio and Li 2012). Separating play areas from roadways, improved visibility at intersec-tions, conspicuous stop signs, enhanced pavement mark-ings and improved lighting prevent pedestrian injury. All of these interventions are represented by the New York City SRTS program, which in these data has been shown to be associated with a decline in school-travel related pediatric pedestrian injury risk in areas with completed SRTS interventions timed to the completion of those interventions.
Additional file
Additional file 1:Appendices.
Authors’contributions
CD was primary author, conceptualized the study design, obtained the data, conducted the analyses, wrote the initial draft, and had final approval of the version to be published. QC analyzed the data, interpreted the results, and rewrote and edited the paper for important conceptual contributions. PM contributed by reviewing, editing, and rewriting substantive portions of the manuscript. GL was senior author on the paper, and contributed to the study design, statistical approach, and interpretation of the results. All authors read and approved the final manuscript.
Author details
1Columbia University College of Physicians and Surgeons Department of
Anesthesiology; Mailman School of Public Health Department of Epidemiology; Center for Injury Epidemiology and Prevention, Columbia University Medical Center, 622 West 168 Street, New York, NY 10032, USA. 2Mailman School of Public Health Department of Biostatistics, 722 West 168
Street, New York, NY 10032, USA.3Mailman School of Public Health Department of Health Policy and Management, 722 West 168 Street, New York, NY 10032, USA.
Received: 31 December 2013 Accepted: 5 June 2014 Published: 29 July 2014
References
Albert J.Bayesian Computation with R. New York: Springer; 2008.
Bellera CA, Hanley JA, Joseph L, Albertsen PC.Hierarchical changepoint models for biochemical markers illustrated by tracking postradiotherapy prostate-specific antigen series in men with prostate cancer.Ann Epidemiol.2008;18:270–82. Cai B, Lawson AB, McDermott S, Aelion CM.A Bayesian semiparametric
approach with change points for spatial ordinal data.Stat Methods Med Res.2012; [Epub ahead of print].
Carlin B, Gelfand A, Smith A.Hierarchical Bayesian analysis of changepoint problems.Appl Stat.1992;41:389–405.
Chriqui JF, Taber DR, Slater SJ, Turner L, Lowrey KM, Chaloupka FJ.The impact of state safe routes to school-related laws on active travel to school policies and practices in U.S. elementary schools.Health Place.
2012;18(1):8–15.
Cradock AL, Fields B, Barrett JL, Melly S.Program practices and demographic factors associated with federal funding for the Safe Routes to School program in the United States.Health Place.2012;18(1):16–23. DiMaggio C, Li G.Roadway characteristics and pediatric pedestrian injury.
Epidemiol Rev.2012;34(1):46–56.
DiMaggio C, Li G.Effectiveness of a safe routes to school program in preventing school-aged pedestrian injury.Pediatrics.2013;131(2):290–96. Gelman A, Hill J.Data Analysis Using Regression and Multilevel Methods. New York:
Cambridge University Press; 2007: p. 115.
Ghosh P, Vaida F.Random changepointmodelling of HIV immunologic responses.Stat Med.2007;26:2074–87.
Haddon W Jr.Advances in the epidemiology of injuries as a basis for public policy.Public Health Rep.1980;95(5):411–21.
Kim CJ, Nelson CR.Has the US economy become more stable? A Bayesian approach based on a Markov-switching model of the business cycle.
Rev Econ Stat.1999;81:608–16.
Levin Martin S, Moeti R, Pullen-Seufert N.Implementing safe routes to school: application for the socioecological model and issues to consider.Health Promot Pract.2009;10(4):606–14.
Lewin-Koh Roger.Maptools: Tools for Reading and Handling Spatial Objects. R Package Version 0.8-14. 2012. Available at http://cran.r-project.org/web/ packages/maptools/index.htm.
National Center for Safe Routes to School.Federal Safe Routes to School Program Progress Report. 2012. Available at http://www.saferoutesinfo.org/sites/ default/files/resources/progress%20report_FINAL_web.pdf.
National Center for Safe Routes to School.Program Tools. 2013. http://www. saferoutesinfo.org/.
New York City Department of Transportation.Safety Programs: Safe Routes to Schools. 2012. Available at www.nyc.gov/html/dot/html/safety/saferoutes.shtml. Pauler DK, Finkelstein DM.Predicting time to prostate cancer recurrence based
on joint models for non-linear longitudinal biomarkers and event time outcomes.Stat Med.2002;21:3897–911.
Plummer M.JAGS (Just Another Gibbs Sampler). 2010. Available at http://mcmc-jags.sourceforge.net/.
Plummer M, Best N, Cowles K, Vines K, Sarkar D, Almond R.Coda: Output Analysis and Diagnostics for MCMC. 2012. Available at http://cran.r-project.org/web/ packages/coda/index.html.
R Development Core Team.R: A Language and Environment for Statistical Computing Version 2.14; 2011. 2011. Available at http://www.r-project.org/. Safe Routes to School National Partnership. 2012. Available at www.
saferoutespartnership.org/home.
Seidou O, Asselin JJ, Ouarda TBMJ.Bayesian multivariate linear regression with application to change point models in hydrometeorological variables.
Water Resour Res.2007;43(W08401):17.
Su Y, Masanau Y.R2jags: A Package for Running Jags from R. 2012. Available at http://cran.r-project.org/web/packages/R2jags/index.html.
The RBA Group Urbitran Associates, Inc.Prioritization Methodology: Final Report Prepared for New York City Department of Transportation. 2013. Available at http://www.nyc.gov/html/dot/downloads/pdf/srts_prioritization_2003.pdf. US Census Bureau.American FactFinder. Washington, DC: US Census Bureau;
2010.
Viola R, Roe M, Shin H.The New York City Q:14 Pedestrian Safety Study and Action Plan. 2010. Available at http://www.nyc.gov/html/dot/html/about/ pedsafetyreport.shtml. Accessed 15 December 2012.
Watson M, Dannenberg AL.Investment in safe routes to school projects: public health benefits for the larger community.Prev Chronic Dis.2008;
5(3):A90.
Western B, Kleykamp M.A Bayesian change changepointpoint model for historical time seires analysis.Polit Anal.2004;12:354–74.
Yu Q, Scribner R, Carlin B, Theall K, Simonsen N, Ghosh-Dastidar B, Cohen D, Mason K.Multilevel spatio-temporal dual changepoint models for relating alcohol outlet destruction and changes in neighbourhood rates of assaultive violence.Geospat Health.2008;2:161–72.
doi:10.1186/s40621-014-0017-0