Sumanta et al. World Journal of Pharmaceutical and Medical Research
“EVALUATION OF PLACENTAL THICKNESS AS A SONOLOGICAL INDICATOR
FOR ESTIMATION OF GESTATIONAL AGE AND FETAL OUTCOME IN NORMAL
SINGLETON PREGNANCY”
Sandip Kumar Ghosh MBBS, MD, *Sumanta Kumar Mandal MBBS, MD, 1Kashi Nath Sarkar MBBS, MD and
2
Arijit Mishra MBBS
Associate Professor, Bankura Sammilani Medical College. 1Radiologist, 2Post Graduate
Trainee, Bankura Sammilani Medical College.
Article Received on 10/01/2019 Article Revised on 31/01/2019 Article Accepted on 22/02/2019
INTRODUCTION
Single most useful piece of information that obstetric sonography provides is accurate determination of menstrual age.[1] Gestational age is important in evaluating fetal growth, virtually all important clinical decisions require knowledge of menstrual age. Many women may not accurately recall the first day of last menstrual period particularly if they are not trying to conceive. LMP may be unreliable because of oligomenorrhea, abnormal menstrual bleeding, use of oral contraceptive, becoming pregnant in the first ovulatory cycle after a recent delivery and ovulating very early (day 11) or very late (day 21) in the menstrual cycle. The placenta a highly vascular organ, maintains the feto-maternal circulation via its connection: the umbilical cord.[2] A normally functioning placenta is critical for normal fetal growth and development.[3,4] The size of placenta increases during fetal growth period to allow it to carry out its vital functions.[5] If the fetal
growth is compromised it is due to abnormal functioning of the placenta which can be detected by the abnormal placental measurement.[6] according to sadler et al term placenta is approximately 3 cm thick and 15-25 cm in diameter.[7] A warning limit of placental diameter of 18 cm and placental thickness of 2 cm at 36 weeks predicts low birth weight neonates.[8] Small placentaes are
associated with preeclampsia, chromosomal
abnormalities, severe maternal diabetes mellitus, chronic fetal infections and intrauterine growth restriction.[9] The placentaes over 4 cm thick at term have been observed in conditions like diabetes mellitus, perinatal infections, hydrops fetalis,[8] the effect of an abnormally thick placenta on fetal parameters remains clinically unclear.[9] Present study was planned to look for the placental growth on ultrasonography in relation to gestational age and fetal outcome.
ISSN 2455-3301
WJPMR
AND MEDICAL RESEARCH
www.wjpmr.com
*Corresponding Author: Sumanta Kumar Mandal MBBS, MD
Associate Professor, Bankura Sammilani Medical College.
ABSTRACT
Objectives: (1) To correlate placental thickness and fetal weight with gestational age by ultrasonography in normal singleton pregnancy. (2) To evaluate the role of placental thickness in estimation of fetal outcome in terms of birth weight, meconium stained liquor, APGAR score and NICU admission. Materials and Methods: A total of 100 antenatal mothers were interviewed by principal investigator and ultrasonography for fetoplacental profile was done and were followed up at 24 weeks,32 weeks, 36 weeks and after delivery for placental thickness and expected fetal weight. After delivery of such women fetal outcome was assessed in terms of birth weight, APGAR score, whether liquor was meconium stained or not and whether required NICU admission or not. Results: In the study it was observed that there was high positive correlation between the gestational age and placental thickness at 11-35 weeks with Pearson's correlation coefficient ("r ")value 0.98 and "p" value <0.001. After 36 weeks no correlation was proved between the placental thickness and the gestational age with "r" value 0.17 and "p" value >0.235. similarly high positive correlation was proved between fetal weight and gestational age up to 38 weeks. At 32 and 36 weeks there were positive correlation with estimated fetal weight and birth weight. Conclusion: The relationship between the placental thickness and gestational age is linear and direct. Placental thickness and fetal weight are closely correlated from 11 to 38 weeks and it follows nearly a linear pattern except during last few weeks (after 38 weeks). Thin placenta were associated with increased morbidity, poor APGAR score and higher incidence of NICU admission.
METHODS
The study was carried out in the department of radiodiagnosis Bankura Sammilani Medical College and hospital. The ultrasonography machine used were Philips HD 7 ( 2.0.1) and the probe used for the study was 3.5 MHz convex array transducer.
The inclusion criteria
1. Singleton pregnancies 11 to 40 weeks 2. Known last menstrual period
3. Regular menstrual history before current pregnancy.
The exclusion criteria
4. Patients with PIH, diabetes mellitus, hydrops fetalis congenital malformations
5. Polyhydramnios 6. Oligohydramnios
7. placenta with morphological variations in size and shape like lobed placenta, succenturiata , placenta membranacea, circumvallate placentas
8. Placenta with variations in insertion of umbilical cord like marginal or battledore placenta and velamentous cord insertion.
9. Placenta with poor visualisation of cord insertion site.
10. Poor sonographic visualisation of placenta due to maternal obesity.
11. Placenta posterior where shadowing from fetal structures specially in late third trimester.
The patient was scanned with a moderately distended bladder in supine position.the placental thickness in mm was measured at the level of cord insertion site.The site is usually Central but slightly eccentric position may be normal. The cord insertion site appears either as hypoechoic areas closest to the chorionic plate in the thickest portion of the placenta with a v shape or as
linear echos emanating at right angles from the placental surface. Placental thickness was calculated from the echogenic chorionic plate to placental myometrial interface. Focal myometrial thickening due to contraction or myomata may spuriously suggest placental thickening but attention to the placental myometrial echogenicity difference should confirm that the placenta drapes over these region of myometrial thickening.[10] The gestational age in first trimester from 11 to 13 weeks of pregnancy was determined by measuring CRL and calculations using hadlock tables,[11] in second and third trimester from 14 to 40 weeks of pregnancy GA was determined by composite fetal measurements of BPD, HC, AC and FL. Expected fetal weight is calculated using hadlock formula.[12]
The data was finally analysed with statistical package for social sciences (version 19.0) software. The ethical clearance was obtained from institutional ethics committee and an informed consent was obtained from the subjects before starting the study.
RESULTS
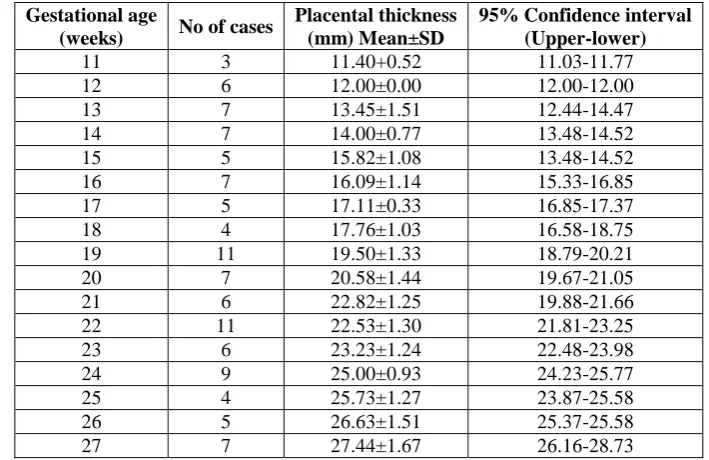
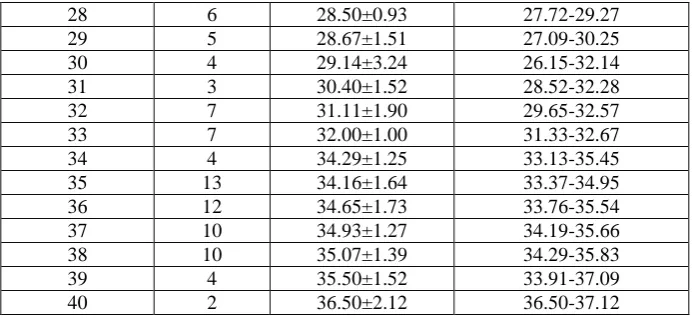
From the table 1 it was observed that there is high positive correlation between the gestational age and placental thickness at 11 to 35 weeks. After 36 weeks no correlation exist between placental thickness and gestational age.For every week of increase in gestational age there is an average increase of placental thickness by 0.8993 millimetre. The placental thickness gradually increases from approximately 11.4 mm at 11 weeks to 36.5 m at 40 weeks of gestational age. From 11 to 36 weeks of gestation the placental thickness (mm) almost matches the gestational age in weeks, thereafter from 36 to 40 weeks the placental thickness decreases by 1 to 3 mm. At no stage of pregnancy normal placenta measured greater than 38 mm.
Table 1: Distribution of Participants according to the gestational age and thickness of placenta. Gestational age
(weeks) No of cases
Placental thickness (mm) Mean±SD
95% Confidence interval (Upper-lower)
11 3 11.40+0.52 11.03-11.77
12 6 12.00±0.00 12.00-12.00
13 7 13.45±1.51 12.44-14.47
14 7 14.00±0.77 13.48-14.52
15 5 15.82±1.08 13.48-14.52
16 7 16.09±1.14 15.33-16.85
17 5 17.11±0.33 16.85-17.37
18 4 17.76±1.03 16.58-18.75
19 11 19.50±1.33 18.79-20.21
20 7 20.58±1.44 19.67-21.05
21 6 22.82±1.25 19.88-21.66
22 11 22.53±1.30 21.81-23.25
23 6 23.23±1.24 22.48-23.98
24 9 25.00±0.93 24.23-25.77
25 4 25.73±1.27 23.87-25.58
26 5 26.63±1.51 25.37-25.58
28 6 28.50±0.93 27.72-29.27
29 5 28.67±1.51 27.09-30.25
30 4 29.14±3.24 26.15-32.14
31 3 30.40±1.52 28.52-32.28
32 7 31.11±1.90 29.65-32.57
33 7 32.00±1.00 31.33-32.67
34 4 34.29±1.25 33.13-35.45
35 13 34.16±1.64 33.37-34.95
36 12 34.65±1.73 33.76-35.54
37 10 34.93±1.27 34.19-35.66
38 10 35.07±1.39 34.29-35.83
39 4 35.50±1.52 33.91-37.09
40 2 36.50±2.12 36.50-37.12
To prove that there was a correlation between placental thickness and the gestational age the correlation coefficient was calculated and it was found to be r=0.98,
p<0.001 for the gestational age of 11 to 35 weeks and r=0.17 and p>0.235 for the gestational age >36 weeks.
Table 2: Distribution of study subjects according to gestational age and expected fetal weight. Gestational age Number of cases Mean expected fetal weight (gms1)
11 3 07
12 6 14
13 7 23
14 7 28
15 5 68
16 7 106
17 5 134
18 5 180
19 11 235
20 7 290
21 6 354
22 11 410
23 9 496
24 4 590
25 6 656
26 5 790
27 7 870
28 6 930
39 5 1160
30 4 1328
31 3 1485
32 7 1678
33 7 1863
34 4 2089
35 13 2495
36 12 2638
37 10 2854
38 10 3019
39 4 3235
40 2 3459
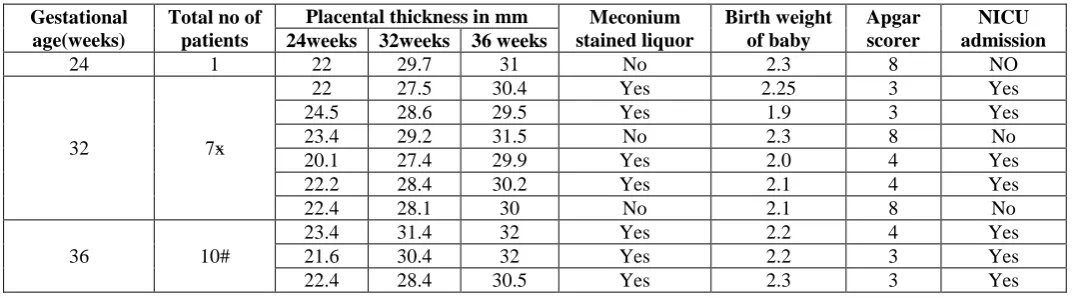
Table 3: Distribution of Participants according to gestational age, placental thickness and few other characteristics.
Gestational age(weeks)
Total no of patients
Placental thickness in mm Meconium stained liquor Birth weight of baby Apgar scorer NICU admission 24weeks 32weeks 36 weeks
24 1 22 29.7 31 No 2.3 8 NO
32 7ӿ
22 27.5 30.4 Yes 2.25 3 Yes
24.5 28.6 29.5 Yes 1.9 3 Yes
23.4 29.2 31.5 No 2.3 8 No
20.1 27.4 29.9 Yes 2.0 4 Yes
22.2 28.4 30.2 Yes 2.1 4 Yes
22.4 28.1 30 No 2.1 8 No
36 10#
23.4 31.4 32 Yes 2.2 4 Yes
21.6 30.4 32 Yes 2.2 3 Yes
22.4 28.4 30.5 Yes 2.3 3 Yes
From the table/fig 3 it was observed that at 24 weeks one patient who was suspected to have IUGR by biometric parameters had placental thickness below 10th percentile at 24 and 32 weeks and give birth to a low birth weight neonate. At 32 weeks all of the 7 patients (*this includes 1 patient with IUGR at 24 weeks) who were suspected to have IUGR by biometric parameters had placental thickness below 10th percentile at 32 and 36 weeks and 57% had meconium stained liquor. 10 patients (# this includes 7 patients with suspected IUGR at 32 weeks) were suspected to have IUGR by biomatric parameters at 36 weeks. 80% had placental thickness below 10th percentile at 36 weeks.
DISCUSSIONS
Donald introduced placental localisation by ultrasound in 1965.[13] The placenta is a fetal organ with important metabolic endocrine and immunological functions and also it has a role in protecting the foetus from noxious agents.For many years ultrasonologist have approached the placenta as a static feature in a dynamic system.while all measurements of the foetus were related to menstrual age, the placental thickness was just as normal or abnormal based on a single cut off point. The present study data highlighted that placental thickness is a function of age. Abnormal thickening or thinning must be correlated with other estimate of pregnancy duration.sonographic measurements of the placenta during pregnancy have been described previously. To determine whether a given placental thickness is normal or abnormal normal placental thickness must be defined for each week of gestational age throughout pregnancy. Estimation of fetal weight on its own and in relation to gestational age can influence of static management decisions concerning that time and route of delivery. Anupama Jain ET Al reported correlation between placental thickness and gestational age. They found placental thickness (in mm) almost matched gestational age from 27 weeks to 33 weeks of gestation after which there was gradual thinning.[14,15] placental thickness changes and expiration of normal growth of the fetal placental unit amenable to measurement with USB and value in describing normal physiology.to obtain an accurate placental measurement is important to identify
the placenta myometrial interface.When placenta is posterior identification of this region is facilitated by the acquisition of images as free from acoustics are doing from the foetus as possible.when the placenta is anterior proper transducer position and gain setting an important to minimise near field and reverberation artefact.
CONCLUSIONS
From our study it can be concluded that the relationship between the placental thickness and gestational age is linear and direct.placental thickness and fetal weights are closed related from 11 weeks to 38 weeks and it follows nearly a linear pattern accept during last few weeks of gestation. It was found that initial growth of placenta being much more rapid than that of the foetus.Thin placenta were associated with increased morbidity poor APGAR score and higher incidence of in NICU admission.Measurement of placental parameters are effective for peripheral centres in India which do not have Doppler and 3D ultrasound facilities for timely referral and safe outcome of the foetus.
REFERENCES
1. Robert 0, Harris MD, Roberta 0, Alexander MD, Ultrasonography of placenta and umbilical cord. In:Peter W Callen, Ed.Ultrasonography in obstetrics and Gynecology. 4th Edition. Philadelphia, WB saunders Company, 2000, 597-625.
2. Ohagwu CC, Abu PO, Ezokeke UO, Ugwu AC. Relationship between Placental thickness and growth parameters in normal Nigerian fetuses. Afr J Biotechnol, 2009; 8(2): 133-38
3. Kliman HJ: Trophoblast to human placenta. Encyclopedia of Reproduction, vol 4. Edited by Knobil E, Neil JD. San Diego, Academic Press, 1999; 834-46.
4. Kliman HJ. The placenta revealed. Am J Pathol, 1993; 143(2): 332-36.
6. Wolf H,Oosting H,Treffers PE.A longitudinal study of the relationship between placental and fetal growth as measured by ultrasonography. Am j Obstet Gynecol., 1989; 161(5): 1150-45.
7. Sadler T.Third month to birth. The fetus and placenta Lang mans Medical Embryology, 9th ed.: Lippincott William & Wilkins; 9th Bk & Cdr edition (March 26, 2003), 2003.
8. Habib FA. Prediction of low birth weight infants from ultrasound measurement of placental diameter and thickness. Ann Saudi Med., 2002; 22(5-6): 312-14.
9. Grannum PA, Berkowitz RL & Hobbins JC. The ultrasonic changes in the maturing placenta and their relation to fetal pulmonary maturity. Am J Obstet Gynecol., 1979; 133(8): 915-22.
10. Hoddick WK, Mahoney 8S, Callen FW, Filly RA. ”Placental thickness”. J Ultrasound Med., 1985; 4: 479-482.
11. Hadlock FP, Shah YP, Kanon OJ, Lindsey JF. ”Fetal crown-rump length: Re- evolution of relation to menstrual age with high resolution real time ultrasound”.Radiology, 1992; 182: 501.
12. Hadlock FP, Harrist RB, Carpenter RJ, Deter RL, Park SK. „Sonographic estimation of fetal weight‟ Radiology, 1984; 150: 535-540.
13. Donald I,”On launching a new diagnostic science”. Am J Obstet Gynecol, 1968; 103: 609-628.
14. Granum PAT, Hobbins JC. ”The placenta”. RadiolClin North Am, 1982; 20: 353.