Energy resources Sustainable and optimum
distribution completion based on client needs
through smart information systems with aim of
network or grid voltage profile improvement
Aliyev Alovsat
PhD Student:Maqsud Hasanzade mardangom E:mail: [email protected]
ACADEMY OF SCIENCES
AMEA Information technology Baku University
Corresponding Author email :[email protected] & [email protected]
Abstract: Nowadays , consumers electrical energy providing in validity , without delay and sustainable form is main challenge for power systems exploiters. Using diversity generation resources (DG) based on renewable technologies such as wind plants and photovoltaic and randomized nature is one the most effective methods to response electrical energy consumption increasing. In current research , a new algorithm was suggested according to Monte Carlo Simulation (MCS) to evaluation of electrical systems installed to DG. This algorithm was implemented distribution grids in non- deterministic and randomized form base on smart information systems. Non- deterministic in place , penetration surface and ON/OFF states in DG units is created system randomized parameters. In current research possible parameters in related equations and load distribution are combined with Raffson- Newton case and also Monte Carlo Simulation (MCS) method was implemented to analysis all of possible operational scenarios in studied system and achieving validity in mentioned results. Suggested algorithm in this research was used to obtaining hourly load distribution solving method to connected DGs in system and evaluation of new hourly function parameters in sustainable form and system behavior description under DG randomized function according to shins load model and combining three different curves. Results were presented and discussed on sample grid with 30 shins of standard IEEE in MATLAB environment.
Keywords: Distribution grids , Diversity products , Monte Carlo Simulation (MCS) , Load distribution , Non-deterministic
INTRODUCTION
Load direction management word include activities for electricity Companies for changing electricity consumption time or amount with suitable designing of society , consumers and factories. Because high intensity energy consumption , there is strong potential to load direction management plans in order to electrical energy saving. So , energy consumption increasing cause to generating environmental concerns , problems related to efficient improving and electricity energy sustainable , diversity generation resources entry , renewable energies , energy savors in power systems and created problems in modern power systems.
11 generation in city level or diversity region. In current system , every consumer can regard as producer. Each building can generate electrical energy saving resources or generation complete and partial of electrical power by using solar energy , surrounded wind energy , earth thermal energy. Building can use energy in electricity cheap time and it saves energy in resources to apply consumption peak hours and expensive cost for electricity energy price and it can save or sale electricity to grid. We can provide part of network requirement electricity power and also we can manage building energy consumption. Creation disorder in whole network and based on power linear distribution main parts of city face with electricity disconnecting and some of networks have inside capability to electricity power generation and customers will be provide requirement electricity and also different blocks in city will have temporary light. Power intelligent distribution of mentioned system can transfer saved and sustainable energy to urban sensitive usages. And it is non-hierarchical distribution in using of smart networks diversity generation. Using energy generation resources in small scale will reduce smart grids main features , focusing on electricity long networks. Diversity resources development and investment have many advantages such as energy resources variety , lack of dependence to one or two energy ( gas or gasoline) , providing electricity market structure , energy generation output increasing through simultaneous time in thermal and peak stages. So , renewable diversity generation resources can regard as better alternative to fossil fuels in critical conditions happening. Mentioned resources have main and inevitable disadvantages which it is non-deterministic case in electricity generation. One of main problems in electricity distribution grids planning studies is investigation load amounts of consumption points in implemented calculations. This case create because of load information non-deterministic and load anticipation problems. Most of studies in development planning of diversity generation units of distribution grids were implemented in economical viewpoint.[2,3] The aim of studies is diversity generation units placement and optimum sizing for installation of distribution network to load providing with minimum cost. Also in some diversity generation units , articles were studied to reducing losses , voltage profile enhancing and used network sustainability. [4,5] in few articles , we have been used diversity generation units in distribution grids development planning to enhancing distribution network confidence capability and grid clients security increasing. [6,7] Optimized methods in studies are divided classical optimization [2,8] and meta-cognitive optimization methods.[9,10] Suggested algorithm in current research was evaluated to investigation diversity , sustainable and optimum generations in distribution grids based on smart systems and reducing active power losses on sample network or grid. Suggested method evaluation was implemented to creating sustainable and optimum distribution grid based on DGs and using Monte Carlo Simulation in 30 shins IEEE standard grid and obtained results were analyzed extensively.
Problem formulation and suggested algorithm stages
Assume initial power system with M shins. Every shin has load , synchronous condenser , parallel suspected and one connected DG. Maximum amounts of DG are equal with N ( N M) and shins numbers have installation capability. DG units in ON state act random in every hour. Shins of lad or generation cause to creating random loading. In order to load distribution equations formulation , at first we must determine shins loading amount and their nature. Implementation of this stage , random numbers of DGs with k[1,…., N] are used to show DGs in ON state. By determining k random number ; DGs random placements in ON states determine with continuous k number in [1,…., N] interval. According to random process, load distribution equations are formulated by regarding DGs.
In suggested algorithm , we assumed every DGs output power. In order to simulation , calculated generation power amount are remembered in every load. DG nominal amount in U random case multiply to normal distribution U function between [0-1]. Minimum U amount can set according to system loading features and U can vary in loading different times.
(1) 𝑃𝐺𝑖= 𝑃𝑅𝑖× 𝑈
In 1 formulae ; PGi is DG random output power at ith hour ; and PRi is grid loading amount at ith hour.
Loading distribution equations were implemented by regarding Newton-Raffson repeating with 3 random amounts such as k , placement and PGi. DG allocation random process for ON state were repeated in certain shins and also load distribution equations were updated. Updated equations were determined in 1 formulae by regarding DG output. Equations system updating process and their solving cause to DG power participatory total calculations , generators total concentration loads (Reference generators and PV at system) , shin’s voltage , injected power , passing power in feeder and system losses. Converged and ultimate amount of parameters are obtained by implementing Monte Carlo Simulation method. Previous system developed equations updating relations are :
(2) 𝑃̅𝐺𝑖= 1
𝑁𝐸∑ 𝑃𝐺𝑖(𝑗) 𝑁𝐸 𝑗=1
(3) 𝐼̅𝑖2= 1 𝑁𝐸∑ 𝐼𝑖
2(𝑗) 𝑁𝐸 𝑗=1
(4) 𝑉̅𝑖=
1
12 (5) 𝑃̅𝑖=
1
𝑁𝐸∑ 𝑃𝑖(𝑗) 𝑁𝐸 𝑗=1
(6) 𝑃̅𝑙𝑜𝑠𝑠𝑖𝑙 =
1
𝑁𝐸∑ (𝑃𝑙𝑜𝑠𝑠𝑖𝑙(𝑗) − 𝑃_𝑙𝑜𝑠𝑠𝑙𝑖(𝑗)) 𝑁𝐸
𝑗=1
NE is simulation process repeating. 2 to 6 equations and solutions of system loading distribution are used for all of variables to reaching convergence. Updating process include new numbers , new places , new output power percent. In current method , we can regard some limitations in modeling and there are some real problems in grid. Limitations relate to DG penetration level , feeders thermal ( passing power from feeder). Monte Carlo Simulation implementation doesn’t need additional calculations. Monte Carlo suggested method and it’s implementation in step-by- step form was presented in this case:
1) Determining shins with DG installation capability. DG maximum amount in system are equal with N.
2) DG numbers estimation , place and power in every hour of day and model implementation in mentioned stages: A) K integral random number generation for every hour in day to show DG numbers for ON state.
B) K integral and continuous number generation for every hour in day to show system shins amounts which DGs were installed and they are in ON state.
C) U coefficient random generation to DG output power calculation ( Dg penetration level) , DGs for every hour in day ( U coefficient is determined according to system past days loading curve information)
D) Newton-Raffson loading distribution implementation
Newton-Raffson loading distribution
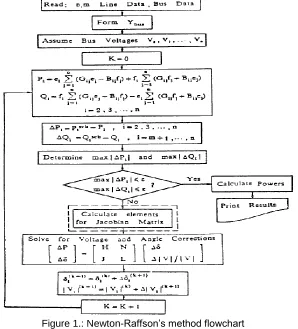
Newton-Raffson method [11] is the basic case in continuous grids of power system and it can solve networks with high speed and less than 10 repeats. It has second order of mathematical convergence and also it has more flexibility in improper grids solving against another continuous networks. Obtained results are used as criteria to accuracy measuring against another methods. Suggested flowchart was shown in figure 1. Extensive discussions mentioned in [11] reference.
Figure 1.: Newton-Raffson’s method flowchart 30 Shins in standard IEEE
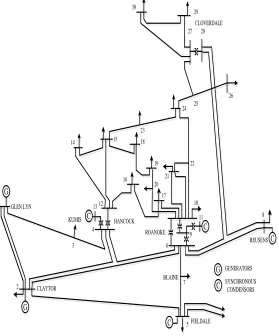
13 transmission line. According to presented data in grid ; No.10 to No.30 shins ( except 11 , 13 and 28 shins) have 33k V Voltage and they assumed in distribution stations. Grid total active load is equal with 283/4 MW and grid reactive loads are equal with 125/25 MVAr. In normal function of grid ; network load is equal with 309/84 MVA. Figure 2 show single linear diagram of standard grid.
G
G 1 GLEN LYN
2
3 KUMIS
CLAYTOR
C 5FIELDALE 7 BLAINE REUSENS 8 26 28 27 29 30 25 24 22 19 18 23 15 14 12 13 4 16 20 17 21 10 11 6 ROANOKE HANCOCK GENERATORS SYNCHRONOUS CONDENSORS C G C C CLOVERDALE 9 C
Figure 2 : IEEE standard 30 Shins grid
Studied systems simulation results
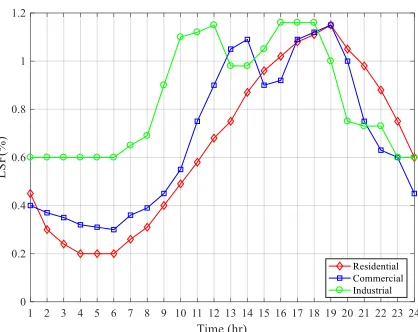
According to research nature in short-term , we regarded daily load curve based on client needs in smart information system and we must investigate load curve to 24 hours in grid. Also we have been regarded real results in household , commercial and industrial loads according to table 1 in grid daily load curve exploiting. Figure 3 show grid daily load curve by regarding load scale. LSF show loads percent against nominal load amount.
Table 1 : 30 Shins in standard IEEE position based on loads kind: Load kind Shin No.
Household 10 , 12,15,16,17,18,19,20,22 23 , 35
14 Figure 3 : Daily load curve based on loads kind under studied grid
33 k V shins total load in normal function(LSF=1) are equal with 37/116 MVA. By regarding these cases , figure 4 show daily load curve in studied power system distribution
Figure 4 : Daily load curve in studied power system distribution
Regarded assumptions
Along study of suggested algorithm and without general effectiveness , we can discuss following assumptions:
Feeders thermal limitation and lines passing maximum power is equal with 20 MVA.
11 shins in grid with 14,15,16,17,18,19,21,24,26,29,30 numbers were regarded for DGs installation. Also shins have 33 k V voltage level without condensers and they have feeders in branched 20,22,25 nodes.
DGs capacities are equal with 4MV and 0.9 power coefficient and also , maximum capacity in all of DGs is equal with 44 MV.
Allowable DGs penetration range in system is determined by percent of consumed power total in above regions of loads surface(33 k V).
DGs generated power by regarding to uncertainty and random parameter depend on U. U amount change with day- night hours and it’s amount for 1 to 8 and 23-24 hours is equal with [1-0.3] and it is equal with [0.5-1] in 9 to 22 hours.
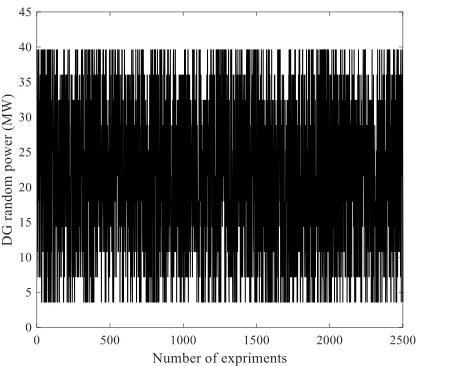
Experiments number in Monte Carlo method was assumed 2500.
In current research , DG technology was used according to renewable resources such as solar cells plant and wind farms. More details were confirmed in solar light uncertainty and we avoided from solar cells irrigated and uncertainty in wind speeds.
15 Simulation results
Scenario 1
In this case ; 2 to 6 equations were implemented without any limitation and after converge ; results are recorded. Based on figure 4 ; minimum and maximum amount of grid loading are happened in 6 and 18 hours at afternoon respectively. So generated power in all of DGs were presented in one converge stage at 6 A.M according to figure 5.
Figure 5 : DGs random total power at 6 A.M.
Figure 5 show DGs total output and random amounts at 6 A.M. for ON state in every Monte Carlo experiment. Figure 6 relate to DGs penetration converged level at 6 A.M and 6 B.M. with maximum and minimum network loading respectively. In 6 A.M and 6 B.M. hours , we have been regarded 2 different cases. In first case , DGs which they are located in random process and ON state generate total nominal 4 MV and it was determined with “ Rated DG Power” on curve. DGs penetration converged amount in all of times is equal with 22/26 MW. In second case , DGs with On state , don’t generate total nominal power and U amount in studied time ( assumption parts) can less than 1 in random form.
Figure 6 : DGs converged penetration surface in 6 A.M and 6 B.M. hours ( without any limitation)
This case was determined with “ Rated DG Power” on curve. DGs penetration converged amount in all of times is equal with 14 MW AND 16/41 MV.
DGs penetration converged amount in random conditions ( U1) were presented in Table 2 in all of hours at day-night.
16 Hour No. Mw amount Hour No. Mw amount Hour No. Mm amount
1 14/13 9 16/32 17 16/18
2 14/14 10 16/57 18 16/41
3 14/24 11 16/63 19 16/80
4 14/25 12 16/48 20 16/54
5 14/16 13 16/52 21 16/36
6 14/00 14 16/59 22 16/53
7 13/93 15 16/54 23 14/27
8 13/87 16 16/25 24 14/26
According to table 2 ; converged penetration surface for DGs random generated power in [0.5-1] range more than remained and rest hours in [0.3-1] range. To show real system function , we must be regard limitations in DGs Total penetration surface.
7.2. Scenario 2 :
In this case , there is one applied limitation on total generated power through DG. We assumed that maximum generated power in DGs units and every hour is equal 15%,25% and 35% of total consumed power in studied system distribution.
Table 3 : DGs penetration converged level per hours in scenario 2 ( 15% penetration level)
Hour No. Mw amount Hour No. Mw amount Hour No. Mm amount
1 5/80 9 6/07 17 10/59
2 5/21 10 6/80 18 10/24
3 4/93 11 7/90 19 10/42
4 4/54 12 8/40 20 9/36
5 4/57 13 8/84 21 8/33
6 4/64 14 9/47 22 7/98
7 5/23 15 8/91 23 6/79
8 5/33 16 9/67 24 6/08
According to table 3 ; DGs penetration converged level at 6 A.M and 6 B.M are equal with 4/64 MW and 10/24 MW respectively. It s necessary to mention that because of low level in grid loading ; DGs penetration level exit possibility is more than generation. At 6 B.M ; network load is equal with 54/02 MW. By accounting 15% for DG penetration level , we can observe and error and converged amount has validity in mentioned hour.
A) Maximum 25% penetration level in DGs:
In order to show DGs converged penetration level per hours in scenario 2 and load by regarding Maximum 25% penetration level , we can use table 4 .
Table 4 : DGs penetration converged level per hours in scenario 2 ( 25% penetration level)
Hour No. Mw amount Hour No. Mw amount Hour No. Mm amount
1 8/89 9 9/46 17 16/15
2 8/13 10 11/12 18 15/84
3 7/77 11 12/73 19 15/73
4 7/16 12 13/59 20 15/22
5 7/47 13 14/74 21 3/59
6 7/37 14 14/96 22 12/27
7 7/99 15 14/51 23 11/36
8 8/50 16 15/38 24 10/04
According to table 4 ; DGs penetration converged level at 6 A.M and 6 B.M are equal with 7/37 MW and 15/84 MW respectively. It s necessary to mention that because of low level in grid loading ; DGs penetration level exit possibility is more than generation. At 6 B.M ; network load is equal with 54/02 MW. By accounting 25% for DG penetration level , we can observe and error and converged amount has validity in mentioned hour.
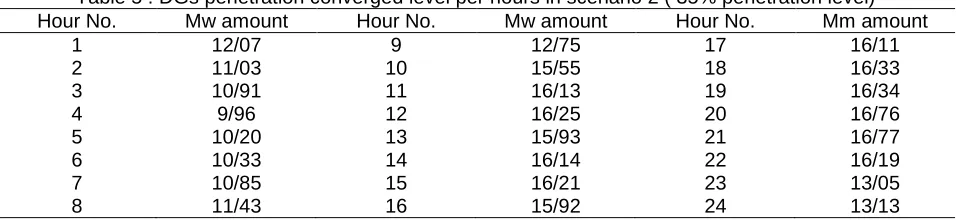
C) Maximum 35% penetration level in DGs:
17 Table 5 : DGs penetration converged level per hours in scenario 2 ( 35% penetration level)
Hour No. Mw amount Hour No. Mw amount Hour No. Mm amount
1 12/07 9 12/75 17 16/11
2 11/03 10 15/55 18 16/33
3 10/91 11 16/13 19 16/34
4 9/96 12 16/25 20 16/76
5 10/20 13 15/93 21 16/77
6 10/33 14 16/14 22 16/19
7 10/85 15 16/21 23 13/05
8 11/43 16 15/92 24 13/13
According to table 5 ; DGs penetration converged level at 6 A.M and 6 B.M are equal with 10/33 MW and 16/33 MW respectively. It s necessary to mention that because of low level in grid loading ; DGs penetration level exit possibility is more than generation. At 6 B.M ; grid load is equal with 54/02 MW. By accounting 35% for DG penetration level , we can observe and error and converged amount has validity in mentioned hour.
Obtained results for DG maximum level in 15%, 25% and 35% states in real system cause to passing power exit in lines outside allowable range. In some of lines we face with congestion and also it is necessary to regard thermal limitation.
7.3 Scenario 3 :
In this case , we regarded scenario 2 and feeder thermal limitations. 20 MVA maximum capacity in feeder by penetration condition determine combining calculation and converge situation.
In order to show converged amounts in DG penetration level per all of hours in day for 3 scenario with 15%, 25% and 35% maximum DGs , we can use 6 to 8 tables.
Table 6 : DG Penetration converged level per all of hours in day for 3 scenario with maximum 15% :
Hour No. Mw amount Hour No. Mw amount Hour No. Mm amount
1 5/62 9 5/90 17 12/93
2 4/94 10 6/75 18 13/97
3 4/99 11 7/80 19 14/64
4 4/67 12 8/47 20 9/35
5 4/73 13 8/66 21 8/52
6 4/49 14 9/96 22 7/94
7 4/79 15 8/95 23 7/18
8 5/35 16 9/24 24 6/03
Table 7 : DG Penetration converged level per all of hours in day for 3 scenario with maximum 25% :
Hour No. Mw amount Hour No. Mw amount Hour No. Mm amount
1 8/90 9 9/44 17 18/75
2 8/11 10 10.75 18 20/19
3 7/71 11 12/26 19 21/10
4 7/72 12 13/88 20 15/05
5 7/27 13 14/41 21 13/28
6 7/30 14 16/47 22 12/35
7 8/10 15 14/30 23 11/30
8 8/37 16 15/08 24 10/29
Table 8 : DG Penetration converged level per all of hours in day for 3 scenario with maximum 35% :
18
1 12/38 9 13/49 17 19/28
2 11/40 10 15/04 18 20/78
3 10/89 11 16/33 19 21/18
4 10/50 12 15/85 20 16/07
5 9/95 13 16/11 21 16/44
6 10.00 14 16/97 22 16/30
7 10.98 15 15/91 23 14/07
8 11/60 16 15/96 24 13/30
Results conclusion in 3 scenarios
According to presented results in 3 scenarios and based on 2 to 8 tables and observing limitations effectiveness in DGs converged penetration random level and conditions without any limitations , we can describe 7 to 9 figures. 3 penetration levels were regarded with maximum 15%,25% and 35% separately.
Figure 7 : DGs converged penetration level amounts in all of hours of day-night for 3 scenarios ( maximum 15% penetration)
19 9. Related results of grid statics function with/without DGs regarding:
In this part , we investigated shins voltage profile position , estimated amounts , random amounts per DGs converged penetration level. According to presented method and DGs generation power estimation as an uncertainty parameter , we can calculate converged voltage for every shin in all of hours per day- night times. Figures 11 to 13 show examples for estimated No.30 voltage as a last network and grid shin for 24 hours.
Figure 11: No.30 shin voltage size converged amount for all of hours by regarding 15% limitation in DGs penetration level and feeders thermal limitation
20 Figure 13 No.30 shin voltage size converged amount for all of hours by regarding 35% limitation in DGs penetration
level and feeders thermal limitation
Based on figures ; converged or estimated values improve significantly in No.30 shin voltage for 12 to 20 hour.
CONCLUSION
In current research , diversity products sustainable and optimum distribution grids were evaluated by Monte Carlo Simulation method based on smart information systems and aim of network or grid voltage profile improvement on IEEE standard with 30 shins.
The most highest percent for DGs penetration level in day different hours against to coordinated load in studied distribution region at 6 A.M is equal with 26% for 1 scenario. Load above in network distribution is equal with 54/02 MW in same hour. Also the most lowest percent is nearly 12/17% at 6 A.M. Load above in network distribution in mentioned region is equal with 129/12 MW in same hour. The most highest percent for DGs penetration level in day different hours against to coordinated load in studied distribution region at 6 A.M is equal with 13/73% for 2 scenario. Also the most lowest percent is nearly 12/15% at 6 A.M. During 17 to 20 hours interval ; output power by DG has significant increasing in 3 Scenario against 2 Scenario. In this case we don’t observe error in lines and there was not special security happening. By regarding lines thermal limitation along DGs penetration level we can recognize real results of power system behavior. By regarding No.30 voltage size without DGs , fluctuations are between [./972-1036]. After DG installation , fluctuations are reached to [./99-1/035]. Results importance can suitable for short circuit level estimation in every shin and possible power quality problems in system. Also we observe that , voltage position has significantly improvement in No.30 shin for 12 to 20 hour.
REFERENCES
Behnam Namvar Bahraghani , Mohammad agha Shafiei , Moein Abolghasemi , Mohammad Moradi Dalvand , Mohammad Ahmadian” Determining sub grids diversity generation resources optimum sizing independent of thermal and electrical loads providing by regarding investment costs effects ; Environmental exploiter “Iran electronics engineering journal , 12th year , No.12 ; 1394 Spring and Summer
El-Khattam ,Walid , Y.G.Hegazy , and M.M A. Salama , “ Anintegrated distributed generation optimization model for distribution system planning.” IEEE transactions on power systems20.2(2005) :1158-1165
Khalesi , N , N.Rezaei , and M-R Hghifam “ DG allocation with application of dynamic programming for loss reduction and reliability improvement.” International Journal of Electrical Power & Energy Systems 33.2(2011):288-295 Khalesi , N , N.Rezaei , and M-R Hghifam “ DG allocation with application of dynamic programming for loss reduction
and reliability improvement.” Electrical Power & Energy Systems vol.33.2(2011):288-295, 2011
M.F.Shaaban , Y.M. Atwa and E.F. El-Saadany , “DG allocation for Benefit Maximization in distribution Networks,” IEEE Trans , Power Syst, vol.28 , pp.639-649, May 2013
21 Mehdi Prvizi Mosaed , Farid Farmani , Amjad Anvari Moghaddam , Ashkan Rahimi Kian , Hasan Monsef “ Placement
and multipurpose and optimized siuzing of renewable energy generators in distribution grid by regarding load model” Iran electronics engineering journal , 12th year , No.12 ; 1394 Spring and Summer
Naderi , Ehsan , Hossein , Seifi , and Mohammad Sadeg Sepasian . “A dynamic approach for distribution system planning considering distributed generation. “ IEEE Transactions on Power Delivery 27.3 (2012) :1313-1322 O.Alsac and B.Scott , (1974) , ‘’ Optimal Load Flow with Steady-State Security , “IEEE Transactions on Power System
Apparatus and Systems , Vol.PAS-93 , No.3 , pp. 745-751.
Saeed Soleimani , Shahram Jadid “ Smart distribution grid optimization exploit in presence of diversity generation resources” Iran electronics engineering journal , 12th year , No.12 ; 1394 Spring and Summer
W.F. Tinny and C.E. HART,” Power flow solution by Newton’s method ; IEEE Trans .PAS86 , pp.1449-1456 , 1967 Z.Moravej and A.AKHLAGHI , “A novel approach based on cuckoo search for DG allocation in distribution network.”