62 CC: Creative Commons License, 2016.
Modelling E-Government Development through the
Years Using Cluster Analysis
Renata Machova*, Martin Lnenicka**
*University of Pardubice, Czech Republic, [email protected] **University of Pardubice, Czech Republic, [email protected]Abstract: Every e-government development has its supporting factors and various limitations that hinder the implementation of government initiatives and further improvement of e-services. This paper examines and evaluates the specific challenges, trends and the progress of e-government between the years 2008 and 2014 in the European Union Member States based on the global e-government development indices. It is focused on the effects and consequences of the European recession, which started as the global financial crisis in 2007 and was followed by the European debt crisis since the end of 2009. The purpose of this research is to understand the influence of selected indicators on the development of e-government in order to uncover similarities and identify areas that were affected by the crisis a need improvement. The findings can be used to introduce more efficient measurements and benchmarking frameworks of the e-government development. The methods used are descriptive, correlation and cluster analysis.
Keywords: e-government, development indices, benchmarking frameworks, European Union, European recession, cluster analysis
Acknowledgement: The authors received financial assistance from the Student Grant Competition of the University of Pardubice No. SGS_2016_023.
1.
Introduction
63 CC: Creative Commons License, 2016. governments) is prepared to participate in using modern ICT. However, nowadays these terms are mostly used as synonyms (European Commission, 2015; International Telecommunication Union, 2015; United Nations, 2014; World Economic Forum, 2015).
With the need of cost savings in the public sector, e-government is one of the possible options to operate more effectively and transparently, to provide better, cheaper and faster services to the public and to facilitate the interaction between government, citizens and businesses, and other institutions, especially through various official web portals. Many countries, regions and local authorities have put in place e-government initiatives and ICT applications for the people to improve public sector efficiency and streamline governance systems to support sustainable development (International Telecommunication Union, 2015; United Nations, 2014; World Economic Forum, 2015). They are constantly transforming into the new forms of e-government to increase their performance and reinforce and maintain their positions in the global competition (Gupta & Jana, 2003; Lnenicka, 2015; Machova & Lnenicka, 2015b). E-government is an important application field for the transformations that governments are undergoing and is required to be solved. Therefore, in recent years, many researchers have focused on the current trends of e-government, measurement of e-government services and deployment of various e-government models to help governments achieve these goals.
The existing models of e-government evolution suggest a linear progression from basic web publishing to fully integrated, advanced and matured e-government, where each successive stage of e-government is better than the previous one. Governments have to proceed through each stage (step) in a series (García-Sánchez et al., 2012; Krishnan et al., 2013). As for the development of e-government services, the establishment of collective goals can be viewed as corresponding to the definition of resources available, and the way in which they may be allocated. These goals can be established internally, based on the government, and externally, based on the user (Montargil, 2010). However, this potential only can be realized if users (mostly citizens and businesses) are willing and able to adopt the e-services offered by the government. While e-services offer a number of benefits that realize its potential by engaging all relevant users, others who lack technology skills and have a low level of education are often excluded from these benefits (United Nations, 2014). Among them, data protection and privacy has the strongest impact on the citizen engagement in e-government. This is closely related to trust in government since the government is responsible from protection of the data transmitted. The next two important indicators influencing the use of e-services are security and reliability of systems. Considering the financial crisis and worldwide data scandals, it is an important signal to the e-government development (Akkaya et al., 2011).
on-64 CC: Creative Commons License, 2016. going financial crisis, low growth, unemployment and aging population has led Europe to actively seek innovative solutions in order to remain competitive, restore growth and to be able to continue to offer a wide-range of public e-services.
As governments develop e-government systems to offer such enhanced services to citizens and businesses, further assessment efforts are required to measure the effectiveness of the e-government development (Kao, 2015; Siskos et al., 2013). E-e-government assessment is meant to guide development efforts by providing some suitable tools for comparison and gauging progress. It is important to develop and conduct e-government assessment so that the results can be leveraged to catalyze action and improve global competitiveness (Ghavamifar et al., 2008). The main benchmarking frameworks and e-government rankings are increasingly important as they guide countries’ focus of their e-government initiatives. They are in a process of maturation in that direction, moving from purely measuring web sites to assessing use and government qualities. There are a number of these rankings and indices. Each model measures how ready a society or economy is to benefit from ICT. However, the range of tools uses widely varying definitions and different methods for measurement (Machova & Lnenicka, 2015b; Mohammed & Ibrahim, 2013). Some of them have become frequently cited and used as benchmarks, guiding the debate as well as governments’ investments in government (Grönlund, 2011). Reliable, relevant and valid e-government measurement and benchmark can offer crucial notices to point policy makers and practitioners in the right direction (Nardo et al., 2008). Therefore, it is very important to identify success variables and indicators for successful e-government development. The main objective of this paper is formulated in the context of the considerations mentioned above.
2.
Literature Review and Background
Research on e-government can be classified into three broad streams – development, adoption and implementation, and impact on stakeholders, particularly citizens (Krishnan et al., 2013). The following review is mostly focused on the first stream.
2.1.
E-Government Development Indices
65 CC: Creative Commons License, 2016. changed over time. In a global perspective, frequently cited indices include the UN E-government rankings (which covers the period from 2003 to 2014), i.e., the E-government Development Index (EGDI) and the E-Participation Index (EPI), the Economist’s E-government readiness and digital economy rankings (from 2000 to 2010), Brown university’s global e-government report (only between 2000 and 2007), Waseda E-government ranking (2005–2015), World Economic Forum’s (WEF) index (cover the period from 2002 to 2015), i.e., Networked Readiness Index (NRI), and International Telecommunication Union’s (ITU) index (2009–2015), i.e., ICT Development Index (IDI). The early 2010s has added new indices to the e-government development research, which are focusing on the new trends in ICT such as cloud computing, open data, big data, social media, etc. These are, e.g., the Asia Cloud Computing Association’s (ACCA) Cloud Readiness Index (CRI), Business Software Alliance (BSA) Global Cloud Computing Scorecard, the Web Index and the Open Data Barometer (ODB) index produced by the World Wide Web Foundation (W3F), the OURdata Index by the Organization for Economic Co-operation and Development (OECD) or Open Knowledge Foundation’s (OKF) Global Open Data Index (GODI). However, some of these indices cannot be used to evaluate the e-government development through the years, either because there is a big time gap between the existing reports or because they only cover selected countries. A comprehensive comparison and taxonomy of benchmarking frameworks can be found e.g., in Bannister (2007). The most recent description of the progress of these frameworks’ structure in the world can be found in Machova and Lnenicka (2015b).
66 CC: Creative Commons License, 2016. (International Telecommunication Union, 2015). Their framework is based on the claim that the benefits of cloud computing for e-government will reduce the need for some requirements, while the challenges impose more attention to others. Some indicators will get low weight and others will get high weight or even new indicators or variables could by introduced.
In this fast-changing digital era, one of the key challenges in measuring the e-government development is using emerging technologies and data sources, such as those associated with cloud computing, open data, big data, social media, multichannel web portals or m-government, to better provide timely and relevant evidence for policy-making, and enable greater consistency in the public services (European Commission, 2015; International Telecommunication Union, 2015; United Nations, 2014; World Economic Forum, 2015). A new benchmarking framework to evaluate e-government development using these new trends in ICT was proposed and implemented in Machova and Lnenicka (2015a).
2.2.
E-Government Development and Related Indicators
Wilkinson and Cappel (2005) utilized content and correlation analysis to determine whether the variables of economic prosperity and population had any significant effect on predicting the extent of country e-government involvement. Their results showed a significant correlation between the variables. The level of resources and size of a country appeared to be associated with the extent to which it delivered services via the web, meaning the larger a county was in terms of income and population, the greater was its e-government involvement. Along similar lines, Mazengera (2011) also used the correlation analysis to identify indicators contributing to successful e-government development. This research study has revealed that there is the correlation between internet use and the number of cell phones, but a very low correlation with the literacy level. However, it did not consider other softer aspects that may impact the uptake and use of e-services such as social background, income levels, etc. Seri et al. (2014) also investigated indicators explaining different performances of public e-services in Europe at the country level using econometric analysis. Their results showed that e-government performance is loosely correlated with the broader level of socio-economic development in a country. However, the wealth of a country is not significant on its own. Indeed, increased gross domestic product (GDP) per capita has an impact on e-government performance only if it is first successfully translated into increased investment in ICT infrastructure. Broadband penetration and higher education are then the key drivers for most of the types of e-services and users (citizens and businesses). This conclusion is supported by the ITU which claims that there is a strong and significant correlation between GDP per capita and the percentage of a country’s population living in urban areas. This suggests that the concentration of population in urban areas, where costs of infrastructure investment are lower than in rural areas, could be another significant factor (International Telecommunication Union, 2015).
67 CC: Creative Commons License, 2016. development scenario in Saudi Arabia and compared it with the USA based on the E-government Survey reports between 2003 and 2010. The author used gap analysis to identify which indicators are more important and which indicators need attention in order to improve the EGDI and individual indicator group indices. Grönlund (2011) analyzed the quality of the UN’s EPI by validating it against other indices of government-citizen relations qualities, democracy, internet filtering, and transparency. The author found out, that the relation between the EPI and the other indices of democracy and participation was non-existent, even very undemocratic countries could score high on the EPI and countries where the internet use of citizens is severely obstructed by filtering could score high on the EPI by introducing technical tools on their web (Grönlund, 2011).
Krishnan et al. (2013) showed that ICT infrastructure, human capital and e-participation had a direct relationship with e-government maturity. Their results indicated that governance in a country, e.g., political stability, regulatory quality or control of corruption, did not significantly contribute to its government maturity, and their relationship was not mediated by e-participation. This conclusion is in line with prior research by García-Sánchez et al. (2012). They analyzed the factors which promote the e-government development in the national governments using a more suitable econometric methodology. Their results revealed that the sophistication of development runs parallel to the existence of a higher cultural status of the population as well as an evolution toward ethical and stable democracies. Furthermore, they detected an absence of any relation between the economic and political capacity of central government and the level of technological innovation in its online presence. The ITU (International Telecommunication Union, 2015) suggest that the e-government development should be measured through the application of a benchmarking framework consisting of at least legal, technical and organizational measures. For this purpose, they proposed a set of ICT indicators. However, even in the case of countries with highly advanced infrastructures and human resources, it can be difficult to move to the higher stages with transactional and connected services. It is clear that factors other than national income are equally important, including high-level political support and leadership, strengthened institutional capacity, public accountability and citizen engagement, as well as adequate e-government initiatives, ICT infrastructure and education (United Nations, 2014). An enabling telecommunication regulatory environment can also significantly influence the affordability of services. In this regard, public administrations could also contribute significantly by adopting open data policies for their Internet of Things (IoT) datasets (International Telecommunication Union, 2015).
2.3.
E-Government and the European Recession
68 CC: Creative Commons License, 2016. of each Member State underwent many changes, especially in terms of revenue structure and expenditure destination (Dornean & Sandu, 2013).
Goulas and Kontogeorga (2013) reviewed the state of the art of the e-government development in Greece, where the consequences of the financial crisis gave additional motivation to use decentralization to make local self-government more efficient. Along similar lines, Dornean and Sandu (2013) also analyzed the main effects of the global financial and economic crisis on the EU budget. Their findings suggested that the budgetary deficit and the unemployment rate had a highly significant influence on community expenditure growth during the crisis. On the other hand, the GDP growth and public debt did not have any significance for the growth. In order to increase citizens’ satisfaction with public administration, e-government should help to ensure a unified approach that will change the traditional public service delivery – switching from a service provider’s point of view to the people oriented perspective (Dumpe & Arhipova, 2012). Kotatkova-Stranska and Lelek (2012) analyzed the similarity of the EU Member States on the evolution of selected variables (e.g., real GDP growth rate in percentage, employment rate in percentage, inflation rate in percentage, etc.) which can show the integration process success. They used cluster analysis and compared the data before and after the financial crisis (the period 2004–2008 and the period 2009–2010). Their results showed that GDP growth rates significantly dropped during the crisis. Especially those, which had have the highest growth rate in the previous period such as Latvia or Estonia.
These results correspond with other studies, which have shown that there is a need for conducting cross-country comparison to identify the contributing factors in the e-government development and its maturity. There is also support for the claim that the GDP, unemployment and inflation rate are significant factors to evaluate successful e-government development. However, relatively few studies have addressed the influence of the European recession in the context of e-government.
3.
Problem Identification and the Hypotheses Statement
69 CC: Creative Commons License, 2016. The main aim of this paper is to compare the change of e-government and information society indicators, which are represented by the e-government development indices in the EU Member States between 2008 and 2014. The authors’ attention is concentrated not only on the progress of these indices and their components but especially on the influence of the financial crisis and the Eurozone crisis.
To achieve this aim, the following tasks are defined:
a) to analyze the e-government development indices in the past and present; b) to examine the changes of these indices through the years;
c) to select the suitable variables and propose a model for the evaluation of the e-government development;
d) to identify the groups of the EU Member States in the selected years.
According to the above defined aim and also the literature review authors formulated four hypotheses. Their validity will be examined by using multivariate statistical methods.
H1: After a decline in 2010, there will be an increase in the upcoming years 2012 and 2014 based on the EGDI.
H2: The decline in the “old” Member States in 2010 will be lower than in the “new” Member States based on the EGDI.
H3: There is a significant similarity in the development of the Eurozone Member States, therefore, they will be clustered together in 2014.
H4: Denmark is the best Member State in the e-government development through the years as suggested by the comparison of related indices (EGDI, NRI and IDI).
The first part of this paper explores existing literature on e-government development and highlights assumptions and assertions around the structure of related benchmarking frameworks to make recommendations on the selection of the most suitable indicators. It is followed by the problem identification and the hypotheses statement. The research study consists of descriptive, correlation and cluster analysis over the set of obtained data. The last part then contains results and recommendations for the further research.
Descriptive, correlation and cluster analysis are conducted to examine the relationships and validate the hypotheses. The main tools used are the statistical software Statistica 10 and Microsoft Excel 2010.
4.
Research Methodology and Data Analysis
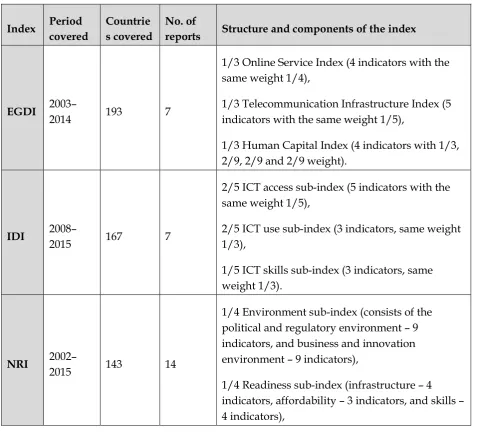
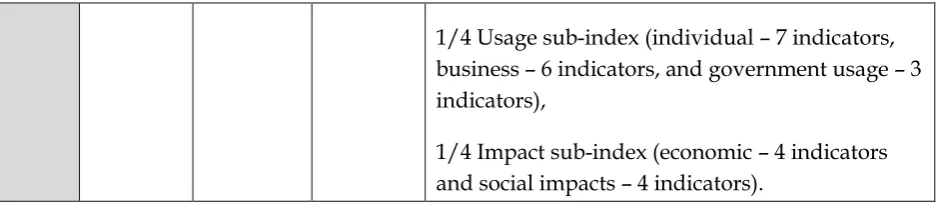
70 CC: Creative Commons License, 2016. government websites, Telecommunication Infrastructure Index (TII) and Human Capital Index (HCI). The EPI is then focused on the use of online services to facilitate provision of information by governments to citizens, interaction with stakeholders and engagement in decision-making processes (United Nations, 2012; United Nations, 2014). The WEF’s NRI measures the propensity for countries to exploit the challenges offered by ICT and has four sub-indices – environment, readiness, usage and impact (economic and social) (World Economic Forum, 2015). The ITU’s IDI is based on eleven ICT indicators, grouped in three clusters – access, use and skills (International Telecommunication Union, 2015). Consequently, the EGDI by the UN, the ITU’s IDI and the NRI by the WEF were chosen. A brief description of their structure is shown in the Table 1, including the weight of each component (if available). More about the weight calculation steps can be found in International Telecommunication Union (2015), United Nations (2014) and World Economic Forum (2015). Because the UN reports are published only every two years, in contrast to the WEF and ITU reports, the evaluated years are 2008, 2010, 2012 and 2014.
Table 1: Decomposition of the selected indices structure
Index Period covered
Countrie s covered
No. of
reports Structure and components of the index
EGDI 2003–
2014 193 7
1/3 Online Service Index (4 indicators with the same weight 1/4),
1/3 Telecommunication Infrastructure Index (5 indicators with the same weight 1/5),
1/3 Human Capital Index (4 indicators with 1/3, 2/9, 2/9 and 2/9 weight).
IDI 2008–
2015 167 7
2/5 ICT access sub-index (5 indicators with the same weight 1/5),
2/5 ICT use sub-index (3 indicators, same weight 1/3),
1/5 ICT skills sub-index (3 indicators, same weight 1/3).
NRI 2002–
2015 143 14
1/4 Environment sub-index (consists of the political and regulatory environment – 9 indicators, and business and innovation environment – 9 indicators),
71 CC: Creative Commons License, 2016. 1/4 Usage sub-index (individual – 7 indicators, business – 6 indicators, and government usage – 3 indicators),
1/4 Impact sub-index (economic – 4 indicators and social impacts – 4 indicators).
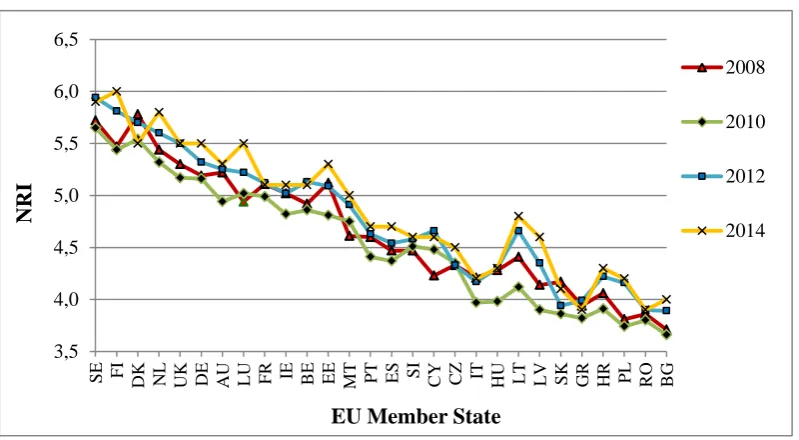
The progress of the selected e-government development indices through the evaluated years can be seen in the Figure 1 for the EGDI (range of the values is 0–1, where 1 is the best), in the Figure 2 for the IDI (range of the values is 1–10, where 10 is the best) and in the Figure 3 for the NRI (range of the values is 1–7, where 7 is the best). There can be identified a visible decline in 2010, only the IDI shows no significant decline in 2010. It is because of the structure of this index, which was not affected by the economic decline.
Figure 1: The progress of the EGDI between the years 2008–2014
0,45 0,50 0,55 0,60 0,65 0,70 0,75 0,80 0,85 0,90 0,95
DK SE UK NL FI DE FR EE AU BE IE LU ES IT MT SI PT LT HU CZ GR PL LV HR SK CY BG RO
E
G
D
I
EU Member State
2008
2010
2012
72 CC: Creative Commons License, 2016. Figure 2: The progress of the IDI between the years 2008–2014
Figure 3: The progress of the NRI between the years 2008–2014
4.1.
Variables Selection and Data Preparation
The next step was the indicators (variables) selection. They were selected based on the structure comparison of indices in the Table 1 and the literature review focusing on the European recession. The proposed model, which is represented as a hierarchy of the variables including categories, is summarized in the Table 2. The gross enrollment ratio may be greater than 100% because of grade repetition and entry at ages younger or older than the typical age at that grade level. Also the ICT infrastructure and broadband quality variables may be greater than 100 per 100 inhabitants.
4,0 4,5 5,0 5,5 6,0 6,5 7,0 7,5 8,0 8,5 9,0
SE DK LU NL FI UK DE FR AU IE BE EE ES SI MT IT GR PT LV CZ LT HR PL HU SK CY BG RO
IDI
EU Member State
2008
2010
2012
2014
3,5 4,0 4,5 5,0 5,5 6,0 6,5
SE FI DK NL UK DE AU LU FR IE BE EE MT PT ES SI CY CZ IT HU LT LV SK GR HR PL RO BG
NRI
EU Member State
2008
2010
2012
73 CC: Creative Commons License, 2016. Table 2: Hierarchy of the variables for the modelling of the e-government development
Variable’s
number Variable’s name and category Data source Range of the values
1. ICT environment and usage strategy
X1 Laws relating to the ICT WEF 1–7 (best)
X2 Intellectual property protection WEF 1–7
X3 Availability of latest technologies WEF 1–7
X4 Accessibility of digital content WEF 1–7
2. ICT readiness, businesses and citizens’ skills
X5 Adult (15+) literacy rate (%) UNESCO 0–100
X6 The combined primary, secondary, and tertiary gross enrolment ratio (%) UNESCO no fixed range
X7 Quality of educational system WEF 1–7
X8 Firm-level technology absorption WEF 1–7
X9 Global competitiveness index WEF 1–7
X10 EPI UN 0–1 (best)
3. ICT infrastructure and broadband quality
X11 Main fixed telephone lines (Fixed telephone
subscriptions) per 100 inhabitants ITU
no fixed range X12 Mobile cellular telephone subscriptions per 100 inhabitants ITU no fixed range
X13 Percentage of households with a computer ITU 0–100
X14 Percentage of households with Internet access ITU 0–100
X15 Percentage of individuals using the Internet ITU 0–100
X16 International Internet bandwidth (bit/s) per Internet user ITU no fixed range
X17 Fixed (wired) broadband subscriptions per 100
inhabitants ITU
no fixed range X18 Wireless broadband subscriptions per 100 inhabitants ITU no fixed range 4. Government online services
X19 ICT use and government efficiency WEF 1–7
X20 E-service delivery stage 1 – Points for emerging
presence UN 0–100
X21 E-service delivery stage 2 – Points for enhanced presence UN 0–100
X22 E-service delivery stage 3 – Points for transactional presence UN 0–100
X23 E-service delivery stage 4 – Points for networked (connected) presence UN 0–100
74 CC: Creative Commons License, 2016. i.e.; unified the number of decimal places, a dot was chosen as a decimal mark, checking for missing and unreliable entries, etc.
Descriptive statistics deals with methods of the collection, organizing, summarizing, and presenting of data. This is usually the first part of a statistical analysis. Descriptive data analysis is needed to help visualize the data and get a sense of their values, i.e., plot graphs and compute summary statistics to observe the trends and the distribution of the data, and hence, the scale that researchers are dealing with (Cohen et al., 2003). Therefore, a data dictionary was created to describe the variables and their values for the evaluated years. The analysis of the descriptive statistics was performed using the Data Analysis tool in Excel. The next step was the comparison of the relevant statistics between the years 2008, 2010, 2012 and 2014. It helped to form the basis of the initial description of data as part of a more extensive statistical analysis, which will be followed later in this paper.
4.2.
Correlation and Cluster Analysis
Correlation analysis is used to identify and measure the statistical significance of the relationship that may exist between the two variables. The results indicate the strength of the relationship between the predictor and criterion variable. No causal effect is implied. In addition, the correlation coefficient is unable to measure the difference in size between two variables. A correlation matrix is a symmetric matrix where the entry in the ith row and jth column is the correlation between variable i and j (Cohen et al., 2003; Everitt et al., 2011).
Cluster analysis techniques are concerned with exploring datasets to assess whether or not they can be summarized meaningfully in terms of a relatively small number of groups or clusters of objects or individuals which resemble each other and which are different in some respect from individuals in other clusters (Everitt et al., 2011). A non-hierarchical clustering k-means method and hierarchical algorithms have been applied in this research study. These methods belong to the group of unsupervised learning methods, and also clustering (Bandyopadhyay & Saha, 2013). In hierarchical clustering, the data are not partitioned into a particular number of classes or clusters at a single step. Popular techniques in the hierarchical category are the single linkage, complete linkage, and average linkage algorithms. In the case of the k-means algorithm, initial cluster centers are set first and then the samples, which are located within a given distance from the center of the cluster, are assigned to the cluster (Bandyopadhyay & Saha, 2013; Everitt et al., 2011).
75 CC: Creative Commons License, 2016. d(𝑥𝑖, 𝑥𝑗) = √∑𝑛𝑘=1(𝑥𝑖,𝑘− 𝑥𝑗,𝑘)2 (1)
Here xi,k and xj,k are the values of the sample i or the sample j, for the attribute k = 1,2, ..., n.
Then, all data matrices were uploaded into the statistical software Statistica and the correlation matrix was conducted, because the variables have to be uncorrelated with each other. Correlations greater than 0.5 are statistically significant (Everitt et al., 2011). It happened in the case of the variables of the first category for all the years, when the highest values were found in 2008 and 2010. As a result, the variable number 3 was removed. Also the significant correlation higher than 0.8 was found between the variables number 8 and 9, thus, the variable number 9 was removed. Finally, the variables number 20 and 21 representing the first two stages of the e-government maturity model by the UN were also removed. Further, the standardization was performed with modified data matrices (28x19).
The next step here was the initial setup of the centers of the clusters, which was carried out using a hierarchical single linkage algorithm and Ward’s minimum variance method, which enables the efficient functioning of the k-means algorithm and reduces the possibility of the error function being stuck at the local minimum (Bandyopadhyay & Saha, 2013; Everitt et al., 2011). Hierarchical clustering produced by either the agglomerative or divisive route may be represented by a two-dimensional diagram known as a dendrogram, which illustrates the fusions or divisions made at each stage of the analysis. Compared to the hierarchical single linkage the Ward’s method provides a key contribution to the variance rather than the distance of the samples. This is reflected in the different shape of the dendrogram (Bandyopadhyay & Saha, 2013; Everitt et al., 2011).
In non-hierarchical algorithms (such as k-mode or k-means algorithms) the samples are a predetermined number of clusters. The key step here is the initial setup of the centers of the clusters (in this paper carried out using the Ward’s method), which enables the efficient functioning of the k-means algorithm and reduces the possibility of the error (utility) function being stuck at the local minimum (Bandyopadhyay & Saha, 2013; Everitt et al., 2011). The aim of k-means algorithm is to minimize the utility function J, which can be defined as follows in the equation (2):
J = ∑𝑛𝑗=1∑𝐾𝑘=1𝑢𝑘,𝑗‖𝑥̅𝑗− 𝑧̅𝑘‖2 (2)
Here uk,j is equal to 1 if the jth point belongs to cluster k, and 0 otherwise; 𝑧̅𝑘 denotes center of the cluster k, and 𝑥̅𝑗 denotes the jth point of the data. In k-means, cluster centers are first initialized to K randomly chosen points from the dataset (Bandyopadhyay & Saha, 2013).
76 CC: Creative Commons License, 2016. Table 3: Clustering in 2008, 2010, 2012 and 2014 using k-means algorithm
2008
Cluster 1 Austria Denmark Estonia Finland Germany
Luxembourg Netherlands Sweden United Kingdom
Cluster 2 Belgium France Ireland Slovenia Spain
Cluster 3 Bulgaria Greece Romania
Cluster 4 Croatia Czech
Republic Hungary Italy Latvia
Lithuania Poland Slovakia
Cluster 5 Cyprus Malta Portugal
2010
Cluster 1 Austria Finland Luxembourg Portugal Sweden
Cluster 2 Belgium Denmark Estonia France Germany
Ireland Netherlands Slovenia Spain United Kingdom
Cluster 3 Bulgaria Romania
Cluster 4 Croatia Czech Republic Greece Hungary Italy
Latvia Lithuania Poland Slovakia
Cluster 5 Cyprus Malta
2012
Cluster 1 Austria Denmark Estonia Finland Germany
Luxembourg Netherlands Sweden United Kingdom
Cluster 2 Belgium France Ireland
Cluster 3 Bulgaria Romania
Cluster 4 Croatia Greece Italy Latvia Poland
Slovakia
Cluster 5 Cyprus Czech Republic Hungary Lithuania Malta
Portugal Slovenia Spain
2014
Cluster 1 Austria Estonia Finland Luxembourg Malta
Sweden
Cluster 2 Belgium Denmark France Germany Ireland
Netherlands Portugal Spain United
Kingdom Cluster 3 Bulgaria Romania
Cluster 4 Croatia Czech
Republic Hungary Italy Latvia
Lithuania Poland Slovakia Slovenia
Cluster 5 Cyprus Greece
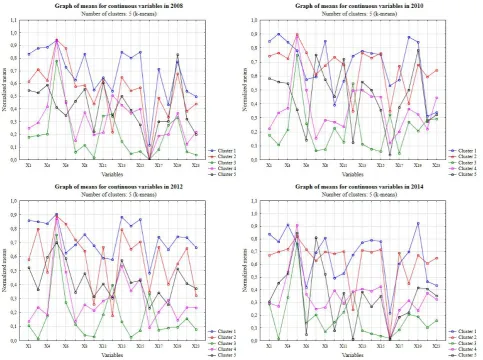
77 CC: Creative Commons License, 2016. the investigated indicators, can be found in 2010 and 2014. The concrete results are presented in the next section.
Figure 4: Graphs of means for variables in 2008, 2010, 2012 and 2014
5.
Results and Discussion
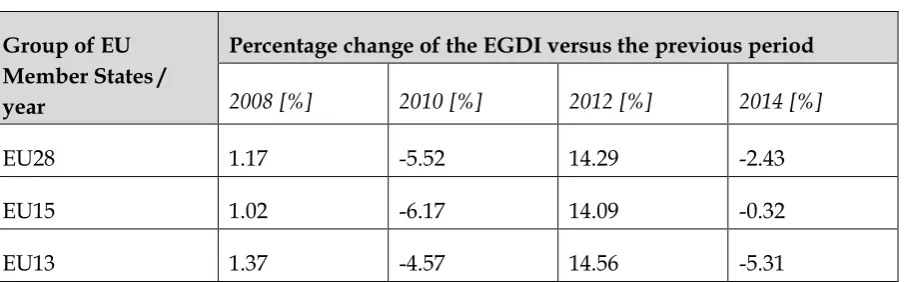
Based on the results of the descriptive analysis, there is a decline between 2008 and 2010 and again between 2012 and 2014. Only the mean value of the estimated internet users per 100 inhabitants has increased as well as mobile subscribers per 100 inhabitants. The mean value of the EGDI has increased about 15% (the EPI even about 75%) from 2008 to 2014 and the range has decreased about 5% (the EPI about 16%), which means that the differences in the e-government development between the EU Member States are minor through the years.
78 CC: Creative Commons License, 2016. Table 4: A percentage change of the EGDI in the evaluated years
Group of EU Member States / year
Percentage change of the EGDI versus the previous period
2008 [%] 2010 [%] 2012 [%] 2014 [%]
EU28 1.17 -5.52 14.29 -2.43
EU15 1.02 -6.17 14.09 -0.32
EU13 1.37 -4.57 14.56 -5.31
The results of the clustering with the k-means algorithm are presented in Table 3. Cluster 1 represents the EU Member States associated with the best ICT environment (with the accessibility of digital content as the most significant variable) and ICT infrastructure (with the percentage of individuals using the Internet as the most significant variable) in 2008. Cluster 2 represents the EU Member States with the best ICT readiness 2008 with the combined gross enrolment ratio as the most significant variable affecting the composition of this cluster. The best government online services were offered in the EU Member States of clusters 1, 2 and 5, where ICT use and government efficiency was the most important variable. In 2010, there were two clusters with only two EU Member States. A similarity between the cluster 1 and 2 was found again, but the relationship strength between them is weaker than in the previous period, i.e., 2008. These clusters performed well in all evaluated categories. However, there was a decline in the ICT readiness, especially for the firm-level technology absorption and the global competitiveness index. Also government online services decreased compared to the previous evaluated period. Only the ICT infrastructure and broadband quality remained steady in this period, with the exception of the cluster 4, where it was slightly increased.
Belgium, France and Ireland created a single cluster in 2012, which can be described as the ICT readiness focused on businesses, where these Member States achieved the best values. Portugal and Spain moved to cluster 5 along with Cyprus, Hungary, Slovenia, etc. The main reason was the decline in the ICT environment and usage strategy and related variables. In addition, the similarity was found between cluster 4 and 5, only the cluster performed worse in government online services. Although there was no significant decline in the measured categories, this period is characterized by the regrouping of the clusters’ members compared to the previous periods. In 2014, Greece is in the cluster 5 with Cyprus. Bulgaria and Romania are still together in the cluster 3. The best performing EU Member States can be found in cluster 1 and in cluster 2 (the best government online services, especially the fourth delivery stage).
79 CC: Creative Commons License, 2016. after 2010. The EU Member States in southern Europe were affected by the economic crisis very deeply; however, the e-government development was not much influenced by the crisis (with the exception of Greece). Italy was in cluster 4 for all the evaluated years together with Croatia, Latvia, Poland, etc. Spain and Portugal returned to cluster 2 in 2014. Only Greece is still on the same level with Bulgaria, Cyprus or Romania. The EU Member States in central Europe did not show any significant progress in the e-government development through the evaluated years compared to the other EU Member States. Another important finding is that the variable number 5 (adult literacy rate) and 16 (international Internet bandwidth) have no significant importance in the clustering with the k-means algorithm. Therefore, they may be removed from the model in the further research.
The results also show similarity in the Eurozone. In 2014, almost all the Eurozone members are in the clusters 1, 2 and 5 including Denmark, Sweden and United Kingdom, which obtained special opt-outs in the original Maastricht Treaty. Only Latvia and Lithuania are in cluster 4 and as a result, H3 is rejected. The EU Member States with the best values through the years is Sweden, not Denmark, which can be also seen from Figures 1, 2 and 3. The hypothesis H4 is not true and it
is rejected.
Although the majority of the governments in the region report that the crisis has not had an impact on their level of e-government (United Nations, 2014), the results of this research study showed that after a decline between 2008 and 2010 there was again a drop between 2012 and 2014. However, it was measured mostly in the “new” Member States, where only half of them are the Eurozone Member States, so this topic should be explored further. Therefore, the use of other variables could affect the results of this research study.
The variables, which were affected the most by the crisis represent mostly the ICT readiness, businesses and citizens’ skills category, concretely firm-level technology absorption, global competitiveness index and the EPI. On the other hand, the variables in the ICT infrastructure and broadband quality category were not affected by the European recession. Therefore, the IDI did not report any significant decline through the years.
6.
Conclusion
80 CC: Creative Commons License, 2016. The aim and partial tasks of this paper have been completed successfully. The financial crisis and the Eurozone crisis have reflected in the e-government development. The results indicated that a decline can be found in 2010 and again in 2014, where the decrease was more significant in the “new” Member States. It can be also concluded that the continuing stagnation has affected mainly the Member States in Southern Europe. Although Croatia did join the EU on 1st July 2013, the strong similarity to the other Member States was found in 2008, 2010 as well as in 2012. The most successful EU Member States were in 2008 in cluster 1, in 2010 in cluster 1 and also cluster 2 as well as in 2012 and 2014.
On the other hand, it can be assumed that if a Member State has found an approach which resisted the downturn, then the next time it will probably be used again. The delivery of contents and application via online services and mobile services, using cloud computing technologies, social media, providing access to open government data as well as the big data processing and other innovations of this sort must be supported and made available to all segments of society. In order to identify the most efficient ways of providing services, it is necessary to evaluate service availability and the cost of providing various groups of services.
The results of this study may allow policy makers to put their countries’ achievements into context and also help governments set realistic targets and track and evaluate developments over time, by benchmarking them to other countries. The groups of the EU Member States with the measured similarities in the clusters may be used in the context of the financial instruments of the EU’s Regional policy or the Digital Agenda to set new targets and requirements for this funding period in terms of quality, openness and completeness. In addition, the other European states could be clustered together with the EU Member States.
For the future research methodology it was confirmed that Ward’s method and k-means algorithm provide an appropriate mechanism for the connection of variables into the appropriate groups as the most common grouping of the EU Member States based on the level of the e-government development and related variables. Further research may also provide lawmakers with the ability to make more informed decisions on these problems so users can be better served. Finally, it may be possible that some of the relationships among the studied variables can vary between different groups of citizens. Further studies can explore moderating variables, e.g., users versus non-users of e-government services, younger versus older citizens, or frequent internet users versus non or low internet users.
References
Akkaya, C., Obermeier, M., Wolf, P. & Krcmar, H. (2011). Components of Trust Influencing eGovernment Adoption in Germany. In Janssen, M., Scholl, H.J., Wimmer, M.A. and Tan, Y.-H. (eds.), Electronic Government (pp. 88–99). Berlin Heidelberg: Springer-Verlag.
81 CC: Creative Commons License, 2016. Bandyopadhyay, S., & Saha, S. (2013). Unsupervised Classification: Similarity Measures, Classical and
Metaheuristic Approaches, and Applications. Berlin Heidelberg: Springer-Verlag.
Bannister, F. (2007). The curse of the benchmark: an assessment of the validity and value of e-government comparisons. International Review of Administrative Sciences, 73(2), 171–188.
Bui, T. X., Sankaran, S., & Sebastian, I. M. (2003). A framework for measuring national e-readiness. International Journal of Electronic Business, 1(1), 3–22.
Chu, P., & Sun, Y. (2013). A Prospective Survey on Future e-Governance Research Directions. In Proceedings of the 13th European Conference on eGovernment (ECEG 2013) (pp. 127–134). Reading: Academic Conferences and Publishing International Limited.
Cohen, J., Cohen, P., West, S. G., & Aiken, L. S. (2003). Applied Multiple Regression/Correlation Analysis for the Behavioral Sciences. New Jersey: Lawrence Erlbaum Associates.
Dornean, A., & Sandu, A. (2013). The Effects of the Current Global Economic and Financial Crisis on the EU Budget. Transylvanian Review of Administrative Sciences, 40E, 35–48.
Dumpe, D., & Arhipova, I. (2012). The e-Government Readiness in Latvia: Past and Present. Information Technology and Management, 15, 93–98.
European Commission. (2015). Future-proofing eGovernment for a Digital Single Market. Luxembourg: Publications Office of the European Union.
European Commission. (2012). The European Union explained Europe 2020: Europe’s growth strategy. Luxembourg: Publications Office of the European Union.
Everitt, B. S., Landau, S., Morven, L., & Stahl, D. (2011). Cluster Analysis. London: Wiley.
Fratzscher, M. (2012). Capital Flows, Push versus Pull Factors and the Global Financial Crisis. Journal of International Economics, 88(2), 341–356.
García-Sánchez, I., Cuadrado-Ballesteros, B., & Frías-Aceituno, J.-V. (2012). Determinants of E-Government Development: Some Methodological Issues. Journal of Management and Strategy, 3(3), 11–20.
Ghavamifar, A., Beig, L., & Montazer, G. A. (2008). The Comparison of Different E-Readiness Assessment Tools. In Proceedings of the 3rd International Conference on Information and Communication Technologies: From Theory to Applications (ICTTA 2008) (pp. 1–5). Washington: IEEE.
Goulas, D. S., & Kontogeorga, G. N. (2013). How Did the Economic Crisis in Greece Affected the Steps in Applying E-Government at the First Degree Self Government of Greece. Journal of Governance and Regulation, 2(4), 7–12.
Grönlund, Å. (2011). Connecting eGovernment to Real Government - The Failure of the UN eParticipation Index. In Janssen, M., Scholl, H.J., Wimmer, M.A. and Tan, Y.-H. (eds.), Electronic Government (pp. 26– 37). Berlin Heidelberg: Springer-Verlag.
82 CC: Creative Commons License, 2016. International Telecommunication Union. (2015). Measuring the Information Society Report 2015. Geneva:
Telecommunication Development Bureau.
Janssen, D., Rotthier, S., & Snijkers, K. (2004). If You Measure it They Will Score: An Assessment of International eGovernment Benchmarking. Information Polity, 9(3), 121–130.
Kao, C. (2015). Evaluation and improvement of e-government: The case of European countries. In Proceedings of the Second International Conference on eDemocracy & eGovernment (ICEDEG 2015) (pp. 104–107). Washington: IEEE.
Klimesova, D., Konopasek, J., & Ocelikova, E. (2014). Pyramidal Objects and Comparing Objects Using Similarity Measures. International Journal of Mathematical Models and Methods in Applied Sciences, 8, 138– 145.
Kotatkova-Stranska, P., & Lelek, T. (2012). Analysis of European Union Cohesion. Scientific Papers of the University of Pardubice, Series D, Faculty of Economics and Administration, 18(24), 102–113.
Krishnan, S., Teo, T. S. H., & Lim, J. (2013). E-Participation and E-government Maturity: A Global Perspective. In Dwivedi, Y.K., Zinner Henriksen, H., Wastell, D. and De, R. (eds.), Grand Successes and Failures in IT: Public and Private Sectors (pp. 420–435). Berlin Heidelberg: Springer-Verlag.
Kurdi, R., Taleb-Bendiab, A., Randles, M., & Taylor, M. (2011). E-Government Information Systems and Cloud Computing (Readiness and Analysis). In Developments in E-systems Engineering (DeSE) (pp. 404– 409). Washington: IEEE.
Lnenicka, M. (2015). E-government Development Index and its Comparison in the EU Member States. Scientific Papers of the University of Pardubice - Series D, Faculty of Economics and Administration, 22(34), 75– 87.
Lorca, M. (2012). The Eurozone and the Economic Crisis: An Innovative SWOT Analysis. In Roy, J. (ed.), The State of the Union(s): The Eurozone Crisis, Comparative Regional Integration and the EU Model (pp. 85–102). Miami: Thomson-Shore.
Machova, R., & Lnenicka, M. (2010). Electronic Services of eGovernment in the European Union Countries. Scientific Papers of the University of Pardubice, Series D, Faculty of Economics and Administration, 15(17), 138–150.
Machova, R., & Lnenicka, M. (2015a). Reframing E-Government Development Indices with Respect to New Trends in ICT. Review of economic perspectives, 15(4), 383-411.
Machova, R., & Lnenicka, M. (2015b). Vývoj struktury hodnotících rámců pro měření rozvoje e-governmentu ve světě. Acta academica karviniensia, 15(1), 105–118.
Mazengera, B. (2011). Factors Contributing To Successful E-Government Implementation in Southern African Development Community (SADC) Countries. In Proceedings of the 16th IBIMA Conference on Innovation and Knowledge Management: A Global Competitive Advantage (pp. 1050–1057). Norristown: IBIMA Publishing.
83 CC: Creative Commons License, 2016. Montargil, F. (2010). E-Government and Government Transformation: Technical Interactivity, Political Influence and Citizen Return. In Nixon, P.G, Koutrakou, V.N. and Rawal, R. (eds.), Understanding E-Government in Europe: Issues and Challenges (pp. 61–77). New York: Routledge.
Nardo, M., et al. (2008). Handbook on Constructing Composite Indicators: Methodology and user Guide. Paris: OECD Publishing.
Pooran, P. N. (2010). Global Financial Crisis. World Economics, 11(3), 127–132.
Rebstock, R. J. (2013). Eurozone Debt Crisis. Retrieved April 14, 2016, from http://krex.k-state.edu/dspace/bitstream/handle/2097/16900/RemingtonRebstock2013.pdf
Seri, P., Bianchi, A., & Matteucci, N. (2014). Diffusion and usage of public e-services in Europe: An assessment of country level indicators and drivers. Telecommunications Policy, 38(5-6), 496–513.
Simurina, J., Hruska, D., & Markovic, J. (2008). E-Government in Croatia: A Comparative Analysis. WSEAS Transactions on Business and Economics, 5(5), 222–232.
Siskos, E., Malafekas, M., Askounis, D., & Psarras, J. (2013). E-government Benchmarking in European Union: A Multicriteria Extreme Ranking Approach. In Collaborative, Trusted and Privacy-Aware e/m-Services (pp. 338–348). Berlin Heidelberg: Springer.
United Nations. (2012). United Nations E-government Survey 2012: E-Government for the People. New York: UN Publishing Section.
United Nations. (2014). United Nations E-government Survey 2014: E-Government for the Future We Want. New York: UN Publishing Section.
Wilkinson, V. O., & Cappel, J. J. (2005). Impact of Economic Prosperity and Population on E-Government Involvement. Issues in Information Systems, 6(2), 204–209.
World Economic Forum. (2015). The Global Information Technology Report 2015: ICTs for Inclusive Growth. Geneva: SROKundig.
Yuming, W., & Hongyan, L. (2011). Optimization for Weight Design of the E-Government Development. In Proceedings of the 7th International Conference on Wireless Communications, Networking and Mobile Computing (WiCOM) (pp. 1–4). Washington: IEEE.
About the Authors
Renata Machova
Renata Machova is with the Institute of System Engineering and Informatics, Faculty of Economics and Administration, University of Pardubice, Czech Republic as a Lecturer. Her work currently focuses mainly on issues relating to e-government development, related indices and open government.
Martin Lnenicka