EFFECT OF STARTUP TIME ON TRANSIENT
PERFORMANCE OF A PROTOTYPE PUMP UNDER EXTRA
SMALL FLOW RATE CONDITIONS
Yingyu JI1, Yuliang ZHANG2,*
The startup process of pumps is indispensable. In order to reveal the transient behaviour of a prototype centrifugal pump during startup period, the hydraulic performance of three states of fast, medium, and slow startup is investigated under an ultra-small flow, and the transient characteristics of a self-priming pump during the startup process are revealed using three dimensionless coefficients. Results show that during startup, the order of the relative rise rate of parameters is as follows: flow, shaft power, and head. The flow curve presents two- and three-segment characteristics at fast startup and medium and slow startup, respectively. The inlet static pressure fluctuation is extremely violent at medium and fast startup. The outlet static pressure exhibits the pressure impact phenomenon at the end of the startup process at fast startup. The dimensionless flow coefficient generally shows the evolution law of descending initially then ascending. The dimensionless shaft power coefficient obtains the maximum value in the beginning of startup then decreases rapidly until the final stable value is reached. Pump similarity law is suitable for transient process performance prediction with a long startup time.
Keywords: self-priming pump, ultra-small flow, starting time, impact pressure, dimensional.
1. Introduction
In the past hundreds of years, the application of pumps was mainly in the steady state to achieve the transmission of fluid media. Therefore, research on pump performance focused on stabilizing the working conditions, that is, constant speed or constant working conditions, and abundant research results have been obtained.
In engineering, the transient performance of the pump unit in the fast start process is different from the steady-state performance in the steady state process, and its transient working characteristics can provide instantaneous hydrodynamic power for the pump system. However, the hydraulic excitation, impact load, and 1 Lecture, College of Mechanical Engineering, Quzhou University, China, e-mail:
2,*
Corresponding author, PHD., College of Mechanical Engineering, Quzhou University, China, e-mail: [email protected]
cavitation failure caused by the transient effect seriously affect the safe and stable operation of the pump device and piping system. Therefore, studying the transient hydraulic characteristics of the pump startup process and establishing the design, optimization, and application method of pumps suitable for transient working environments are of theoretical significance and engineering application value.
The startup process of centrifugal pumps generally requires the pump’s head to be raised and flow to the corresponding value in an extremely short period under the premise of ensuring reliability; this requirement is much more demanding than that in the steady-state process. In 1967, Streeter firstly studied the transient movements in pressure pipes and free surface flows [1]. In recent years, scholars have investigated the transient hydraulic characteristics of the centrifugal pump startup process. Tsukamoto et al. found that the dimensionless head and flow rate in the initial stage of startup gradually decrease until the steady-state curve is reached and the steady-state level is restored [2]. Lefebvre et al. found that the transient hydraulic characteristics of centrifugal pumps are inconsistent with quasi-steady state assumptions under high-acceleration conditions [3]. For the first time, Rong et al. theoretically predicted the transient performance of a centrifugal pump in the startup process by using the bonding graph method based on the theory of energy conservation [4]. Li et al. constructed a closed-loop system that included a centrifugal pump and calculated the entire piping system to obtain the transient performance of the centrifugal pump at the start [5].
Establishing a unified mathematical model to predict the transient hydraulic performance of a pump during the startup process has become a simple and effective research idea, given that the pump and piping system can be regarded as a whole [6-11]. The main advantage of this research idea is that the detailed geometrical parameters of the pump need not be clarified. On the basis of the geometric parameters of the pump itself, Dazin et al. proposed a calculation method based on angular momentum and energy equations to predict the hydraulic performance of impeller internal torque, power, and lift during pump startup [12]. The author’s previous work focused on the transient performance of start and stop under different stable conditions [13].
As we know, under the condition of ultra-small flow, the internal flow inside pump is very complicated. In the current study, the effects of three startup times of fast, medium, and slow on startup performance are studied under an ultra-small flow condition. Three dimensionless coefficients are introduced to reveal the transient characteristics of the test model pump during the startup process.
2. Physical pump and test rig
2.1 Tested pump
The test pump used in this work is a DKS18-40-3 type cantilever self-priming centrifugal pump. Its designed rotating speed is 2,900 r/min, the designed flow is 10 m3/h, and the designed head is 35 m. The pump inlet diameter is 60 mm, and the pump outlet diameter is 60 mm. The impeller inlet diameter is 40 mm, and the impeller outer diameter is 166 mm. The blade inlet width is 8 mm, and the exit width is 8 mm. The blade inlet angle is 40°, and the outlet angle is 20°. A section view of the internal structure of the self-priming pump is presented in Figure 1.
Fig.1. The sketch of self-priming pump [14]
2.2 Test rig
The external characteristic test device of the pump startup process is shown in Fig. 2. The models, ranges, and measurement accuracy of each measuring sensor are exactly the like those in literature [13]. The conveying medium is clear water at room temperature; the density is 998.2 kg/m3, and the dynamic viscosity is 1.0069×10⁻³Pa•s.
2.3 Testing method and scheme
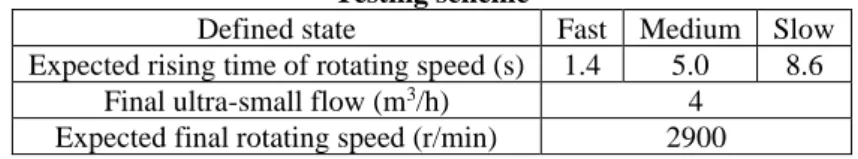
The current strength is set to increase linearly from 0, that is, the pump speed rises linearly in theory, by changing the output current strength of the inverter to control the rising law of the pump speed. By setting the current rise time to control the pump speed rise time, three startup times, namely, Te=1.4 s, 5.0
s, and 8.6s, are set and defined as fast, medium, and slow start states, respectively. The maximum current frequency is set to 50 Hz, and the corresponding maximum rotational speed value is 2900 r/min in theory at 220 V. The specific test and test schemes are shown in Table 1.
In the experiment, the pump’s steady-state output flow is controlled by controlling the opening of the pump outlet valve to control the pump speed as it reaches a stable value. The stable flow value corresponding to the opening degree of the valve is 4.0 m3/h. Compared with the rated flow rate of 10 m3/h, this flow condition belongs to ultra-small flow condition.
Table 1
Testing scheme
Defined state Fast Medium Slow Expected rising time of rotating speed (s) 1.4 5.0 8.6
Final ultra-small flow (m3/h) 4
Expected final rotating speed (r/min) 2900
Prior to the test, the entire circulating pipeline was filled with water, and the free liquid surface of the water tank was always higher than that of the test pump and the entire piping system. The pump unit is started, and after the speed has become stable, the regulation flow of the pump outlet valve opening is controlled to 4 m3/h. Then, the pump is stopped, and the valve opening remains unchanged. After the water body in the entire system (including the water tank) has become completely stationary, the pump is restarted, and the transient performance test of the starting process is carried out. The process is repeated until the completion of the three startup time tests, as shown in Table 1.
3. Experimental results and analysis
3.1 Rotating speed
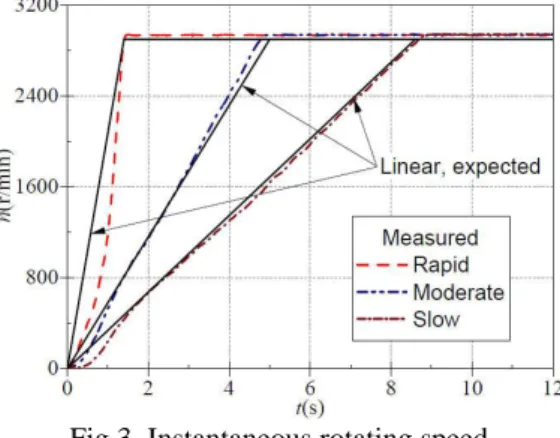
The instantaneous rotating speed of the three startup processes measured by a JC0 torque speed sensor is shown in Figure 3. In the three startup states of fast speed, medium speed, and slow speed, the average stable rotational speed after startup is approximately 2938, 2939, and 2942 r/min, respectively. The stable rotational speed after startup shows a slight increase with the extension of startup
time. The three types of stable rotational speeds are higher than the design speed 2900 r/min due to the voltage instability during the experiment. Meanwhile, in the fast, medium, and slow startup states, the total time required for the speed to rise to a stable value is approximately 1.452 s, 4.942 s, and 9.031 s, respectively.
For the fast startup state, the rotational speed rise curve seriously deviates from the linear law. The deviation is particularly serious in the first half of the startup process, and the rate of increase is significantly reduced. In the second half of the startup process, the deviation gradually decreases, and the rising rate gradually increases. For the two startup states of medium speed and slow speed, the rotational speed curve deviates from the linear law, and the rising rate decreases in the early stage of startup. Then, in most of the start-up process, the rotational speed curve basically shows an increase in a linear law basis.
The time required for each parameter to rise to 63.2% of the respective stable values is the nominal acceleration time [7]. The ratio (λn) of nominal
acceleration time (t) to the total time required for the parameter rise (T) fully shows the degree of rise and fall in the first half of each parameter during the startup process. The smaller the ratio (λn) is, the faster the parameter rises in the
first half of the startup process and the slower it rises in the later stage. In the three startup states of fast speed, medium speed, and slow speed, the speed rise time ratio (λn) is approximately 0.804, 0.635, and 0.624, respectively.
Fig.3. Instantaneous rotating speed
Fig. 4 shows an instantaneous fluctuation of the rotational speed after startup. In addition to voltage instability, the instantaneous fluctuation of rotational speed is related to flow fluctuation, pressure pulsation, and other factors.
Fig.4. Fluctuation characteristics of instantaneous rotating speed
3.2 Flow
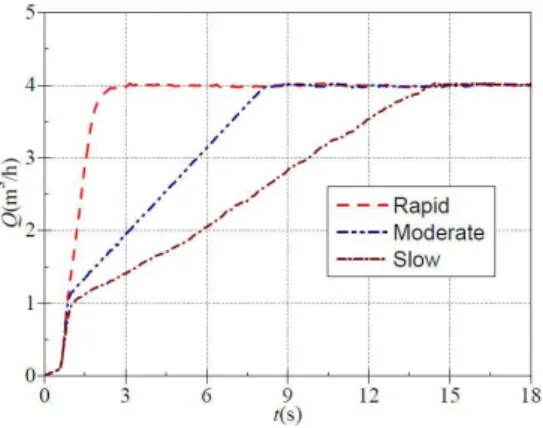
The instantaneous flow rate of the three types of startup processes measured by an Optiflux2100c electromagnetic flowmeter is shown in Figure 5. In the three startup states of fast speed, medium speed, and slow speed, traffic rises very slowly before 0.60 s, and the flow is only approximately 0.15 m3/h. The reason for the slow increase in flow is that prior to startup, the entire piping system, including the water body of the tank, is stationary due to the static inertia of the fluid. After 0.60 s, the flow starts to rise rapidly. For fast start-up state, the flow rise rate remains almost constant until it rises to a stable value. A small process of slow flow rise is observed prior to reaching a stable value. However, for the two startup states of medium speed and slow speed, the characteristics of the flow rise curve are evidently different from the evolution characteristics of the flow curve in the fast startup state. For medium and slow startup states, at approximately 0.80 s and 1.0 s, respectively, the flow rise rate begins to decrease significantly, gradually rising to a stable value. In summary, at fast startup state, the flow curve presents two-segment characteristics; at medium and slow startup states, the flow curve presents three-segment characteristics.
The stable flow rate of the three startup states is 4.0 m3/h because the stable flow after startup in this experiment is determined by the advance adjustment of the pump outlet valve. In the three startup states, the total time required for the flow to rise to a stable value is approximately 2.765 s, 8.391 s, and 14.234s. The total time required for flow rise is higher than the respective speed rise time mainly because of the stationary water body prior to startup.
The ratio of nominal acceleration time for the increase in flow (tq) to the
total time required for the flow to rise (Tq) is considered the time ratio of flow rise
(λq). In the three startup states of fast speed, medium speed, and slow speed, the
flow rise time ratio (λq) is approximately 0.495, 0.530, and 0.554, respectively.
Fig.5. Instantaneous flow evolution
The dimensionless flow coefficient is introduced to describe transient characteristics in the startup process. According to pump theory, the coefficient seems to be independent of rotational speed. The definition is as follows:
2 2 2
( )t Q t( ) / D b u t( )
= (1) 2( )
u t is the instantaneous circumference velocity of the impeller outlet, and its expression isu t2( )=D n t2 ( ) / 60. Figure 6 shows the time evolution process of instantaneous dimensionless flow coefficient in the three startup states.
Fig. 6 shows that the dimensionless flow coefficient changes dramatically at the beginning of the startup process mainly due to the very slow increase in flow; the speed deviates from the linear rise law. After overcoming the complex initial stage, the dimensionless flow coefficient evolves to become highly regular. Then, the dimensionless flow coefficient decreases to the local minimum value and increases to the final stable value.
Fig.6. Evolution of dimensionless instantaneous flow
3.3 Static pressures at pump inlet and outlet
The instantaneous static pressure at the inlet and outlet of the pump during the three startup processes measured by a WIKA S-10 pressure transmitter is
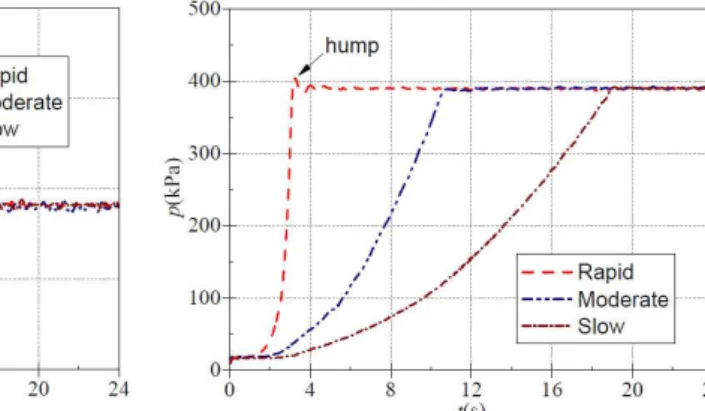
shown in Figs. 7 and 8. Fig. 7 shows that in the fast-speed and medium-speed startup states, the pump inlet static pressure has similar evolutionary characteristics, which are evidently different from those in the slow startup state. In the two startup states of fast speed and medium speed, the pump inlet static pressure fluctuation is extremely violent; the inlet static pressure initially drops rapidly from the initial 9.0 kPa to a minimum of approximately -2.68 and 0.16 kPa, respectively, rapidly rises to a maximum value of approximately 23.56 and 23.64 kPa, respectively, and then gradually fluctuates to a stable value of approximately 8.20 kPa. For the slow startup state, the pressure evolution law of the pump inlet is simple. The pump inlet static pressure only has a slight descent characteristic, and the minimum static pressure value is 7.46 kPa. The static pressure evolution of the pump inlet gradually tends to be mild with the prolongation of downtime.
Fig. 8 shows that the static pressure of the pump outlet increases rapidly with the rapid rise of rotational speed in Figure 3. In the early stages of startup, the static pressure in the outlet increases very slowly. For the fast startup state, the outlet static pressure exhibits a pressure impact phenomenon at the end of the startup process, which can reach the maximum static pressure value of 404.40 kPa then gradually descends to the final stable value of 390.31 kPa. For the two startup states of medium speed and slow speed, no pressure impact phenomenon is observed at the end of the startup process, and the final stable value after startup is approximately 390.36 and 390.40 kPa.
Fig.7. The static pressure at pump inlet Fig.8. The static pressure at pump outlet
3.4 Pump head
The instantaneous head of the model pump in the startup process is shown in Figure 9. In the three startup states of fast speed, medium speed, and slow speed, the average value of the stable head after startup is approximately 38.99, 39.01, and 39.0 m, respectively, and the total time required for the head to rise to
its respective stable position is approximately 3.281, 10.719, and 19.016 s, respectively.
For the fast startup state, although the pressure impact phenomenon exists at the end of the outlet static pressure and because the inlet static pressure also exhibits the pressure impact phenomenon, no head curve is found in the head impact phenomenon. For the startup state of medium speed, a local sudden drop phenomenon is observed in the head curve due to the pressure impact phenomenon of the inlet static pressure during the startup process. For the slow startup state, the head curve is regular because no pressure impact phenomenon exists in the static pressure curve of the inlet and outlet.
For the fast startup state, the head curve shows approximately linear variation and becomes closer to the quadratic parabolic law with the extension of startup time. The pump similarity law is suitable for the performance prediction of the pump transient operation process with the extension of startup time because the pump head is proportional to the square of rotational speed.
In addition, the ratio that defines the nominal acceleration time of the head rise (tH) to the total time required for the head rise (TH) is used as the time ratio of
head rise (λH). In the three startup states of fast speed, medium speed, and slow
speed, the head rise time ratio (λH) is approximately 0.885, 0.798, and 0.799,
respectively. In any of the startup states, the head rise time ratio (λH) is greater
than the speed rise time ratio (λn).
Fig.9. Instantaneous head evolution
Similarly, the dimensionless head coefficient is introduced to describe the transient characteristics in the startup process. According to pump theory, the coefficient also seems to be independent of rotational speed. The definition is as follows:
2 2
( )t 2g ( ) /H t u t( )
= (2) Fig. 10 shows the time evolution process of the instantaneous dimensionless head coefficient in the three startup states. In the three startup states, a maximum value exists in the beginning of startup. Then, the instantaneous dimensionless head coefficient rapidly drops to the minimum value then rises to
the final stable value. The evolutionary characteristic is consistent with that in literature [2].
Fig.10. Evolution of dimensionless instantaneous head
3.5 Shaft power
The instantaneous shaft power of the three startup processes measured by a JC0 torque speed sensor is shown in Figure 11. In the three startup states of fast speed, medium speed, and slow speed, the stable shaft power average after startup is approximately 2.260, 2.267, and 2.268 kW, respectively; the total time required for shaft power to rise to the stable shaft power is exactly the same as that in the speed situation, that is, 1.452 s, 4.942 s, and 9.031 s, respectively. The increase in shaft power in the startup process is almost identical to the increase in rotational speed.
Fig.11. Instantaneous shaft power evolution
Moreover, the ratio that defines the nominal acceleration time of the shaft power rise (tp) to the total time required for the shaft power rise (Tp) is used as the
time ratio of shaft power rise (λp). In the three startup states of fast speed, medium
speed, and slow speed, the shaft power rise time ratio (λp) and the speed rise time
respectively. The comparison results of three ratios are shown in Fig. 2.
Table 2
Comparison result
Rise time ratio Fast Medium Slow λP 0.804 0.635 0.624 λH 0.885 0.798 0.799 λq 0.495 0.530 0.554
The comparison of the flow rise time ratio (λq), head rise time ratio(λh),
and shaft power rise time ratio (λp) shows that in any startup state, the size relation
of the three is as follows: λq<λP<λH. Thus, the parameters are affected in the
startup process, from heavy to light, in the order of flow rate, shaft power, and head. In summary, during the startup process, the order of the relative rise rate of the parameters is flow rate, shaft power, and head.
4. Conclusions
In the fast start state, the flow curve presents two-segment characteristics; in the medium and slow start states, the flow curve presents three-segment characteristics. The dimensionless flow coefficient generally decreases then increases. The dimensionless shaft power coefficient has a maximum value in the beginning of startup then decreases rapidly until the final stable value is reached. With the extension of startup time, the stable rotational speed after startup shows a slight increase. When the startup time is short, the rotational speed curve deviates from the established linear law. In the medium and fast startup states, the inlet static pressure fluctuation is violent; in the fast startup state, the outlet static pressure exhibits the pressure impact phenomenon at the end of the startup process. With the extension of startup time, the head curve becomes closer to the quadratic parabolic law, and the pump similarity law becomes more suitable for performance prediction of the pump transient operation process.
Acknowledgement
The research was financially supported by the National Natural Science Foundation of China (Grant No.51876103) and the Zhejiang Provincial Natural Science Foundation of China (Grant No.LY18E090007).
R E F E R E N C E S
[1]. V.L. Streeter, “Hydraulic Transients”, Wylie, E.B 1967, New York.
[2]. H. Tsukamoto and H. Ohashi, “Transient Characteristics of a Centrifugal Pump during Starting Period”, in Distributed J. Fluid Eng., vol. 104, no.1, Oct. 1982, pp. 6-13.
[3]. P. J. Lefebvre and W. P. Barker, “Centrifugal Pump Performance during Transient Operation”, in Distributed J. Fluid Eng., vol. 117, no. 2, Oct. 1995, pp. 123-128.
[4].W.H. Rong, K. Tanaka, T.Ootsu, et al., “Analysis of Pump Transient during Starting/Stopping Periods by Bond Graph”, in Distributed Japan Society of Mechanical Eng., vol. 62, Sept. 1995, pp. 677-683.
[5].Z.F. Li, D.Z. Wu, L.Q. Wang, et al., “Numerical Simulation of the Transient Flow in a Centrifugal Pump during Starting Period”, in Distributed J. Fluid Eng., vol. 132, no.8, Aug. 2010, pp. 081102.1-8.
[6].K. Farhadi, A. Bousbia-salah and F. D'Auria, “A model for the analysis of pump start-up transients in Tehran Research Reactor”, in Distributed Prog. Nucl. Energ., vol. 49, Sept. 2007, pp. 499-510.
[7]. H. Gao, F. Gao, X.C. Zhao, et al., “Analysis of Reactor Coolant Pump Transient Performance in Primary Coolant System during Start-up Period”, in Distributed Ann. Nucl. Energy.,
vol. 54, Sept. 2013, pp. 202-208.
[8]. I. Chalghoum, S. Elaoud, M Akrout, et al. “Transient Behavior of a Centrifugal Pump during Starting Period”, in Distributed Appl. Acoust.,vol. 109, Feb. 2016, pp. 82-89.
[9]. R. Grover and S. Koranne, “Analysis of Pump Start-up Transient”, in Distributed Nucl. Eng. Des.,vol. 67, Jan. 1981, pp. 137-141.
[10]. K. Farhadi, “Transient Behaviour of a Parallel Pump in Nuclear Research Reactors”, in Distributed Prog. Nucl. Energ., vol. 53, Apr. 2011, pp. 195-199.
[11]. S. Yang, “Investigation on the Transient Characteristics of the Pump System Using MOC-CFD Coupled Method”, Thesis, Zhejiang University, 2015.
[12]. A. Dazin, G. Caignaert and G. Bois. “Transient behavior of turbomachineries: applications to radial flow pump startups ”. in Distributed J. Fluid Eng., vol. 129, no.11, Nov. 2007, pp. 1436-1444.
[13]. Y.L. Zhang, Z.C. Zhu, W.G. Li, “Experiments on Transient Performance of a Low Specific Speed Centrifugal Pump with Open Impeller”, in Distributed P. I. Mech. Eng. A-J. Pow.,
vol. 129, no.7, Jul. 2016, pp. 648-659.
[14] Y.L. Zhang, Z.C. Zhu, W.G. Li, “Experimental startup characteristics of a prototype pump delivering tap water”, in Distributed J Braz Soc Mech Sci, vol. 41, no. 388, Jul. 2019.