Rasda Boonprasert, M.Sc.*, Raveewan Klintip, M.Sc.*, Supawadee Phakdeenukoolkijja, M.Sc*, Winai Ratanasuwan, M.D.**, Teera Kolladarungkri, M.D.**
*Clinical Toxicology Laboratory, Siriraj Hospital, **Department of Preventive and Social Medicine, Faculty of Medicine Siriraj Hospital, Mahidol University, Bangkok 10700, Thailand.
Development of a Novel Method for Determination
of 11 Antiretroviral Drugs Concentrations in Human
Plasma by Ultra-Performance Liquid
Chromato-graphy-Photodiode Array Detection Method
Correspondence to: Teera Kolladarungkri E-mail: [email protected]
Received 2 May 2017 Revised 3 August 2017 Accepted 10 August 2017 doi:10.14456/smj.2018.39
ABSTRACT
Objective: To develop ultra-performance liquid chromatography-photodiode array detection (UPLC-PDA) method that is fully validated for measuring 11 antiretroviral drugs concentrations in human plasma.
Methods: Chromatographic separation was performed on an ACQUITY UPLC
™ BEH Shield RP, 1.7 μm (100 mm
x 2.1 mm I.D.) and used acetronitrile with 0.1% formic acid in Milli-Q water as a mobile phase. ACQUITY UPLC®Photodiode Array (PDA) Detector was performed at 210, 240, and 260 nm.
Results: This method demonstrated a good separation result for plasma levels of 11 antiretroviral drugs within 16 minutes. The lower limit of quantification (LLOQ) was 0.25 µg/mL for maraviroc, 0.5 µg/mL for lopinavir, and 20 ng/mL for the remaining 9 antiretroviral drugs. This method was fully validated in terms of selectivity, accuracy, precision, and stability. The standard curves are in the expected ranges of drug concentration in the patients’ plasma with good linearity (r2>0.995). Recoveries of extraction ranged from 72.27- 110.80% with repeatability.
Conclusion: A novel, sensitive, accurate, and reproducible UPLC/PDA method for quantification of 11 currently-prescribed antiretroviral drugs concentrations in human plasma was successfully developed and fully validated according to USFDA guidelines.
Keywords: UPLC/PDA; antiretroviral; therapeutic drug monitoring (Siriraj Med J 2018;70: 238-246)
INTRODUCTION
Antiretroviral (ARV) drugs that are commonly used to treat human immunodeficiency virus (HIV) include: protease inhibitors (PIs), non-nucleoside reverse transcriptase inhibitors (NNRTIs), nucleoside reverse transcriptase inhibitors (NRTIs), integrase inhibitors (INSIs), and entry and fusion inhibitors (EIs). The use of three or more antiretroviral medicines is referred to as highly active antiretroviral therapy or HAART. Presently, HAART is the standard treatment for HIV infection.1
Failure of treatment with antiretroviral drugs in HIV
patients has remained unacceptably high. Low concentrations of ARVs are evaluated as drug administration’s failure. High concentrations of ARVs also increase the risk of drug toxicity.2 Recommended standard dosages of
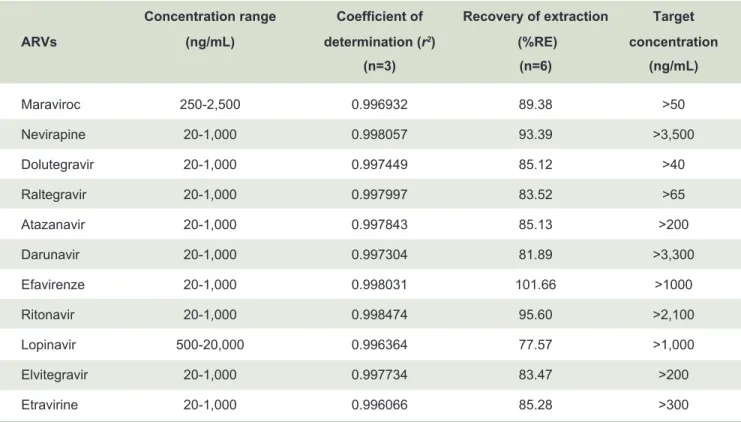
efavirenze >1,000 ng/mL; nevirapine >3,500 ng/mL; maraviroc >50 ng/mL; darunavir >3,300 ng/mL; etravirine >300 ng/mL; raltegravir >65 ng/mL; elvitegravir >200 ng/mL; and, dolutegravir >40ng/mL.2-4
Many methods for the simultaneous quantification of ARVs have been developed. The most commonly used techniques are liquid chromatography-tandem mass spectrometry (LC-MS/MS)5-11 and reversed-phase
HPLC with UV detection.12-21 The LC-MS/MS tandem
method is not only highly sensitive and highly specific, but it also has a very short runtime, because complete separation of all antiretroviral’s chromatogram is not necessary. However, the limitation of LC-MS/MS analysis is not only requiring a more expensive instrument than other techniques, but also susceptibility to their matrix effects. Moreover, HPLC methods with UV detection have a very long analytic time to complete the resolution of all chromatographic peaks. High sensitivity, high specificity, and short runtime are ideal performance parameters of therapeutic drug monitoring (TDM). Then, Ultra-performance liquid chromatography (UPLC) may have an opportunity in this TDM because of its advantages of cheaper method and can detect broader separated chromatograms. Although other methods for the simultaneous quantification of protease inhibitors (PIs) and non-nucleoside reverse transcriptase inhibitors (NNRTIs) using UPLC with photo diode array detection have been published22, 23, neither of those studies included
the quantification of integrase inhibitors (INSIs), and entry and fusion inhibitors (EIs).
The aim of this study was to develop the ultra-performance liquid chromatography-photodiode array detection (UPLC-PDA) method which has been fully validated for measuring 11 antiretroviral concentrations in human plasma. We anticipate that this method will have clinical value for monitoring the levels of these drugs in patients who received several antiretroviral drugs’ administration.
MATERIALS AND METHODS Chemicals and Materials
Atazanavir, etravirine, raltegravir, elvitegravir, and dolutegravir were purchased from Toronto Research Chemicals, Inc. (Toronto, Canada). Maraviroc, lopinavir, ritonavir, darunavir, efavirenze, nevirapine, and tenofovir (internal standard, IS) were purchased from Sigma-Aldrich Ltd. (Steinheim, Germany). HPLC grade acetonitrile and methanol were purchased from Labscan Ltd. (Bangkok, Thailand). Water used for experimentation was produced by Milli-Q
®
water purification system (EMD Millipore,analytical grade. Drug-free human plasma was obtained from the Department of Transfusion Medicine, Faculty of Medicine Siriraj Hospital. The protocol for this study was approved by the Siriraj Institutional Review Board (Si 655/2015), Faculty of Medicine Siriraj Hospital, Mahidol University, Bangkok, Thailand.
Instruments and Analytical Conditions
AcquityTM Ultra Performance Liquid Chromatography
(Waters Corporation, Milford, MA, USA) was used for the separation module. Chromatographic separation was performed on an ACQUITY UPLCTM BEH Shield RP
(1.7 μm, 100 mm x 2.1 mm I.D.) (Waters Corporation, Milford, MA, USA). To achieve an optimum result, the mobile phase was performed with a flow rate of 0.45 mL/min and a column temperature of 40ºC. The gradient programmed for the mobile phase was optimized using acetronitrile and 0.1% formic acid in water, as shown in Table 1. ACQUITY UPLC
®
Photodiode Array (PDA) Detector (Waters Corporation, Milford, MA, USA) was operated at wavelengths between 200-380 nm and quantitation was performed at 210 nm for maraviroc and lopinavir; 240 nm for nevirapine, raltegravir, atazanavir, ritonavir, efavirenze, and etravirine; and, 260 nm for dolutegravir, darunavir, and elvitegravir. The autosampler was conditioned at 8ºC and the injection volume was 10 µL. Empower 2 software (Waters Corporation, Milford, MA, USA) was used for data management.Preparations of Standard and Quality Control Samples
TABLE 1. Gradient programmed for the mobile phase: Solvent A (Acetonitrile) and Solvent B (0.1% formic acid
in water).
Time (min) Flow (mL/min) % Solvent A % Solvent B
0.0 0.45 20 80
1.0 0.45 30 70
3.0 0.45 35 65
4.0 0.45 32 68
9.0 0.45 45 55
12.0 0.45 40 60
14.0 0.45 65 35
16.0 0.45 20 80
Sample Preparations
For solid phase extraction (SPE), OASIS HLB: Hydrophilic-Lipophilic-Balanced reversed-phase sorbent 30 mg 1 mL (Waters Corporation, Milford, MA, USA) was used for sample preparation. SPE HLB cartridges were initially conditioned with 1 mL of methanol and equilibrated with 1 mL of Milli-Q water before use. Twenty µL of IS (50 µg/mL) was added into 1.0 mL of plasma samples. Then, 1 mL of plasma samples were aspirated into the wetted preconditioned SPE HLB cartridges. The plasma components were then washed in two steps with wash solvent, as follows: step 1) 1 mL of ammonia solution and 5% methanol in water (2:98, v/v); and, step 2) 1 mL of ammonia solution and 50% methanol in water (2:98, v/v). ARVs were subsequently eluted from the dried columns using 0.5 mL of an eluting solution (acetic acid and methanol, 2:98, v/v). Three hundred μL of elute was then diluted with 200 mL of 0.1% formic acid before being injected into the UPLC system.
Bioanalytical method validation
The developed method was fully validated according to the Guidance for Industry, Bioanalytical Method Validation by the U.S. Food and Drug Administration (FDA).24
1) Selectivity and Sensitivity
Selectivity was examined using six sources of drug-free plasma, for which the result should not have interfering peaks at the retention times of the 11 ARVs and IS. Sensitivity at the lower limit of quantification (LLOQ) was also examined by dilution of standard compounds in plasma, which were extracted and then quantified at the lowest detectable concentration.
2) Intraday and Interday Precision and Accuracy Intraday and interday precision and accuracy were examined by analysis of six replicates of LLOQ, LQC, MQC, and HQC for three consecutive days. Percentage of relative error (%RE) indicating accuracy and percentage of coefficient of variation (%CV) indicating precision were calculated. Both %RE and %CV should be within ±20% at LLOQ and ±15% at other concentrations.
3) Linearity and Calibration Curve
A calibration curve was represented by a linear regression model, y=mx+b and weighting by 1/x, where y was the ratio of peak area of analyte to the peak area of IS, x was the concentration at different levels, including 0.25, 0.5, 1.0, 1.5, 2.0, and 2.5 µg/mL for MRV; 0.5, 2.0, 5.0, 10.0, 15.0, and 20.0 µg/mL for LPV; and, 20.0, 100.0, 500.0, 1,000.0, 1,500.0, and 2,000 ng/mL for all 9 other ARVs. All calibration ranges yielded linear relationships with coefficient of determination (r2) that exceeded 0.995.
4) Extraction Efficiency
Extraction efficiency of the method was performed by comparing peak areas of extracted samples at three QC concentrations, with peak areas of non-extracted standard solutions at the same concentrations. Recovery of the analyte was not required to be 100%, but the extent of recovery of an analyte should be precise and reproducible.
5) Stability
at room temperature for 6 hours before analysis. For post-preparative stability test, vials of plasma samples were placed in the auto-sampler at 8°C for 10 hours before analysis. Lastly and for the long-term stability test, plasma samples were frozen at -20°C for 3 months before analysis. The acceptable percentage of variation in each condition must be within ±15%.
6) Matrix Effect
The matrix effect was determined by analysis of six replicates of QC samples at three different concentrations in the blank extracts and in the solution. The matrix factor (MF) was calculated as the ratio of the peak area between presence and absence of matrix. An average matrix value within the range of 0.8-1.2 indicates no matrix effect.
RESULTS
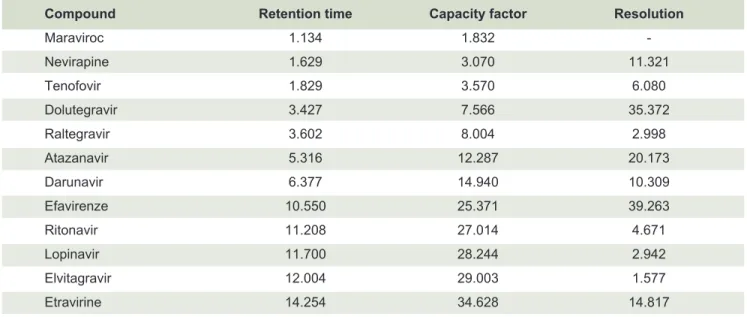
This method demonstrated a good separation result for 11 ARVs in 16 minutes as shown with PDA spectrum in Fig 1. The capacity factor (kʹ) was in the range of 1.832-34.628 and the resolution factor was in the range of 1.577-39.263 as summarized in Table 2. The specific wavelength selected for each drug was 210 nm for maraviroc and lopinavir; 240 nm for nevirapine, raltegravir, atazanavir, ritonavir, efavirenze, and etravirine; and, 260 nm for dolutegravir, darunavir, and elvitegravir. Wavelength selection was based on the requirement for high sensitivity and specificity. There were no interfering peaks for retention time of 11 ARVs in selectivity testing
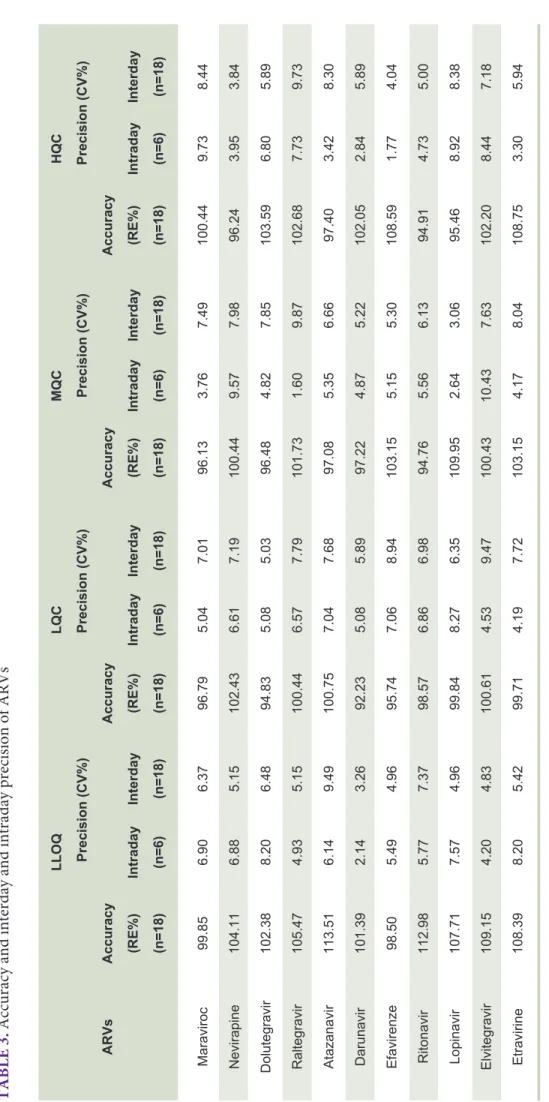
(Fig 2). The lower limit of quantification (LLOQ) was 0.25 µg/mL for maraviroc, 0.5 µg/mL for lopinavir, and 20 ng/mL for the remaining 9 ARVs. The accuracy and precision of the proposed method were acceptable, as summarized in Table 3. Method accuracies were in the range of 92.23-113.51%. Interday and intraday precision was also observed, with %CV in the range of 1.60-10.43%. This method also showed good linearity, with a coefficient of determination (r2) greater than
0.996 (Table 4). Although extraction efficiency was in the range of 77.57-101.66%, the recovery of each ARV was consistent, precise, and reproducible with a %CV range of 1.61-9.27 (Table 4). Under the various conditions used for stability testing, the percentage of variation for each condition was within an acceptable range (Table 5). For matrix effect, a matrix factor (MF) between 0.92-1.19 indicated that other substances in the sample cannot significantly affect the accuracy and precision of the method.
These were only two previously published studies in ARVs analysis by UPLC-PDA method. Analysis of 8 ARVs took longer than 9.5 min in a study by Antunes, et al.23 and 14 min for 10 ARVs in a study by Elens, et al.22
Although the resolution factors between elvitegravir and lopinavir were lower than 2.0 (1.577), their elution peaks and analytic peaks were also completely separated. The LLOQ is defined as the lowest concentration that can be quantified below the suggested minimum target of trough concentrations in patients with HIV. In our method of detections, 10 ARVs were detected within accuracate time and in therapeutic recommended doses. The exception was Maraviroc, which needed higher concentrations 50 ng/mL for detection by UPLC method. However, these methods can measure peak concentrations when dosed 150 mg or more (recommended dose is 300 mg bid). The lower LLOQ values of ritonavir, nevirapine, atazanavir, and efavirenze indicate higher sensitivity than previously published UPLC-PDA methods.22-23 As shown
in Fig 1, Lopinavir and Maraviroc can absorb only at a wavelength of 210 nm. At 190 -210 nm, the analysis will be disturbed by the other substances’ noise. It’s better to avoid analysis below 210 nm due to low sensitivity of method. Therefore, the analytical concentration range of Lopinavir and Maraviroc are higher or different from the others. Solid phase extraction was optimized in order to obtain a more rapid and simple procedure for routine analysis than was previously published19, due to
no evaporating step that consumes about 45-60 minutes. Then, our UPLC method may have an opportunity in therapeutic monitoring in HIV patients who are treated with several antiretroviral drugs because it is a cheaper method and can detect broader separated chromatograms. The patients who have low plasma antiretroviral drugs level will result in administration failure and treatment failure. In the opposite side, the patients who have high plasma drugs level will need awareness of more adverse drug effects and toxicities.
CONCLUSION
Fig 1. Chromatograms obtained during simultaneous separation of 11 ARVs on the Left panel. PDA Spectrum of each chromatogram has been show on the Right panel, which is the specific pattern of absorbance of each drug.
TABLE 2. Retention time, capacity factor (kʹ), and chromatogram resolution of ARVs.
Compound Retention time Capacity factor Resolution
Maraviroc 1.134 1.832
TABLE 3.
Accuracy and interday and intraday precision of ARVs
LLOQ LQC MQC HQC Precision (CV%) Precision (CV%) Precision (CV%) Precision (CV%) ARVs Accuracy Accuracy Accuracy Accuracy (RE%) Intraday Interday (RE%) Intraday Interday (RE%) Intraday Interday (RE%) Intraday Interday (n=18) (n=6) (n=18) (n=18) (n=6) (n=18) (n=18) (n=6) (n=18) (n=18) (n=6) (n=18) Maraviroc 99.85 6.90 6.37 96.79 5.04 7.01 96.13 3.76 7.49 100.44 9.73 8.44 Nevirapine 104.11 6.88 5.15 102.43 6.61 7.19 100.44 9.57 7.98 96.24 3.95 3.84 Dolutegravir 102.38 8.20 6.48 94.83 5.08 5.03 96.48 4.82 7.85 103.59 6.80 5.89 Raltegravir 105.47 4.93 5.15 100.44 6.57 7.79 101.73 1.60 9.87 102.68 7.73 9.73 Atazanavir 113.51 6.14 9.49 100.75 7.04 7.68 97.08 5.35 6.66 97.40 3.42 8.30 Darunavir 101.39 2.14 3.26 92.23 5.08 5.89 97.22 4.87 5.22 102.05 2.84 5.89 Efavirenze 98.50 5.49 4.96 95.74 7.06 8.94 103.15 5.15 5.30 108.59 1.77 4.04 Ritonavir 112.98 5.77 7.37 98.57 6.86 6.98 94.76 5.56 6.13 94.91 4.73 5.00 Lopinavir 107.71 7.57 4.96 99.84 8.27 6.35 109.95 2.64 3.06 95.46 8.92 8.38 Elvitegravir 109.15 4.20 4.83 100.61 4.53 9.47 100.43 10.43 7.63 102.20 8.44 7.18 Etravirine 108.39 8.20 5.42 99.71 4.19 7.72 103.15 4.17 8.04 108.75 3.30 5.94 Abbreviations:
n = number of replicates; LLOQ = lower limit of quantifi
TABLE 4. Concentration range, linearity, recovery of extraction, and target concentrations of ARVs.
TABLE 5. Stability of ARVs.
Concentration range Coefficient of Recovery of extraction Target ARVs (ng/mL) determination (r2) (%RE) concentration
(n=3) (n=6) (ng/mL)
Maraviroc 250-2,500 0.996932 89.38 >50 Nevirapine 20-1,000 0.998057 93.39 >3,500 Dolutegravir 20-1,000 0.997449 85.12 >40 Raltegravir 20-1,000 0.997997 83.52 >65 Atazanavir 20-1,000 0.997843 85.13 >200
Darunavir 20-1,000 0.997304 81.89 >3,300 Efavirenze 20-1,000 0.998031 101.66 >1000
Ritonavir 20-1,000 0.998474 95.60 >2,100 Lopinavir 500-20,000 0.996364 77.57 >1,000 Elvitegravir 20-1,000 0.997734 83.47 >200 Etravirine 20-1,000 0.996066 85.28 >300
Abbreviation: n = number of replicates
ARVs Variation (%) (n=3)
Freeze and thaw Short-term Long-term Post-preparative
Maraviroc 1.42-9.58 1.46-7.82 2.20-10.77 2.04-5.02 Nevirapine 2.13-5.12 0.39-5.02 4.67-13.32 2.44-4.00 Dolutegravir 2.09-10.22 3.26-9.49 0.41-6.99 1.80-7.75 Raltegravir 1.15-11.92 1.69-10.38 3.66-9.97 0.17-4.75 Atazanavir 2.41-11.89 5.02-11.17 0.80-10.53 0.36-2.03 Darunavir 4.33-12.40 2.10-11.86 3.86-7.81 0.41-3.97 Efavirenze 2.85-9.15 1.31-8.23 2.77-6.86 1.29-5.32 Ritonavir 5.16-10.76 1.11-5.06 0.11-10.29 0.65-1.38 Lopinavir 0.06-13.44 2.32-3.79 0.25-8.34 3.38-8.06 Elvitegravir 1.07-2.38 1.33-6.04 1.86-3.31 0.98-4.00 Etravirine 3.60-14.02 2.06-5.62 2.61-12.09 0.17-6.75
REFRRENCES
1. De Clercq E. Antiretroviral drugs. Curr Opin Pharmacol. 2010;10:507-15.
2. Justesen US. Therapeutic drug monitoring and human immunodeficiency virus (HIV) antiretroviral therapy. Basic Clin Pharmacol Toxicol. 2006;98:20-31.
3. Pretorius E, Klinker H, Rosenkranz B. The role of therapeutic drug monitoring in the management of patients with human immunodeficiency virus infection. Ther Drug Monit. 2011; 33: 265-74.
4. Back D, Gibbons S, Khoo S. An update on therapeutic drug monitoring for antiretroviral drugs. Ther Drug Monit. 2006;28: 468-73.
5. Fayet A, Beguin A, Zanolari B, Cruchon S, Guignard N, Telenti A, et al. A LC-tandem MS assay for the simultaneous measurement of new antiretroviral agents: Raltegravir, maraviroc, darunavir, and etravirine. J Chromatogr B Analyt Technol Biomed Life Sci. 2009; 877: 1057-69.
6. Quaranta S, Woloch C, Paccou A, Giocanti M, Solas C, Lacarelle B. Validation of an electrospray ionization LC-MS/MS method for quantitative analysis of raltegravir, etravirine, and 9 other antiretroviral agents in human plasma samples. Ther Drug Monit. 2009; 31: 695-702.
7. Ter Heine R, Rosing H, Beijnen JH, Huitema AD. A less sensitive detector does not necessarily result in a less sensitive method: fast quantification of 13 antiretroviral analytes in plasma with liquid chromatography coupled with tandem mass spectrometry. Clin Chem Lab Med. 2010; 48: 1153-5.
8. Gehrig AK, Mikus G, Haefeli WE, Burhenne J. Electrospray tandem mass spectroscopic characterisation of 18 antiretroviral drugs and simultaneous quantification of 12 antiretrovirals in plasma. Rapid Commun Mass Spectrom. 2007; 21: 2704-16.
9. Ter Heine R, Alderden-Los CG, Rosing H, Hillebrand MJ, van Gorp EC, Huitema AD, et al. Fast and simultaneous determination of darunavir and eleven other antiretroviral drugs for therapeutic drug monitoring: method development and validation for the determination of all currently approved HIV protease inhibitors and non-nucleoside reverse transcriptase inhibitors in human plasma by liquid chromatography coupled with electrospray ionization tandem mass spectrometry. Rapid Commun Mass Spectrom. 2007; 21: 2505-14.
10. Jung BH, Rezk NL, Bridges AS, Corbett AH, Kashuba AD. Simultaneous determination of 17 antiretroviral drugs in human plasma for quantitative analysis with liquid chromatography- tandem mass spectrometry. Biomed Chromatogr. 2007; 21: 1095-104.
11. Koal T, Sibum M, Koster E, Resch K, Kaever V. Direct and fast determination of antiretroviral drugs by automated online solid-phase extraction-liquid chromatography-tandem mass spectrometry in human plasma. Clin Chem Lab Med. 2006; 44: 299-305.
12. Bouley M, Briere C, Padoin C, Petitjean O, Tod M. Sensitive and rapid method for the simultaneous quantification of the HIV-protease inhibitors indinavir, nelfinavir, ritonavir, and saquinavir in human plasma by reversed-phase liquid chromatography. Ther Drug Monit. 2001; 23: 56-60.
13. Choi SO, Rezk NL, Kashuba AD. High-performance liquid chromatography assay for the determination of the HIV- protease inhibitor tipranavir in human plasma in combination with nine other antiretroviral medications. J Pharm Biomed
Anal. 2007; 43: 1562-7.
14. Dailly E, Raffi F, Jolliet P. Determination of atazanavir and other antiretroviral drugs (indinavir, amprenavir, nelfinavir and its active metabolite M8, saquinavir, ritonavir, lopinavir, nevirapine and efavirenz) plasma levels by high performance liquid chromatography with UV detection. J Chromatogr B Analyt Technol Biomed Life Sci. 2004; 813: 353-8.
15. Droste JA, Verweij-Van Wissen CP, Burger DM. Simultaneous determination of the HIV drugs indinavir, amprenavir, saquinavir, ritonavir, lopinavir, nelfinavir, the nelfinavir hydroxymetabolite M8, and nevirapine in human plasma by reversed-phase high- performance liquid chromatography. Ther Drug Monit. 2003; 25: 393-9.
16. Justesen US, Pedersen C, Klitgaard NA. Simultaneous quantitative determination of the HIV protease inhibitors indinavir, amprenavir, ritonavir, lopinavir, saquinavir, nelfinavir and the nelfinavir active metabolite M8 in plasma by liquid chromatography. J Chromatogr B Analyt Technol Biomed Life Sci. 2003; 783: 491-500.
17. Notari S, Bocedi A, Ippolito G, Narciso P, Pucillo LP, Tossini G, et al. Simultaneous determination of 16 anti-HIV drugs in human plasma by high-performance liquid chromatography. J Chromatogr B Analyt Technol Biomed Life Sci. 2006; 831: 258-66.
18. Pelerin H, Compain S, Duval X, Gimenez F, Benech H, Mabondzo A. Development of an assay method for the detection and quantification of protease and non-nucleoside reverse transcriptase inhibitors in plasma and in peripherical blood mononuclear cells by liquid chromatography coupled with ultraviolet or tandem mass spectrometry detection. J Chromatogr B Analyt Technol Biomed Life Sci. 2005; 819: 47-57.
19. Poirier JM, Robidou P, Jaillon P. Simultaneous determination of the six HIV protease inhibitors (amprenavir, indinavir, lopinavir, nelfinavir, ritonavir, and saquinavir) plus M8 nelfinavir metabolite and the nonnucleoside reverse transcription inhibitor efavirenz in human plasma by solid-phase extraction and column liquid chromatography. Ther Drug Monit. 2002; 24: 302-9.
20. Rezk NL, Crutchley RD, Yeh RF, Kashuba AD. Full validation of an analytical method for the HIV-protease inhibitor atazanavir in combination with 8 other antiretroviral agents and its applicability to therapeutic drug monitoring. Ther Drug Monit. 2006; 28: 517-25.
21. Weller DR, Brundage RC, Balfour HH, Jr., Vezina HE. An isocratic liquid chromatography method for determining HIV non-nucleoside reverse transcriptase inhibitor and protease inhibitor concentrations in human plasma. J Chromatogr B Analyt Technol Biomed Life Sci. 2007; 848: 369-73.
22. Elens L, Veriter S, Di Fazio V, Vanbinst R, Boesmans D, Wallemacq P, et al. Quantification of 8 HIV-protease inhibitors and 2 nonnucleoside reverse transcriptase inhibitors by ultra- performance liquid chromatography with diode array detection. Clin Chem. 2009; 55: 170-4.
23. Antunes MV, Poeta J, Ribeiro JP, Sprinz E, Linden R. Ultra- Performance Liquid Chromatographic Method for Simultaneous Quantification of HIV Non-Nucleoside Reverse Transcriptase Inhibitors and Protease Inhibitors in Human Plasma. J Braz Chem Soc. 2011; 22: 134-41.