VOLUME 16 ISSUE 2 (2018), Page 225 - 235
FACTORS AFFECTING HOUSING PRICES IN MALAYSIA: ANALYSIS OF THE SUPPLY SIDE
AbdulLateef Olanrewaju1, Xin Ying Lim2, Seong Yeow Tan3, Jia En Lee4, & Hamimah Adnan5
1,2,3,4Faculty of Engineering and Green Technology
UNIVERSITI TUNKU ABDUL RAHMAN MALAYSIA
5Faculty of Architecture, Planning and Surveying
UNIVERSITI TEKNOLOGI MARA, MALAYSIA
Abstract
Buying a house is a major decision that homebuyers will make because expenditure on homeownership has an influence on the homeowner’s quality of life. The housing price also influence developers’ revenues and profit margins. Developers produce houses to make profits, however, with the increase in housing prices, homeownership rate and developers’ profit performance will be affected. This study examines the reasons why housing prices are increasing in spite of the government’s ‘cooling’ measures. Through a cross-sectional survey questionnaire, comprising 24 causes and 115 members of the housing developers and designers teams, 13 influential factors to the increase in housing prices were found. Additionally, the participants were also inquired on the five most influential factors causing the increase in housing prices. The factors include the shortage of materials, quality of materials, strategic factors, housing location and availability of transportation system. The results of the study are useful to developers, homebuyers and policymakers towards reducing housing prices.
INTRODUCTION
The demand for housing in Malaysia will increase as there is a positive correlation between housing performance and occupants’ productivity, safety, well-being and satisfaction. As Olanrewaju and Woon (2017) explained, if housing location and cost fulfill users satisfaction, the government and public sector would spend less on the provision of healthcare facilities, recreations, crime preventions and pollutions, while productivity and prosperity increase. The ability to own a house is seen as an investment in most part of the world. People spend more than 50% of their productive time in their house. Expenditures on housing is high and for those who buy or build their houses, the property represent the single most expensive investment they make and for those that rent, the rental is often their single highest monthly or annual expenditure. Housing serves as both capital and consumption goods. Housing construction contributes significantly to the GDP in most countries. However, because the demand and supply of the housing market is uncertain, the decisions of homebuyers and the developers have strong impacts on the housing supply.
In most part of the world including the UK, the US, Japan, Hong Kong, Malaysia, Singapore, Australia, Ireland, and New Zealand, Nigeria, Indonesia and South Africa, housing is unaffordable (Demographia, 2017; Osman, Bachok, Shuid, & Khalid, 2017a). In most countries, households spent more than 30% of their disposable income to own or rent and operate a house or the price-to-income ratio is more than 3.0. Based on the Demographia, a ratio of more than 3.0 implies housing unaffordability. However, governments across the world have introduced measures and policies to increase the quality and quantity of housing supply in order to increase homeownership and increase the quality of life. In Malaysia, while homeowners’ rate is decreasing at 1% annually, the unsold residential property and overhangs are increasing (Osman, Mohamad Yusop, Shud, & Abdullah, 2017b) To illustrate, the volume of transaction are 272,669, 246,225, 247,251 and 235,967 from year 2012 to year 2015 (NAPIC, 2015). The vacancy rate has increased from 6% in year 2010 to more than 10% in year 2015. MIER’s Residential Property Survey Report conducted in 4Q 2015 found that 70% of the developers reported poor sales (REHDA, 2016) and many are homeless.
Malaysia spent more than 30% of income to own or rent and operate their houses. In terms of index, the house prices have increased by 1.86 from 2009 to 2016 while that of the high rise is more severe with increase of 2.12 within the same period (NAPIC, 2017). Therefore, there is a need to provide an answer to why housing prices are increasing in Malaysia. There are multiple reasons responsible for the increase in the housing prices. A part of the problems could be accountable to developers, contractors, government policies, and third-party agencies. In this study, the causes of the increase are examined from the supply side perspectives. Empirical research that specifically address itself to causes of increase in housing prices from the experience of the providers (i.e. developers, design team, construction team and government) is lacking. It is important to investigate housing prices from the experience of the housing providers because housing is conceptualised, designed, constructed and sometimes operated by them. The housing providers know the operation of the housing market, and how they relate to government, third-party agencies and the homebuyers.
CONCEPTUAL JUSTIFICATIONS
While income has increased by approximately 101% since 1999, housing prices have increased by more than 200% within the same period (Table 2). While the private final consumption stood at RM556.6 billion in 2015, housing operations constitute the largest part of the private consumptions (DOS, 2016). The implication of this is that for Malaysians to have a decent home, they will have to cut down expenditure on food, health, social life, entertainments, and education. While the consumer index for all major items dropped from 3.2 in 2011 to 2.1 in 2015, that of housing and its operations increase from 1.8 to 2.5 within the same period.
Table 1: The Malaysian Average House Price by House Type, 2009-2016
Year All house Terraced High rise Detached Semi
detached
2009 204,470 176,413 161,863 364,424 354,540
2010 215,678 185,505 172,651 382,512 374,697
2011 239,295 207,702 192,852 402,124 417,563
2012 271,384 234,934 223,735 454,186 465,612
2013 301,964 256,910 254,115 516,750 522,062
2014 330,428 284,136 277,729 565,869 554,402
2015 354,741 303,826 299,182 601,785 591,575
2016 379,843 326,445 326,204 642,775 619,767
Source: NAPIC (2017)
Table 2 Annual House Price Index and house price1999-2014
Year Index (2000=100 1-Yr % Change Household income
2000 100 - -
2001 101.1 6 -
2002 103.6 1.1 2,049
2003 107.7 2.5 -
2004 112.9 4 2,211
2005 115.6 4.8 -
2006 117.8 2.4 -
2007 124 1.9 2,552
2008 129.8 5.3
2009 131.8 4.7 2,841
2010 140.7 1.5
2011 154.6 6.7
2012 172.8 9.9 3,626
2013 192.9 11.8
2014 213.6 11.6 4,585
2015 236.2 7.3
Thus, the policy question is what is the cause of the increase in the price of housing? The increase in housing is leaving many homeless and many are living in deplorable conditions. Although the increase in the housing prices can be examined from multiple stakeholders, this current study focused on the supply side including the contractors, developers, government agencies and the design teams. Increase in housing price would affect government policies, citizens’ productivity and well-being. It would affect developers and contractors profit margins and revenues. Collectively academic literature suggests housing prices could increase because of many factors including, materials, location, interest rate, neighbourhood, social capital, lack of recreational facilities and transportation (Olanrewaju & Woon, 2017; Olanrewaju et al., 2016; Ying, Olanrewaju, & Tan, 2015; UN-HABITAT, 2011; Ong & Chang, 2013; Osman et al., 2017d). Although many studies have been conducted on housing prices, empirical studies on the causes based on developers and contractors experience are nascent or inconclusive.
OUTLINE OF THE RESEARCH METHOD
The survey was conducted in two phases which were through hand delivery and online survey. The first phase was administered to the respondents that attended the ARCHIDEX (International Architecture, Interior Design & Building Exhibition 2016) in the Kuala Lumpur Convention Centre using convenience sampling. ARCHIDEX is held annually and attended mostly by architects and other stakeholders in the construction sectors (i.e. engineers, quantity surveyors, developers, contractors) in Malaysia and around the South East Asian countries. The ARCHIDEX 2016 was held on 20 July 2016 to 23 July 2016 and attended by more than 3,000 delegates and exhibitors. This survey was conducted on 23rd (Saturday) July 2016. 96 completed survey forms were returned. The second phase was conducted through online Google survey form from November 2017 to December 2017. Respondents from the online survey were recommended to help forward the form to their colleagues that are competent to provide valid responses. By the cut-off date, which was four weeks after the online survey was first launched, 19 valid forms were returned. The factors leading to the increase in housing prices from literature (Olanrewaju & Woon, 2017; Olanrewaju et al., 2016; Ying et al., 2015; UN-HABITAT, 2011; Ong & Chang, 2013; Pillaiyan, 2015; Knight Frank, 2015) and the authors’ experiences were included in the survey form.
RESULTS AND DISCUSSION
Respondents’ profile
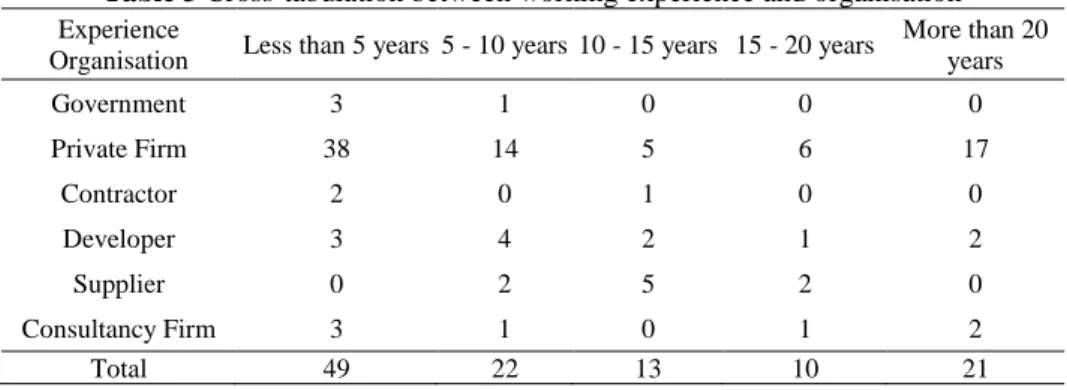
their job positions, 36% of the respondents were architects, 9% was chief executive officers, and 12% were directors and managers. In terms of professional background, the majority (60%) were architects followed by engineers (12.2%) and quantity surveyors (5.2%). Most of the respondents worked for private organisations and about 60% had more than 5 year working experience (Table 3). Private firm implies (i.e. architectural, engineering, quantity surveying consulting firm) consultant companies. About 10% specifically worked for developers. 55% of the respondents were involved in affordable housing design and construction. Almost all the respondents had memberships in Board of Architect Malaysia, Board of Surveyor Malaysia or REHDA.
Table 3 Cross-tabulation between working experience and organisation
Experience
Organisation Less than 5 years 5 - 10 years 10 - 15 years 15 - 20 years
More than 20 years
Government 3 1 0 0 0
Private Firm 38 14 5 6 17
Contractor 2 0 1 0 0
Developer 3 4 2 1 2
Supplier 0 2 5 2 0
Consultancy Firm 3 1 0 1 2
Total 49 22 13 10 21
Analysing the Major Causes of Increase in Housing Price
significant. Therefore, all the factors were adequate and suitable to be included in the survey to achieve the aim of the research.
The profile of the respondents is not discussed further, and only 13 main factors leading to the increase in housing price are briefly discussed after general discussions of the results are provided. Considering the relationship between the mean and standard deviation, the results interpreted that more than 70% of the respondents measured the factors that would increase prices of houses. In fact, the percentage of the respondents that disagreed or strongly disagreed was 27.52%. Exactly 42.35% agreed and strongly agreed to the ratings. 32.13% slightly agreed. It is also obvious that 13 of the factors were the most influential for estimating housing prices. Location was considered as the factor that had the highest influence on the housing price according to the entire respondents. 88% of the respondents indicated that the housing location had the highest impact on housing price. This result was expected because the price of lands and the associated costs related to land were varied extensively. Lands in the cities were very expensive compared to lands outside the cities. Regulations on lands and construction in the cities were also very strict, especially for affordable housing. It was also not surprising that the respondents rated the size of the house as the second most influential factor for housing price. This was because costs of construction were actually determined by the size of the house. For instance, in Malaysia, housing was priced at RM1, 200/m2 in Kuala Lumpur. It was interesting to discover that innovation and skills were considered as the next most influencing factor on housing prices. This was not expected, however, construction costs were significantly influenced by the level of technology employed by the developers and construction on site. For instance, consultants’ fees, claims and delay can also be reduced by using software like BIM.
Table 4: Distribution of ranking of factors leading to housing price
Ca u se S tro n g ly Ag re e Ag re e S li g h tl y Ag re e Disa g re e S tro n g ly Disa g re e Re li ab ility Va li d it y S td . De v iatio n Ca u sa l In d ex
Location - urban/rural 18 83 12 2 0 0.809 0.754 0.577 1.983
Size of the house 10 56 48 1 0 0.809 0.728 0.649 2.348
Innovation and skills 11 61 35 7 1 0.813 0.798 0.774 2.357
Developers’ profit
margin 12 63 28 10 2 0.814 0.793 0.852 2.365
Strategic factors 2 63 46 4 0 0.807 0.604 0.596 2.452
Rising labour costs 14 40 24 37 0 0.791 0.871 1.046 2.730 Economic uncertainty
and financial risks 13 40 27 35 0 0.794 0.884 1.020 2.730
Planning restriction on
the use of land 6 24 79 5 1 0.802 0.758 0.660 2.748
Quality of material &
component use 6 30 65 13 1 0.806 0.682 0.753 2.765
Leasehold / freehold
house 0 54 33 28 0 0.796 0.829 0.817 2.774
Climate changes 0 55 32 25 3 0.825 0.774 0.874 2.791
Interest rates 9 35 41 30 0 0.800 0.589 0.920 2.800
Households confidence
on future price 12 38 23 42 0 0.807 0.623 1.045 2.826
Number of new houses
being built 3 28 62 22 0 0.804 0.734 0.730 2.896
Geographical factors 3 41 32 39 0 0.798 0.847 0.896 2.930
Availability of facilities [eg: swimming pool, gym room, basketball field, playground & etc.)]
13 25 29 44 4 0.804 0.844 1.096 3.009
Layout of the house 3 29 29 26 28 0.792 0.883 1.184 3.409
Stamp duty 5 18 38 25 29 0.793 0.877 1.157 3.478
Currency exchange rate 8 24 23 24 36 0.791 0.741 1.314 3.487
Permit fees 3 17 38 28 29 0.793 0.891 1.102 3.548
The developer’s profits were also rated as a major factor that would cause the price of a house to increase and reduce. This was interesting and the findingwas not surprising because previous research reported that the profit margin of Malaysian developers was very high at around 20% (Ying et al., 2015). Strategic factor, marked by the proximity of the housing to schools, hospitals, place of works, and the market was also rated to be a major determinant of housing prices. This was expected because housings that were close to schools, markets, and workplaces were preferable to homebuyers, for strategic reasons including a reduction in the cost of transports because of accessibility, conformability and conveniences reasons.
The housing industry was labour intensive and most of the sites operatives were from the neighbouring countries. With government regulations on foreign labour, some projects were already been impacted. Economic uncertainty and financial risks were also measured as an influential contribution to housing price.
The profit margins of developers and contractors depend on the economic situations in a country especially due to imported goods and materials. Developers tend to reduce their investment in order to reduce their exposure to financial risks. Construction business involved large investments and as a result the developers also depend on loan from the banks. During recession, most businesses including housing developers would reduce their activities to reduce loss.
As previously stated, prices of lands had the most influential impact on the housing price. Therefore, restriction on the use of the land would undoubtedly upset the cost of construction and ultimately the price of the completed housing. Quality of materials was also found to make dominant bearing on the prices of houses. This was not surprising because the quality of materials determined housing production costs like any other goods and services in the marketplaces. The type of land ownership was also recognized as major factor influencing the prices of houses. This finding was not very surprising because leaseholders would not only have to worry about the grant rent on the land, but the land would be reverted back to freeholder on the expiration of the tenure. The result was consistent with literature.
The respondents also indicated that climate change would affect housing price. This finding was not difficult to agree with as heavy rainfalls, floods, mudslides are gradually becoming part of homebuyers’ checklist in Malaysia. Homebuyers are demanding for houses that would be résistance to impact of earthquakes, landslides, and mudslides especially those at the hill-sides (Olanrewaju, Tan, Tat, & Mine, 2017). Without argument, interest rates had a significant impact on the cost of home production. Technically developers and contractors would transfer the amount they paid as interest to the homebuyers and this would, in turn, led to increase in the housing prices.
CONCLUSION AND RECOMMENDATIONS TO THE HOUSING PROVIDERS
reported is that the government need to lessen the regulations and control on lands in order to increase homeowners and also to reduce authorities’ development charges. The developers also need to reduce their profit margin expectations through proper risk assessment and reduction. Future studies on similar topic should increase the sample size and examine the practical measures to reduce housing prices. Also, future research should investigate the relationships between the causes of increase in housing prices and the causal factors and examine the association among the factors. The ranking of the factors alone would not be able to provide structural advice to place managers, developers, urban planners and policymakers.
ACKNOWLEDGEMENT
The research presented in this paper was supported in full by a grant from the "FRGS"; project: Analytical Investigation of Problems in Housing Supply in Malaysia. Project number: FRGS/1/2015/TK06/UTAR/02/2.
REFERENCES
Department of Statistics [DOS] (2014). Report on characteristics of household 2010:
Population and housing census of Malaysia. Available at
https://www.statistics.gov.my
Department of Statistics [DOS] (2016). Macro-economic key data at current prices. Available at www.statistics.gov.my
Department of Statistics [DOS] (2017). Current population estimates, Malaysia, 2016-2017. Available at https://www.dosm.gov.my
Demographia (2017). 13th annual Demographia international housing affordability survey: 2017 rating middle-income housing affordability. Retrieved from www.demographia.com/dhi.pdf.
Khazanah Research Institute [KRI] (2015). The State of Household. Kuala Lumpur: Author.
Knight Frank (2015). Malaysian real estate highlights 2nd half 2015. Retrieved from https://www.knightfrank.com/publications/malaysia-real-estate-highlights-2h2017-5210.aspx.
Loan criteria won’t resolve affordable housing issue. (2017, July 19). The StarOnline.
Retrieved from
https://www.thestar.com.my/business/business- news/2017/07/19/bank-negara-loan-criteria-review-wont-resolve-affordable-housing-issue/
National Property Information Centre [NAPIC] (2014). The Malaysian house price index
by house type. Available at www.jpph.gov.my.
National Property Information Centre [NAPIC] (2014 - 2015). Property overhang. Available at http://napic.jpph.gov.my/portal
Q4 year 2015 (Property Overhang Q4 2015). Available at www.jpph.gov.my. National Property Information Centre [NAPIC] (2017). The Malaysian house price index
increased by 5.3% in Q1P 2017 relative to Q1 2016. Available at
www.jpph.gov.my.
Olanrewaju, A., Tat, L. L., Tan, S. Y., Naoto, M., & Abdul Aziz, A. (2016). Analysis of economic determinants of affordable housing price. In H. H. Lau, F. E. Tang, C. K. Ng, & A. Singh (Eds.), Integratedsolutions for infrastructure development
(pp. 1-6).
Olanrewaju, A. & Woon, T. C. (2017). An exploration of determinants of affordable housing choice. International Journal of Housing Markets and Analysis, 10(5), 703-723.
Olanrewaju, A., Tan, Y. S., Tat, L. L., & Mine, N. (2017). Analysis of homeowners’ behaviours in housing maintenance. Procedia Engineering, 180, 1622-1632. Ong, S. T. & Chang, S. Y (2013). Macroeconomic determinants of Malaysian housing
market. Human and Social Science Research, 1(2), 119-127.
Osman, M. M., Bachok, S., Shuid, S., & Khalid, N. (2017a) Factors influencing housing prices among local people: a study in Perak, Malaysia. Advanced Science Letters, 23(1), 165-168.
Osman, M. M., Muhamad Yusop, S. W., Shuid, S., & Abdullah, M. F. (2017b). Housing affordability index for districts in Perak.Advanced Science Letters, 23(7), 6049-6052.
Osman, M. M., Rabe, N. S., Abdullah, M. F., Rosli, N. F., & Zainudin, F. E. (2017c) Housing affordability in the state of Melaka. Planning Malaysia: Journal of the Malaysian Institute of Planners, 15(1), 255-260.
Osman, M. M., Ramlee, M. A., Samsudin, N., Rabe, N. S., Abdullah, M. F., & Khalid, N. (2017d). Housing affordability in state of Johor. Planning Malaysia, 15(1), 347-356.
Pillaiyan, S. (2015). Macroeconomic drivers of house prices in Malaysia. Canadian Social Science, 11(9), 119-130.
Real Estate and Housing Developers' Association Malaysia [REHDA] (2016). MIER’s
residential property survey report 4Q 2015. Available at http://rehda.com/ UN-HABITAT (2011). Affordable Land and Housing in Asia. Nairobi: UNON,
Publishing Services Section.