SPECIAL ISSUE IV (2016), Page 411 - 426
MONITORING THE PERFORMANCE OF STATE STRUCTURE PLAN IN DELIVERING OUTPUT USING DYNAMIC MODEL
Muhammad Faris Abdullah1, Alias Abdullah2, Rustam Khairi Zahari3 & Samsuddin Jaafar4
1,2,3,4
Kulliyyah of Architecture & Environmental Design INTERNATIONAL ISLAMIC UNIVERSITY MALAYSIA
Abstract
Plan outputs are the material objects that are tangible and provided as a result of the implementation of a development plan. They often act as precursor to achieving plan outcomes. Therefore, it is important to monitor the performance of plan in delivering its outputs so that the prospect of achieving its outcomes remains high. However, present state structure plan monitoring programmes focus mostly on monitoring land use change and not plan output delivery. The absence of output monitoring reduces the usefulness of the programmes and contributes to under-provision of outputs, especially public facilities and open spaces. This study proposes that state structure plan monitoring programmes must include mechanism to monitor the performance of the plan in delivering plan outputs. To this end, a dynamic model for monitoring performance of state structure plan in delivering open spaces was developed using STELLA software and applied on the Selangor State Structure Plan. The model simulation showed that the Selangor State Structure Plan has performed poorly in delivering the open spaces where their provision has not conform to the plan’s targets. The model simulations also show that this non-conformances will remain by the end of the plan’s planning period.
Keyword: plan monitoring, plan performance, dynamic model
INTRODUCTION
Talen (1997) bemoans the fact that development plan success (or failure) is increasingly being measured against factors that are detached from the traditional role of planning in the built-environment. She argues that the focus of built-environment is largely object-oriented. Thus, the core of planning function is to effect object-oriented changes in the built-environment. And since planners use development plan to guide them in their efforts to implement those changes, she opines that plan success must also be viewed in terms of its performance in effecting those changes.
which are the intangible results of development plan implementation such as improved environmental quality, safer living environment and reduced illiteracy rate.
Going by Talen’s suggestion that the core of planning is to effect object-oriented change, and Faludi’s categorisation of plan output and outcome, it is clear that among the main functions of development plan is to deliver outputs. In most instances, development plan’s policies include the need to deliver plan outputs. These policies must be acted upon if outcomes are to be achieved (Barret, 2004; Davidson, 2000). This is because, outputs are precursors to outcomes (Vedung, 1997). For instance, in an attempt to reduce illiteracy rate (outcome), it is necessary that sufficient number of schools (output) are firstly provided so that education can be easily accessed by the population. Inability of development plan to provide outputs as intended will jeopardise the success of the plan in realising its outcomes. Thus, it is important that development plan performance in delivering those outputs must be monitored and, if necessary, improved so that the plan can succeed.
PLAN OUTPUT MONITORING
The amount of any given output that a plan needs to deliver is projected during the plan’s preparation phase. The projection may be based on a number of assumptions, but most commonly it is based on population projection (Leung, 2003). Plan outputs are typically described in terms of unit and time (Faludi, 2000; Seasons, 2003), such as the number of houses to be built within five years, or the number of open space required within the next ten years. Calkins (1979) calls this as the plan’s end-state targets.
While the number of output required is determined during plan preparation, the actual delivery of the output occurs during the plan’s implementation phase. However, development plans are usually long-term plans with long implementation period. For instance, in Malaysia, the implementation period of state structure plans (SSP) ranges from fifteen to twenty years. Therefore, throughout the long implementation period, the number of output required as initially projected during plan preparation may no longer be applicable. As plan is being implemented, the number of output required may increase or decrease, depending on the number of population of the planned area. Thus, the number of output required must be regularly monitored and revised based on the number of population so that the planning authorities would know exactly how many of the plan outputs that they need to provide in order to cater the demand of the community sufficiently.
Plan output is monitored based on the conformance of its changes on the ground to its end-state target, or the plan’s stated intention (Barret & Fudge, 1981; Mastop & Faludi, 1997; Talen, 1997). This means that if the actual output change on the ground is in concurrence with the plan’s initial projection, the output is said to be in conformance to the plan. Otherwise, the output is considered to be non-conformance to the plan.
Despite its importance, prior studies related to monitoring of plan output conformance is limited. Although some scholars do investigate plan conformance, these are centred on outcome conformance (or more specifically on land use change) rather than output conformance (Ahmad Nazri Muhamad Ludin, Mohd Nuruddin Abdul Kadir, & Susilawati Sulaiman, 2009; Alterman, Carmon, & Hill, 1984; Chapin, Deyle, & Baker, 2008; Combe, 2008; Hao, Sliuzas, Zhan, & Geertman, 2009; Laurian et al., 2010; Tarmiji Masron & Ruslan Rainis, 2004). Except for Calkins (1979), who proposes a ‘planning monitor’ to measure plan output conformance. He suggests that, by using the planning monitor, performance of plan can be measured based on conformance of actual output change to end-state target. This is done by measuring the rate of increase in output change at the time of measurement against the target.
Nevertheless, Calkins’ planning monitor measures output conformance to static end-state target. Whereas, we suggest that plan output monitoring must be more dynamic. Since output requirement is based on population, the end-state target may not be appropriate anymore if there are changes to the population number. Thus, output monitoring mechanism must be able to inform of any changes in population number as well as the actual output required based on the changes in the population number. To this end, we propose that a dynamic model is developed to monitor the output delivery of development plan.
DYNAMIC MODEL
Dynamic model, also sometimes referred to as ‘system-dynamic model’, is a modelling method that stemmed from system dynamics thinking (Forrester, 1970; Guhathakurta, 2002). A dynamic model is basically a mathematical model that exploits mathematical functions and uses ‘if-then’ rules to represent and simulate a system (Ford, 1999; Ortolano & Perman, 1990). Dynamic model is often used to replicate and to simulate a system with the purpose of understanding how the system works, and to use this understanding to explain what has happened and to project what will happen next, with a view to improve the system (Saeed, 2002; Santos, Belton, & Howick, 2002).
Extensive literature review does not reveal any prior study that experiments with the application of dynamic model in monitoring plan output conformance. However, dynamic model itself is not alien to planning researches. Previous studies related to dynamic model application in the planning field are largely concerned on the application of the model in the planning and management of the environment, and in evaluating the impacts of planning policies (Deal & Schunk, 2004; Guo et al., 2001; Han, Hayashi, Cao, & Imura, 2009; Simmonds, 1999). This is most likely due to the fact that dynamic model does not handle spatial analysis well (Guo et al., 2001; Han et al., 2009), especially when most planners seem to believe that spatial analysis is the main important analysis in planning context.
STATE STRUCTURE PLAN MONITORING IN MALAYSIA
(Muhammad Faris Abdullah, Alias Abdullah, & Rustam Khairi Zahari, 2009, 2010). Similarly, only a handful of local scholars have undertaken researches into plan monitoring (Ahmad Nazri Muhamad Ludin et al., 2009; Ahris Yaakup, 2004; Tarmiji Masron, 2003; Tarmiji Masron & Ruslan Rainis, 2004).
Inadequate emphasis on monitoring of development plan is not limited to Malaysia only. Planning scholars have observed that, over the years, planning research and practice the world over have largely been centred around plan preparation, such as refining plan preparation process, and improving methods and techniques of plan-making. Meanwhile, few researches and practices deal with plan implementation and monitoring (Berke et al., 2006; Laurian et al., 2010; Seasons, 2003; Talen, 1997). Even in countries where plan monitoring is mandatory, such as in the United Kingdom, plan monitoring remains scarce (Carmona & Sieh, 2008).
In terms of state structure plan (SSP) monitoring in Malaysia, presently only three are being monitored. These are the Negeri Sembilan SSP, the Melaka SSP and the Terengganu SSP. In Negeri Sembilan, the State Department of Town and Country Planning (DTCP) employs a purposely-developed GIS-based system to monitor the implementation of its SSP (Ahris Yaakup, Siti Zalina Abu Bakar, & Susilawati Sulaiman, 2009). The system, which is also known as GIS9, monitors actual changes in land use within the state and compares them to the land use allocation as proposed by the Negeri Sembilan SSP (UGisP, 2006). In Melaka, the State DTCP monitors land use changes using GIS-based charting system (Zainuddin Ahamad, personal communication, 7 November 2008). The charting system refers to the use of GIS software, in this case MapInfo, to map and to calculate the existing land use coverage of the state, which is then compared manually with the land use allocation as proposed by the Melaka SSP. In Terengganu, SSP monitoring relies on meetings and paper-and-pen approach (Nik Husni Nik Rashid, personal communication, 30 June 2008). Several meetings were held where representatives from all agencies involved in the implementation of the Terengganu SSP were invited to participate. Paper forms, which listed all the projects proposed by the SSP, were distributed to the representatives during the meeting. They were then asked to fill in the forms with the existing status of the projects implementation. Percentages were used to indicate how far a project has been implemented. A report was then prepared.
As can be seen above, all of the SSP monitoring focuses on land use change, and not plan outputs. While the monitoring of land use change may be of interest to the State DTCP, it may not be as useful to the other implementing agencies. These includes the various technical agencies whose roles in SSP implementation are mainly to provide the outputs that have been identified as required by the SSP such as houses, hospitals, schools, open spaces, and so on (Ahmad Nazri Muhamad Ludin et al., 2009). What is more important to them in terms of SSP monitoring would be information feedback such as the number of facilities already being provided and how many more of these facilities need to be provided (Muhammad Faris Abdullah et al., 2009).
STATE STRUCTURE PLAN AND OPEN SPACE PROVISION
quality as well as quality of life. Therefore, it is important that open spaces are being provided sufficiently to meet the needs of the community and also to attain high quality environment.
Despite its importance, open space is commonly under-provided in Malaysia. This is demonstrated in Table 1 below where the amount of open space land provided in the states of Selangor, Perak and Pahang, at the beginning of the states’ SSP period, was well below the amount required. Under-provision of open space land is the highest in Perak where 81% of the required open space land was not provided.
Table 1: Status of Open Space Provision in Selected States at the Beginning of Their SSP Period
State Existing (ha) Required (ha) % difference
Selangor 9,651 14,242 32%
Perak 1,314 7,002 81%
Pahang 1,758 4,380 60%
Source: Jabatan Perancangan Bandar dan Desa Negeri Selangor (2007), Jabatan Perancangan Bandar dan Desa Perak Darul Ridzuan (2008), Kerajaan Negeri Pahang Darul Makmur (2008).
Identifying and analysing the needs for open space are among the important functions of a development plan. For instance, the Town and Country Planning Act 1976 states that, among others, “…development plans shall formulate and propose measures to improve physical living environment and social well-being, as well as the making up of open spaces.” Thus, during SSP preparation, the number of open space that the SSP need to deliver was projected using population as its basis. The population thresholds for open space projection are predetermined in the planning guidelines published by the Federal DTCP (Jabatan Perancangan Bandar dan Desa Semenanjung Malaysia, 2005). These thresholds are as listed in Table 2 below.
Table 2: Population Thresholds and Minimum Land Size Requirements for Open Space Type Population threshold (person) Minimum land size
requirement (ha)
Urban park 50,000 40.0
Local park 50,000 8.0
Neighbourhood park 12,000 2.0
Play park 3,000 0.6
Play lot 1,000 0.2
Source: Jabatan Perancangan Bandar dan Desa Semenanjung Malaysia (2005)
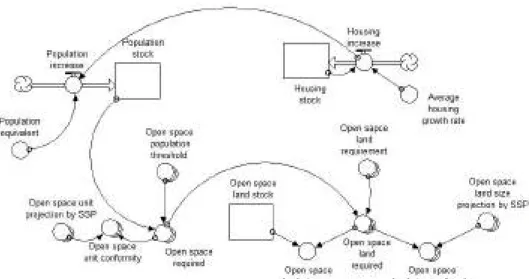
DYNAMIC SSP OUTPUT MONITORING MODEL
Figure 1: Dynamic SSP Output Monitoring Model
Two types of conformance analyses are proposed in the model, which are ‘conformity analysis and ‘gap analysis’. The former is about determining whether the Selangor SSP open space target will be met by the end of the plan’s planning period and the latter to determine whether the number of output change meet demand based on the population number. Conformity analysis would help planning authority to assess the effectiveness of the plan’s end-state target and to establish new target if necessary. Gap analysis would help planning authority to understand the current state of output provision and to identify any shortage or surplus of the output.
For the purpose of conformity analysis, the following is observed:
𝐶 = 𝛽𝑅− 𝛽𝑋 (1)
where output conformance (C) is the difference between the number of output required (𝛽𝑅) and the plan’s output target (𝛽𝑋). Full conformance occurs when 𝐶 is equal to zero. A negative 𝐶 means the plan’s target is greater than the number of output required and indicative of under-conformance. Meanwhile, a positive 𝐶 means that the number of output required exceeds the plan’s target, indicating over-conformance.
Meanwhile, gap analysis observes the following equation:
𝐺 = 𝛽 − 𝛽𝑅 (2)
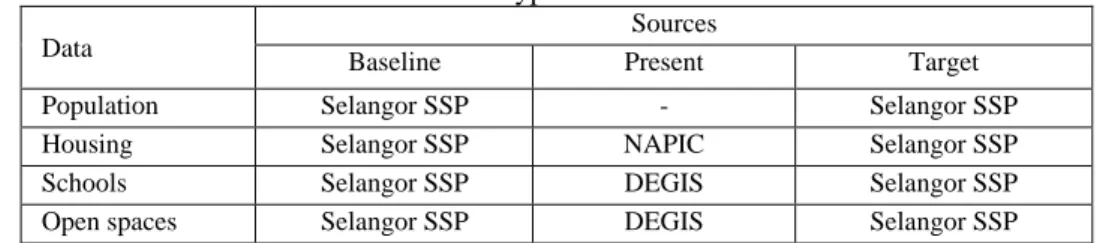
future. However, existing population data is difficult to come by. In Malaysia, the national population census, which is often regarded as the main source of actual population data, is only conducted once in every ten years. In between the censuses, planners have to rely on estimations in order to determine the existing population number of a planned area. Therefore, the model uses proxy data, in the form of housing, to determine population number. In Malaysia, housing development requires planning permission. Thus, housing data for a planned area is easier to collate and update since planning authorities keep records of all planning permission granted. The Malaysian National Property Information Centre also records and updates housing data for all states in Malaysia. It also publishes the housing data through its property market reports. Other data required by the model are collected also from secondary sources. Table 3 below details out the types of data gathered and their sources.
Table 3: Data Types and Data Sources Data
Sources
Baseline Present Target
Population Selangor SSP - Selangor SSP
Housing Selangor SSP NAPIC Selangor SSP
Schools Selangor SSP DEGIS Selangor SSP
Open spaces Selangor SSP DEGIS Selangor SSP
As can be seen in Table 3, all baseline and target data are sourced from the Selangor SSP itself. Meanwhile, present data for housing is sourced from the property market reports published by the National Property Information Centre of the Ministry of Finance (NAPIC), Malaysia. Present data (existing stock) of open space are sourced from the Darul Ehsan GIS (DEGIS) database. The base year and the target data is needed for the purpose of calibrating the model so that it can replicate the output projection method as employed by the SSP. Meanwhile, the present data are needed so that the model can run simulations in order to analyse the conformance and gap of the open space delivery. Present data are from year 2010.
It has to be noted here that present data for open space obtained is incomplete in the sense that not all existing open space in Selangor is identified by type. As such, gap analysis for open space cannot be undertaken.
ANALYSIS AND FINDINGS
The model is set to run simulation from year 2000 until year 2020, which is the planning period of the Selangor SSP. The model is also set to display simulation results at every five-year intervals throughout the simulation period. The results of the simulation are as follow.
Open Space Projection
Table 4: Selangor Open Space Required Projection
Type Year
2000 (nos.) 2005 (nos.) 2010 (nos.) 2015 (nos.) 2020 (nos.)
Urban park 84 102 121 140 158
Local park 84 102 121 140 158
Neighbourhood park 349 427 504 582 660
Play park 1,396 1,707 2,018 2,328 2,639
Play lot 4,189 5,121 6,053 6,984 7,916
The results in Table 4 show that the total number required for each type of open space is projected to increase throughout the simulation period. In the case of urban park and local park, their projected number is similar to one another. This is because of their requirement is based on similar population threshold, which is 50,000 people (refer Table 2). Thus, it can be seen from Table 4 that the present number of urban park required is projected by the model at 121 units, which is similar to the number of local park required. In the meantime, the total number required for neighbourhood park, play park and play lot at present are 504 units, 2,018 units and 6,053 units, accordingly. By the end of the Selangor SSP planning period, the number of open spaces required are projected to increase to 158 unit for urban and local parks, 660 units for neighbourhood park, 2,639 units for play park and 7,916 units for play lot.
Figure 2: Selangor Open Space Required against SSP Projection: Urban Park, Local Park and Neighbourhood Park
Figure 3: Selangor Open Space Required against SSP Projection: Play Park and Play Lot
Open Space Conformity
Table 5 below shows the results for open space conformity for Selangor SSP. The results point to an obvious pattern where the conformity for all types of open space are in the negative initially, but become positive by year 2015. This means that initially, for each type of open space, the total number required is still less than the Selangor SSP year 2020 target (end-state target). However, by year 2015, the number required will already exceed the target. By year 2020, the conformity for all types of open space will continue to be in the positive, indicating over-conformance. For urban park and local park, their total
2000 2005 2010 2015 2020
UP required 84 102 121 140 158
UP SSP 5 92 103 114 125
LP required 84 102 121 140 158
LP SSP 6 92 103 114 125
NP required 349 427 504 582 660
NP SSP 20 395 443 490 535
0 100 200 300 400 500 600 700
Unit
Year
2000 2005 2010 2015 2020
PP required 1,396 1,707 2,018 2,328 2,639
PP SSP 457 1,592 1,785 1,972 2,149
PL required 4,189 5,121 6,053 6,984 7,916
PL SSP 1,086 4,783 5,367 5,922 6,456
0 1,000 2,000 3,000 4,000 5,000 6,000 7,000 8,000
Unit
Year
PP required
PP SSP
PL required
conformity by year 2020 will be at 33 units. Meanwhile for neighbourhood park, play park and play lot, their corresponding conformity will be at 125 units, 490 units and 1,460 units.
Table 5: Selangor Open Space Conformity
Type Year
2000 (nos.) 2005 (nos.) 2010 (nos.) 2015 (nos.) 2020 (nos.)
Urban park -41 -23 -4 15 33
Local park -41 -23 -4 15 33
Neighbourhood park -186 -108 -31 47 125
Play park -753 -442 -131 179 490
Play lot -2,267 -1335 -403 528 1,460
Open Space Land Projection
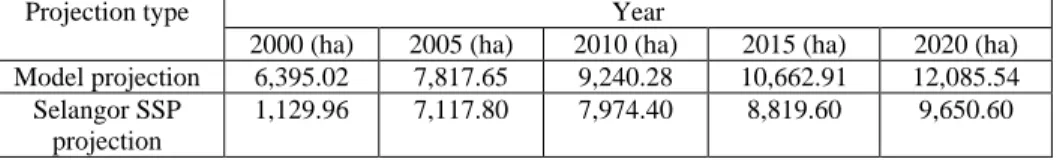
Table 6 below displays the total amount of open space land required as projected by the model, as well as the amount of open space land as projected by the Selangor SSP. From Table 6, it can be seen that throughout the simulation period, the total amount of open space land required keeps on increasing during the simulation period. By the end of the simulation period, the amount is projected to increase to 12,085.54 hectares. At any given year, the model projection for open space land required is always higher than that of the Selangor SSP.
Table 6: Selangor Open Space Land Projection
Projection type Year
2000 (ha) 2005 (ha) 2010 (ha) 2015 (ha) 2020 (ha) Model projection 6,395.02 7,817.65 9,240.28 10,662.91 12,085.54
Selangor SSP projection
1,129.96 7,117.80 7,974.40 8,819.60 9,650.60
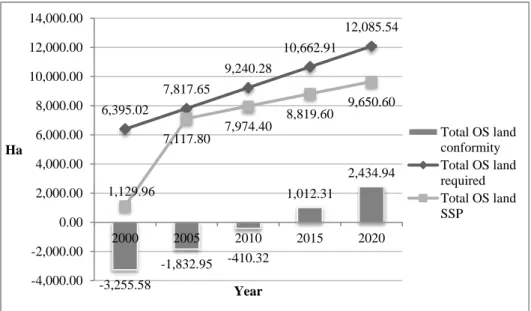
Open Space Land Conformity
The results for open space land conformity are shown in Figure 4 below. From the figure, it can be seen that up until year 2010, the total open space land size conformity is measured at -410.32 hectares. The negative conformity indicates that presently the total amount of open space land required is still below the Selangor SSP end-state target. However, by year 2015, the amount of open space land required is projected to already exceed the Selangor SSP target by 1,012 hectares, indicating over-conformance. By year 2020, the excess is projected to be even bigger at 2,434 hectares. This indicates over-conformance of open space land requirement will continue until the end of the Selangor SSP planning period.
Figure 4: Selangor Open Space Land Conformity
Open Space Land Gap
Figure 5 below plots the results for total open space land gap analysis for Selangor. The figure shows that the existing open space land stock in year 2010 stands at 2,388.71 hectares. Meanwhile, the total open space land required as projected by the model for that same year stands at 9,240.28 hectares. These inevitably resulted in a negative land size gap, which is measured at -6,851.57 hectares. This negative land size gap signifies that the present land stock is unable to meet the present demand, and hence, there is a shortage of open space land in the State of Selangor.
-3,255.58
-1,832.95 -410.32
1,012.31
2,434.94 6,395.02
7,817.65
9,240.28
10,662.91
12,085.54
1,129.96
7,117.80
7,974.40 8,819.60
9,650.60
-4,000.00 -2,000.00 0.00 2,000.00 4,000.00 6,000.00 8,000.00 10,000.00 12,000.00 14,000.00
2000 2005 2010 2015 2020
Ha
Year
Figure 5: Selangor Open Space Land Gap
In fact, Figure 5 shows that negative land size gap is not restricted only to year 2010, but is common throughout the simulation period. For instance, the land size gap for year 2000 was -4,006.31 hectares, and by year 2015, the gap is projected at -8,274.20 hectares. Eventually, by year 2020, the gap is expected to worsen at -9,696.83 hectares. The negative land size gap throughout the simulation period means that the present total open space land stock is very small that it would not meet the amount of land required at any point during the simulation period. The present open space land stock could not even meet the demand in year 2000, and it certainly would not meet the demand by year 2020. This further corroborates the earlier finding that, even at the beginning of the planned period, there was already a large shortage of open space land in Selangor. Moreover, if the present land stock remained, the shortage will only get bigger by year 2020.
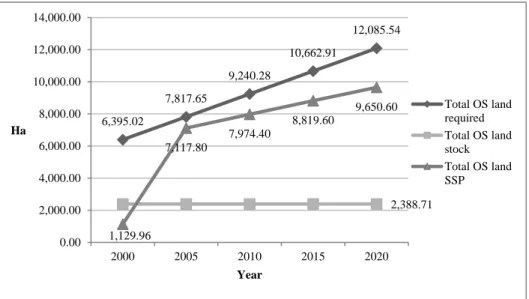
The status of total open space provision can be further assessed by comparing the increase in total open space land stock against the increase in total open space land required. The increase the land stock between year 2000 until year 2010 is represented by the difference between the initial SSP projection and the year 2010 stock. Thus, from Figure 6 below, it can be seen that the SSP projection for year 2000 was 1,129.96 hectares, while the existing year 2010 land stock is 2,388.71 hectares. These give a difference of 1,258.75 hectares, which is the actual increase of open space land stock within the period of year 2000 until 2010.
In the meantime, Figure 5.53 also shows that within that same ten year period, the total open space land required as projected by the model has increased from 6,395.02 hectares in year 2000 to 9,420.28 hectares in year 2010. These give a net increase of 2,845.26 hectares. This increase is higher than the increase in total open space land stock by 1,586.51 hectares. This means that, during the period, the increase in open space land stock has not been able to match the increase in open space land required, and hence, created ‘new’ shortage of open space land in Selangor.
-4,006.31
-5,428.94
-6,851.57
-8,274.20
-9,696.83 6,395.02
7,817.65
9,240.28
10,662.91
12,085.54
2,388.71
-15,000.00 -10,000.00 -5,000.00 0.00 5,000.00 10,000.00 15,000.00
2000 2005 2010 2015 2020
Ha
Year
Total OS land gap
Total OS land required
Figure 6: Comparison between Total Open Space Land Required, Stock and Targets
To be exact, during the period of year 2000 until 2010, the newly created open space land shortage for Selangor was 1,586.51 hectares. The state was already experiencing severe open space land shortage in year 2000. Now, with the addition of the new shortage on top of the initial one, the state is undoubtedly experiencing a much severe shortage of open space land presently than it did in year 2000.
DISCUSSION AND RECOMMENDATIONS
The simulation results show positive conformity for both open space required and open space land required by the end of the simulation period. This means that by year 2020 the number required for all types of open space, and the amount of land they require, will be higher than the targets set by the Selangor SSP. These indicate over-conformance. As such, in order to achieve 100% conformance, it may be necessary for the Selangor State DTCP to review the Selangor SSP open space end-state targets to follow the model projections. Otherwise, the authority may retain the SSP targets but must introduce corrective actions so that 100% conformance can be achieved by the end of the Selangor SSP planning period.
The simulation results also show that the State of Selangor was already facing shortage of open space, both in terms of unit and land, in year 2000. The open space land gap analysis shows that the shortage of open space land in Selangor is now bigger than it was in year 2000. This is due to the fact that between year 2000 until 2010, the increase in open space land stock has not matched the increase in open space land required for that same period, thus creating a ‘new’ shortage. This new shortage, when added on top of the initial shortage, makes for a bigger open space land shortage in Selangor. Thus, the State DTCP should give more attention towards the provision of open space in the future and try to close the gap between the amount of open space land provided and the amount required.
6,395.02
7,817.65
9,240.28
10,662.91
12,085.54
2,388.71
1,129.96
7,117.80
7,974.40
8,819.60
9,650.60
0.00 2,000.00 4,000.00 6,000.00 8,000.00 10,000.00 12,000.00 14,000.00
2000 2005 2010 2015 2020
Ha
Year
CONCLUSION
This study has shown that dynamic model can be used successfully to monitor the performance of SSP in delivering its outputs. Its application on the Selangor SSP shows that the SSP has performed rather poorly in terms of its open space output delivery. However, as mentioned earlier, this should not be taken as indication that the plan has failed. Rather, the information feedbacks resulting from the model application should be used to help the Selangor State DTCP in improving the performance of the SSP.
ACKNOWLEDGMENTS
The authors would like to express our gratitude to the Research Management Centre of the International Islamic University Malaysia and the Malaysian Ministry of Higher Education for the resources they provided to enable us to conduct research that leads to the production of this paper. We would also like to thank all the officers at States and Federal Department of Town and Country Planning Peninsular Malaysia, as well as all other individuals that supported us throughout the research.
REFERENCES
Ahmad Nazri Muhamad Ludin, Mohd Nuruddin Abdul Kadir, & Susilawati Sulaiman. (2009). Monitoring local plan compliance through land use monitoring system. Paper presented at the 11th International Conference on Computers in Urban Planning and Urban Management, Hong Kong.
Ahris Yaakup. (2004). GIS as a tool for development planning and monitoring. Paper presented at the NGIS 2004, Kuala Lumpur. http://eprints.utm.my/627/
Ahris Yaakup, Siti Zalina Abu Bakar, & Susilawati Sulaiman. (2009). Decision support systems for urban sustainability in Malaysia. Malaysian Journal of Environmental Management, 10(1), 101-118.
Alterman, R., Carmon, N., & Hill, M. (1984). Integrated evaluation: A synthesis of approaches to the evaluation of broad-aim social programs. Socio-Economic Planning Sciences, 18(6), 381-389.
Barret, S. (2004). Implementation studies: time for a revival? Public Administration, 82(2), 249-262.
Barret, S., & Fudge, C. (1981). Policy and action - essays in the implementation of public policy. London: Methuen.
Berke, P., Backhurst, M., Day, M., Ericksen, N., Laurian, L., Crawford, J., & Dixon, J. (2006). What makes plan implementation successful? An evaluation of local plans and implementation practices in New Zealand. Environment and Planning B: Planning and Design, 33, 581-600.
Calkins, H. W. (1979). The planning monitor: an accountability theory of plan evaluation. Environment and Planning A, 11(7), 745-758.
Carmona, M., & Sieh, L. (2008). Performance measurement in planning - towards a holistic view. Environment and Planning C: Government and Policy, 26(2), 428-454.
Combe, C. (2008). Monitoring the conformance of planning decisions to urban land use policies using Information Extraction and GeoVisualisation. (PhD), Napier University, Edinburgh.
Davidson, J. E. (2000). Ascertaining causality in theory-based evaluation. In P. J. Rogers, A. J. Petrosino, T. Hacsi & T. A. Huebner (Eds.), Program theory evaluation: challenges and opportunities. (pp. 17-26). San Francisco: Jossey-Bass.
Deal, B., & Schunk, D. (2004). Spatial dynamic modeling and urban land use transformation: a simulation approach to assessing the costs of urban sprawl. Ecological Economics, 51(1-2), 79-95.
Faludi, A. (2000, April 10-11, 2000). The performance of spatial planning. Paper presented at the Seminar on Spatial Development Policy and Territorial Governance in an Era of Globalisation and Localisation, Paris
Ford, A. (1999). Modeling the environment: an introduction to system dynamics modeling of environmental systems. Washington DC: Island Press.
Forrester, J. W. (1970). Systems Analysis as a Tool for Urban Planning. IEEE Transactions on Systems Science and Cybernetics, 6(4), 258-265.
Guhathakurta, S. (2002). Urban modeling as storytelling: using simulation models as a narrative. Environment and Planning B: Planning and Design, 29, 895-911. Guo, H. C., Liu, L., Huang, G. H., Fuller, G. A., Zou, R., & Yin, Y. Y. (2001). A system
dynamics approach for regional environmental planning and management: A study for the Lake Erhai Basin. Journal of Environmental Management, 61(1), 93-111.
Han, J., Hayashi, Y., Cao, X., & Imura, H. (2009). Application of an integrated system dynamics and cellular automata model for urban growth assessment: A case study of Shanghai, China. Landscape and Urban Planning, 91(3), 133-141.
Hao, P., Sliuzas, R., Zhan, Q., & Geertman, S. (2009). Land use deviations from the plan: a GIS based analysis of urban development in Shenzen. Paper presented at the 11th International Conference on Computers in Urban Planning and Urban Management, Hong Kong.
Jabatan Perancangan Bandar dan Desa Negeri Selangor. (2007). Rancangan Struktur Negeri Selangor 2020.
Jabatan Perancangan Bandar dan Desa Perak Darul Ridzuan. (2008). Rancangan Struktur Negeri Perak 2020.
Jabatan Perancangan Bandar dan Desa Semenanjung Malaysia. (2005). Garispanduan dan piawaian perancangan tanah lapang dan rekreasi. Kuala Lumpur: Jabatan Perancangan Bandar dan Desa Semenanjung Malaysia.
Kerajaan Negeri Pahang Darul Makmur. (2008). Rancangan Struktur Negeri.
Laurian, L., Crawford, J., Day, M., Kouwenhoven, P., Mason, G., Ericksen, N., & Beattie, L. (2010). Evaluating the outcomes of plans: theory, practice, and methodology. Environment & Planning B: Planning & Design, 37(4), 740-757.
Mastop, H., & Faludi, A. (1997). Evaluation of strategic plans: the performance principle. Environment and Planning B: Planning and Design, 24(6), 815-832.
Muhammad Faris Abdullah, Alias Abdullah, & Rustam Khairi Zahari. (2010). GIS implementation in Malaysian statutory development plan system. In C. N. Silva (Ed.), Handbook of research on e-planning: ICTs for urban development and monitoring (pp. 435-454). New York: IGI Global.
Ortolano, L., & Perman, C. D. (1990). Applications to urban planning: an overview. In T. J. Kim, L. L. Wiggins & J. R. Wright (Eds.), Expert systems: applications to urban planning (pp. 3-13). New York: Springer-Verlag.
Saeed, K. (2002). System dynamics: a learning and problem solving approach to development policy. Global Business & Economic Review, 4(1), 81-105. Santos, S. P., Belton, V., & Howick, S. (2002). Adding value to performance
measurement by using system dynamics and multicriteria analysis. International Journal of Operations and Production Management, 22(11), 1246-1272. Seasons, M. (2003). Monitoring and Evaluation in Municipal Planning. Journal of the
American Planning Association, 69(4), 430-440.
Simmonds, D. C. (1999). The design of the DELTA land-use modelling package. Environment and Planning B: Planning and Design, 26, 665-684.
Talen, E. (1997). Success, failure, and conformance: an alternative approach to planning evaluation. Environment and Planning B: Planning and Design, 24(4), 573-587. Tarmiji Masron. (2003). Ke arah pembangunan mapan: pembentukan petunjuk dan
sistem sokongan perancangan (PSS) bagi pemantauan pelaksanaan rancangan pembangunan bandar. (Doctorate), Universiti Sains Malaysia, Pulau Pinang. Tarmiji Masron, & Ruslan Rainis. (2004). Sistem sokongan perancangan (PSS): analisis
aplikasi bagi sektor-sektor terpilih. Jurnal Teknologi, B(40), 41-66.
UGisP. (2006). GIS9: Pembangunan Pengkalan Data Sistem Maklumat Geografi Negeri Sembilan Darul Khusus - Laporan Akhir Fasa III.