Emerging Science Journal
Vol. 2, No. 3, June, 2018
Mapping Global Research Output in Big Data during 2007-16
S.M.Dhawan
a,
B.M.Gupta
b*,
Ritu Gupta
caFormerly CSIR–NPL, New Delhi (Present Address: 114 DayanandVihar, Delhi 110092).India. bFormerly CSIR–NISTADS, New Delhi (Present Address: 1173 Sector 15, Panchkula 134 113, Haryana).India. cFormerly with Sri Venkateshwara University, Tirupathi, Andhra Pradesh (Present Address: 1K/A Arjun Nagar, Safdarjang
Enclave,New Delhi 110029),India.
Abstract
The paper examines global research in big data, as covered in Scopus database 2007-16, on a series of bibliometric indicators. The study finds that big data registered exceedingly fast growth (135.2%), but averaged low citation impact per paper (3.75) and accounted for very low share of highly cited papers (0.86%) in 10 years. The study reports publication trends in big data research by top countries, top institutions, top authors, top journals, major subject areas, publication modes, and country-level share of international collaborative publications. The study concludes that big data is a subject of recent origin. Given its major potential to impact business, governance, society, healthcare, industry and many other sectors, big data is fast emerging as a major discipline of interest and importance to nations, corporates, and institutions across developed and fast emerging economies.
Keywords:
Big Data Research, Global Publications; Scientometrics; Bibliometrics.
Article History:
Received: 17 May 2018
Accepted: 01 July 2018
1-
Introduction
Big data refers to massive data repositories, so huge and complex in size and data types, that traditional databases find it beyond their ability to capture, manage, and process such data sets and deriving therefrom new meaning and value that can dramatically improve business policies and practices. Big data sets are growing at dazzling speed in volume and variety and processing such larger data sets using standard IT technologies is a challenge. Big data includes structured, semi-structured, and unstructured data of diverse types and sizes ranging from terabytes to zettabytes. Unstructured data includes images, email, text messages, mobile and social media updates. The essence of big data is to create order from chaos, value from volume, and fresh insights from unexplored unstructured data. Major sources contributing to big data sets include mobile and social media, internet of things, and artificial intelligence sources, and that such big data sets are swelling by the minute in volume, velocity and variety [1].
Big data is an umbrella term that refers to the use of big data analytics, big data platforms, software tools and techniques to capture, store, analyze and harness previously untapped data sources independently or together with existing enterprise data. Data analytics techniques include text analytics, machine learning, predictive analytics, data mining, statistics, and natural language processing, businesses. These techniques can make data simple, accessible, and help gain analysts deep insight into raw data and useful to make better and faster decisions; improve business processes and policies [2-3].
Over the years, big data has evolved into a research and scientific study on how to make big data work [4]. The research studies in big data are into big data technologies, big data platforms and big data infrastructure. Big data studies are also into developing user toolsets designed to examine current data streams and big data repositories, and develop low cost and low complexity big data environment that is stable, highly integrated, and scalable. The challenge in big data research studies is how to make organizations big data ready, how to make the power of big data and big data
* CONTACT: [email protected]
DOI:http://dx.doi.org/10.28991/esj-2018-01135
analytics available to all the parts of the organization that need them to discover valuable insights, make better decisions and solve actual business problems.
1-1- Literature Review
Of late, a number of bibliometric studies have been conducted that are national and global in scope. Amongst these studies, Halevi and Moed [4] analyzed publications data on big data from several perspectives: time line, types of published papers, geographic output, disciplinary output and thematic and conceptual development. They download data from Scopus database and in conclusion described the emergence of global big data as a research topic. Singh, Banshal, Singhal and Uddin [5] studied big data research output published during 2010-14, and as covered in both databases, Web of Knowledge and Scopus, for research growth, authorship patterns, country-level research collaboration patterns, major contributors (countries, institutions and individuals), top publication sources, thematic and emerging themes in the field. Singh and Singh [6] mapped Indian research output in the area of big data published during 2001-15, using Scopus database, for understanding current status, growth, and collaboration trends in big data research and diffusion of big data research in Indian scientific literature. Liu [7] analyzed big data research output (282 records using SSCI database during 2005-15) for understanding distribution of research by publication year, growth pattern, top journals, top subject areas, top countries/territories, academic institutions, top authors and applicability of Lotka’s law. Porter, Huang, Schuehle and Youtie [8] presented a meta-analysis of big data research activity, covering 7006 research publications since 2009 from Web of Science database. Using “tech mining" (bibliometric and text analyses of research publication abstract record sets), the authors provided a research landscape of who is doing what, where, and when. Mathisen, Wienhofen and Roman [9] presented the current status of empirical research in big data by mapping the collected research (covering 1778 contributions) according to the labels: variety, volume and velocity. Besides, they identified application areas of big data. The authors concluded that the share of publications conforming to empirical results is well below the average compared to computer science research as a whole. Kalantri et al [10] analyzed 6572 papers in big data field as indexed in in Web of Science TM Core Collection database from 1980 to 19 March 2015 and reported publication trends by document type and language, year of publication, top countries, top journals, top research areas, and top authors.
There were a few other bibliometric studies but covering only application dimensions of big data field in medical science. Liao, Liao, Lee, Li, Chiclana and and Zeng [11] used visualization tools (GraphPad Prism 5, VOSviewer and CiteSpace softwares ) to identify annual trends, top authors, top journals, top institutes, country-level citations and H-index, keywords distribution, highly cited papers, and co-authorship status. Gua, Lia, Lia and Lianga [12] provided an overview of healthcare big data research, research hotspots and future research directions. Youtie, Porter and Hunag [13] examined a dataset of 488 social science and humanities papers written about big data and concluded that eight sub-fields are important in framing social science research about big data. The big data field covering social science is evolving from general sociological considerations towards social science applications, issues, and privacy concerns.
1-2- Objectives
The study analyses the performance of global big data research during 2007-16, based on publications, citations and international collaborative publications covered in Scopus database. The focus of study in particular was to growth characteristics and pattern of world research output and its citation received; global publications output, share and citations of top 12 most productive countries; international collaboration share of top 12 most productive countries; the subject-wise distribution of global research output and its growth and decline; identification of significant keywords; publication productivity and citation impact 100 most productive organizations and authors; leading medium of communication and characteristics of top 96 high cited papers.
2-
Methodology
The global research output on big data studies was identified, retrieved and downloaded from the Scopus database (http://www.scopus.com) 2007-16, using a well formulated search strategy. The search strategy included using the term “big data” in “keyword tag”, “article title tag”, and “source title tag” ” and restricted search output to period 2007-16 in “date range tag”. This main search string was further restricted to individual country by name in “country tag” to ascertain publication output of top 12 most productive countries in big data research. The main search string was also refined by “subject area tag”, “country tag”, “source title tag”, “journal title name” and “affiliation tag” one by one and accordingly determined distribution of big data publications output by subject, collaborating countries, author-wise, organization-wise and journal-wise, etc. For citation data, citations to publications were collected from date of publication till 27 January 2018.
3-
Analysis
3-1- Publications Distribution
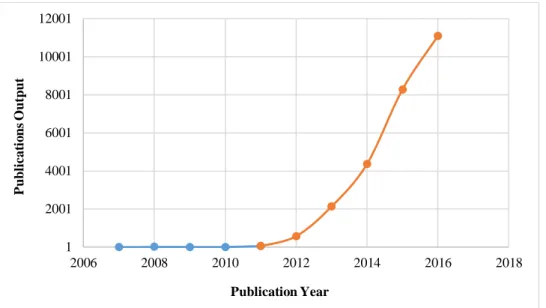
Big data research registered 136.84% CAGR growth, cumulated 26566 publications globally in 10 years during 2007-16, and witnessed a big jump in its annual output from just 2 in 2007 to 11104 publications in 2016. The second-half of the study period (2012-16) cumulated a five-year high of 26477 publications, compared to just 89 during the first-half (2007-11), an absolute five-year growth 29649%. The big data research averaged 3.75 citations per paper since publication in 10 years during 2007-16, and citation impact of its five-year output dropped from 39.58 CPS in 2007-11 to 3.63 CPS in 2012-16 (Figure 1, Table 1).
Figure 1. Global Research Output in Big Data Field: 2007-16.
Table 1. Global Research Output in Big Data Field: 2007-16.
Year Papers Citations Citations Per Paper (CPS)
2007 2 0 0
2008 13 942 72.46
2009 11 623 56.64
2010 9 152 16.89
2011 54 1806 33.44
2012 576 8441 14.65
2013 2138 18292 8.56
2014 4372 27950 6.39
2015 8287 28603 3.45
2016 11104 12781 1.15
2007-11 89 3523 39.58
2012-16 26477 96067 3.63
2007-16 26566 99590 3.75
Annual Growth 275.81% CAGR 136.84% Quinquennial Growth 29649.44%
Bulk of big data research appeared as conference papers (64.15%, 17043), and the remaining across other publication types such as articles (24.18%, 6423), book chapters (3.58%, 950), reviews (2.64%, 702), editorials (2.38%, 633), notes (0.97%, 139), short surveys (0.52%, 139), articles in press (0.46% , 121) and the rest as conference reviews (110), books (107), letters (61) and erratum(18) during 2007-16. The distribution of global publications output by language was skewed; as much as 96.65% share (25676) appeared in English and only 2.26% (600) in Chinese, 0.47% (125) in German, 0.21% (56) in Spanish, 0.20% (54) in French, and the rest in 15 other languages.
1 2001 4001 6001 8001 10001 12001
2006 2008 2010 2012 2014 2016 2018
P
u
b
li
cat
io
n
s
O
u
tp
u
t
3-2- Top 12 Most Productive Countries
In all, 161 countries participated in big data research during 2007-16, but only 12 had lead the field with their cumulative global output of 92.14%; their individual share varied between 2.40% and 27.98% of global output. The USA leads the world with 27.98% global share, followed closely by China (24.58%). Both USA and China account for more than 50% of global share, followed by India (6.62%), U.K. (5. 75%), Germany (5.11%), and others (Figure 2, Table 2).
Of the 12 top countries, six registered relative citation Index above the group average of 1.30: USA (1.88), UK (1.77), Canada (1.72), Australia (1.62), Italy (1.48) and Spain Korea (1.31) during the period (Table 2). China, India, Germany, and South Korea -- rated as the most productive countries after USA -- failed to register above average relative citation score, highlighting thereby gap in their performance in terms of quality and quantity of research.
Table 2. Publication Output and Global Publication Share of Top 20 Most Productive Countries in Big Data Research during 2007-16.
S. No Country Name TP TC %TP %TC CPP ICP %ICP RCI
1 USA 7434 52379 27.98 52.59 7.05 776 10.44 1.88
2 China 6529 21142 24.58 21.23 3.24 739 11.32 0.86
3 India 1758 3298 6.62 3.31 1.88 191 10.86 0.50
4 U.K. 1527 10121 5.75 10.16 6.63 733 48.00 1.77
5 Germany 1358 5699 5.11 5.72 4.20 501 36.89 1.12
6 South Korea 1071 3330 4.03 3.34 3.11 200 18.67 0.83
7 Australia 922 5611 3.47 5.63 6.09 502 54.45 1.62
8 Japan 904 2298 3.40 2.31 2.54 213 23.56 0.68
9 Italy 825 4575 3.11 4.59 5.55 328 39.76 1.48
10 Canada 818 5286 3.08 5.31 6.46 430 52.57 1.72
11 France 694 2821 2.61 2.83 4.06 346 49.86 1.08
12 Spain 638 3123 2.40 3.14 4.89 303 47.49 1.31
Total 24478 119683 4.89 5262 21.50 1.30 World Total 26566 99590 3.75
Share of 12 countries in World
Total
92.14
Figure 2. Quantity & Quality Comparative Study of Top Most Productive Countries: 2007-16.
0 5 10 15 20 25 30
0 0.2 0.4 0.6 0.8 1 1.2 1.4 1.6 1.8 2
USA China India U.K. Germany South Korea Australia Japan Italy Canada France Spain
3-3- International Collaboration
International collaboration in big data research has been common amongst top 12 most productive countries and published 10.44% to 54.45% of their national output as international collaborative publications. Australia published 54.45% of its national output, the highest amongst 12 most productive countries, as international collaborative publications, followed by Canada (52.57%), France (49.86%), France (45.69%), U.K. (48.0%), Spain (47.49%), Italy (39.76%), Germany (36.89%), Japan (23.56%), South Korea (18.67%), China (11.32%), India (10.86%) and USA (10.44%) during 2007-16.
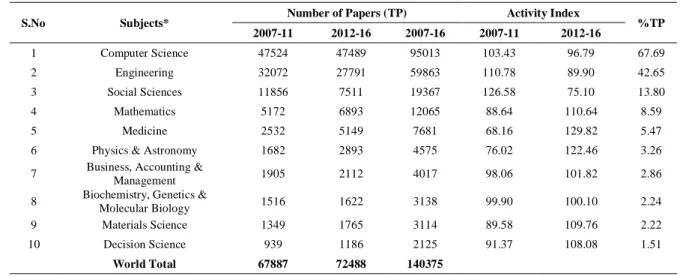
3-4- Subject-Wise Distribution of Research Output
The global big data research cuts across several disciplines as reflected in Scopus database classification. Computer science is the most studied subject in big data research accounting for 67.99% subject share, the highest compared to other subjects, followed by engineering (42.65%), social sciences (13.80%), and the rest in other subjects as covered in Table 3.
Table 3. Subject-Wise Break-up of Global Publications on Mobile Research during 2007-16.
S.No Subjects* Number of Papers (TP) Activity Index %TP 2007-11 2012-16 2007-16 2007-11 2012-16
1 Computer Science 47524 47489 95013 103.43 96.79 67.69
2 Engineering 32072 27791 59863 110.78 89.90 42.65
3 Social Sciences 11856 7511 19367 126.58 75.10 13.80
4 Mathematics 5172 6893 12065 88.64 110.64 8.59
5 Medicine 2532 5149 7681 68.16 129.82 5.47
6 Physics & Astronomy 1682 2893 4575 76.02 122.46 3.26
7 Business, Accounting &
Management 1905 2112 4017 98.06 101.82 2.86
8 Biochemistry, Genetics & Molecular Biology 1516 1622 3138 99.90 100.10 2.24
9 Materials Science 1349 1765 3114 89.58 109.76 2.22
10 Decision Science 939 1186 2125 91.37 108.08 1.51
World Total 67887 72488 140375
*There was overlapping of research output across various subjects
4-6- Significant Keywords
Around 69 significant keywords were identified from the literature that seeks to highlight broad trends in big data research. These keywords are listed in Table 4 in the decreasing order of their occurrence during 2007-16.
Table 4. List of Significant Keywords appearing in Big Data Research Literature during 2007-16.
S.No Name of Keyword Frequency S.No Name of Keyword Frequency
1 Big data 21961 36 Ubiquitous computing 519
2 Data mining 3733 37 Big data analytics 487
3 Data handling 2864 38 Metadata 484
4 Digital Storage 2454 39 Commerce 463
5 Cloud computing 2202 40 Bioinformatics 447
6 Algorithms 2126 41 Computer architecture 446
7 Artificial intelligence 2107 42 Websites 434
8 Information management 2076 43 Benchmarking 441
9 Distributed compute systems 1876 44 Network security 426
10 Social networking (Online) 1679 45 Information processing 425
11 Learning systems 1585 46 Information retrieval 425
12 Internet 1513 47 Health care 419
13 Map reduce 1260 48 World Wide Web 406
14 Big datum 1230 49 Behavioral research 402
15 Hadoop 980 50 Natural language processing 402
16 Semantics 945 51 Security of Data 396
17 Data privacy 916 52 Computer software 395
18 Internet of things 899 53 Data reduction 393
S.No Name of Keyword Frequency S.No Name of Keyword Frequency
20 Optimization 814 55 Web services 384
21 Information analysis 808 56 Intelligent systems 381
22 Forecasting 769 57 Semantic web 381
23 Data visualization 739 58 Computational linguistics 378
24 Complex networks 732 59 Image processing 364
25 Cluster algorithms 722 60 Software engineering 362
26 Machine learning 686 61 Scalability 360
27 Information systems 672 62 Application programming 359
28 Database systems 660 63 Neural networks 360
29 Search engines 610 64 Cryptography 337
30 Query processing 580 65 Transportation 316
31 Big data applications 572 65 Mobile devices 313
32 Learning algorithms 572 66 Pattern recognition 293
33 Computation theory 556 67 Virtual reality 293
34 Social media 543 68 Embedded systems 291
35 Education 529 69 Data communication systems 285
4-7- Top 100 Organizations in Big Data Research
Top 100 most productive organizations originated from 15 countries, and they contributed 60 to 347 publications each, accounted for 36.01% (9566) global publications share and 61.33% (61074) global citations share during 2007-16. Of 100 organizations, 70 had originated from just two countries, 36 from USA (with 3232 papers) and 34 from China (3801 papers). The rest originated from 13 countries, 7 of which were from Australia (613 papers), 4 from Hong Kong (275 papers), and others. Singapore registered the highest impact (14.23), the highest h-index (15.50), and Hong Kong the highest international collaborative publications (69.82% of national output). (Figure 3, Table 5)
Figure 3. Top 100 Organizations in Big Data Research by Country of Origin: 2007-16.
Table 5. Publication and Citation Profile of Top 100 Organizations by Country of Origin: 2007-16.
S. No. Country Name Organizations
Count TP TC CPP HI ICP %ICP
1 USA 36 3232 27493 8.51 12.56 1054 32.61
2 China 34 3801 16736 4.40 9.18 999 26.28
3 Australia 7 613 4349 7.09 12.86 341 55.63
4 Hong Kong 4 275 1898 6.90 10.50 192 69.82
5 U.K. 3 266 2898 10.89 15.00 151 56.77
6 South Korea 3 220 865 3.93 7.0 46 20.91
7 India 2 205 306 1.49 6.00 17 8.29
36 34
7
4 3 3 2 2 2 1 1 1 1 1 1
S. No. Country Name Organizations
Count TP TC CPP HI ICP %ICP
8 Singapore 2 191 2717 14.23 15.50 128 67.02
9 Italy 2 152 800 5.26 10.00 61 40.13
10 Canada 1 98 1028 10.49 14.00 69 70.41
11 France 1 139 499 3.59 12.00 49 35.25
12 Japan 1 86 160 1.86 6.00 17 19.77
13 Spain 1 77 439 5.70 10.00 47 61.04
14 Netherland 1 76 260 3.42 9.00 35 46.05
15 Taiwan 1 70 412 5.89 11.00 24 34.29
Total 100 9566 61074 6.38 10.95 33.97
Big data research involved participation of a total of 6802 global organizations, of which 5137 contributed 1-5 papers each, 766 organizations 6-10 papers each, 310 organizations 11-20 papers each, 230 organizations 21-40 papers each, 124 organizations 41-100 papers each and 235 organizations 101-348 papers each. On further analyzing these 100 organizations, it was observed that:
Of the top 100 organizations, 38 registered productivity above the group average of 95.66 publications per organization: Tsinghua University ,China (347 papers), Beijing University of Posts and Telecommunications, China (220 papers), Ministry of Education, China (209 papers), Shanghai Jiao Tong University, China (182 papers), Wuhan University, China (163 papers), National University of Defense Technology, China (161 papers), Carnegie Mellon University, USA (142 papers), Massachusetts Institute of Technology, USA (139 papers), CNRS Centre National de la Recherche Scientifique, France (139 papers), Beihang University, China (136 papers), Peking University, China (136 papers), IBM Thomas J. Watson Research Center, USA (132 papers), etc. Among the 38 organizations, 15 each were from USA and China, 3 from Australia, 1 each from Canada, France, India, Singapore and U.K. The scientific profile of top 20 most productive organizations are shown in Table 6
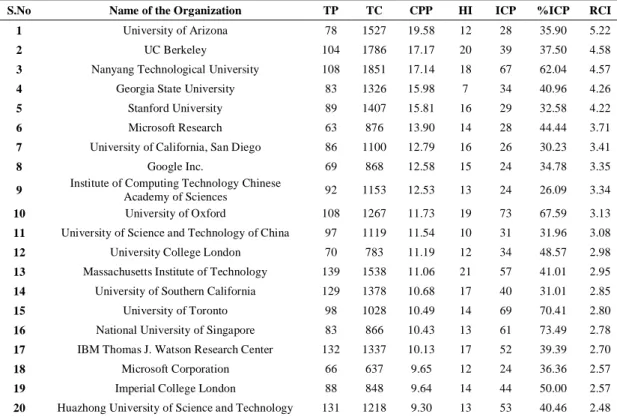
Of the top 100 organizations, 41 posted citation impact above group average of 6.38 citations per publication: University of Arizona, USA (19.58), University of California, Berkeley, USA (17.17), Nanyang Technological University, Singapore (17.14), Georgia State University, USA (15.98), Stanford University, USA (15.81), Microsoft Research, USA (13.90), University of California, San Diago, USA (12.79), Google, Inc., USA (12.58), Institute of Computing Technology, CAS, China (12.53), University of Oxford, U.K. (11.73), University of Science and Technology of China (11.54), University College London, U.K. (11.19), MIT, USA (11.06), University of Southern California, USA (10.08), University of Toronto, Canada (10.49), National University of Singapore (10.43), etc. Among the 41 organizations, 21 were from USA, 7 from China, 4 from Australia, 3 each from U.K. and Hong Kong, 2 from Singapore and 1 from Canada. The scientific profile of top 20 most productive organizations are shown in Table 6.
Of the top 100 organizations, 41 contributed international collaborative publications (ICP) above the group average share (33.97%): City University of Hong Kong (74.29%), National University of Singapore (73.49%), Hong Kong Polytechnic University (72.0%), University of Toronto, Canada (70.41%), Chinese University of Hong Kong (69.57%), Deakin University, Australia (68.57%), University of Oxford, U.K. (67.59%), University of Technology, Sydney, Australia (62.83%), Hong Kong University of Science and Technology (62.30%), Nanyang Technological University, Singapore (62.04%), etc. Of the 49 organizations, 19 were from USA, 7 from Australia, 6 from China, 4 from Hong Kong, 3 from U.K., 2 each from Italy and Singapore, and 1 each from Canada, Netherlands, South Korea, Spain and Taiwan. The scientific profile of top 20 most productive organizations are shown in Table 6.
Table 6. Scientometric Profile of Top 20 Global Organizations in Big Data Research by Productivity: 2007-16.
S.No Name of the Organization TP TC CPP HI ICP %ICP RCI
1 Tsinghua University 347 2453 7.07 20 110 31.70 3
2 Beijing University of Posts and Telecommunications 220 749 3.40 10 36 16.36 1
3 Ministry of Education China 209 772 3.69 14 34 16.27 0
4 Shanghai Jiao Tong University 182 1271 6.98 14 65 35.71 1
5 Wuhan University 163 556 3.41 12 34 20.86 0
6 National University of Defense Technology 161 456 2.83 11 28 17.39 1
7 Carnegie Mellon University 142 1289 9.08 17 53 37.32 2
8 Massachusetts Institute of Technology 139 1538 11.06 21 57 41.01 2
9 CNRS Centre National de la Recherche Scientifique 139 499 3.59 12 49 35.25 0
10 Beihang University 136 454 3.34 9 39 28.68 0
11 Peking University 136 363 2.67 11 33 24.26 0
12 IBM Thomas J. Watson Research Center 132 1337 10.13 17 52 39.39 1
13 Huazhong University of Science and Technology 131 1218 9.30 13 53 40.46 1
14 University of Southern California 129 1378 10.68 17 40 31.01 2
15 Zhejiang University 125 516 4.13 11 38 30.40 0
16 Amity Univerity, Noida 124 117 0.94 4 10 8.06 0
17 Harbin Institute of Technology 118 270 2.29 7 30 25.42 0
18 Georgia Institute of Technology 114 661 5.80 14 35 30.70 0
19 University of Technology Sydney 113 975 8.63 18 71 62.83 0
20 Nanjing University 113 592 5.24 15 37 32.74 0
Table 7. Relative Citation Index: of Top 20 Organizations in Big Data Research by 2007-16.
S.No Name of the Organization TP TC CPP HI ICP %ICP RCI
1 University of Arizona 78 1527 19.58 12 28 35.90 5.22
2 UC Berkeley 104 1786 17.17 20 39 37.50 4.58
3 Nanyang Technological University 108 1851 17.14 18 67 62.04 4.57
4 Georgia State University 83 1326 15.98 7 34 40.96 4.26
5 Stanford University 89 1407 15.81 16 29 32.58 4.22
6 Microsoft Research 63 876 13.90 14 28 44.44 3.71
7 University of California, San Diego 86 1100 12.79 16 26 30.23 3.41
8 Google Inc. 69 868 12.58 15 24 34.78 3.35
9 Institute of Computing Technology Chinese Academy of Sciences 92 1153 12.53 13 24 26.09 3.34
10 University of Oxford 108 1267 11.73 19 73 67.59 3.13
11 University of Science and Technology of China 97 1119 11.54 10 31 31.96 3.08
12 University College London 70 783 11.19 12 34 48.57 2.98
13 Massachusetts Institute of Technology 139 1538 11.06 21 57 41.01 2.95
14 University of Southern California 129 1378 10.68 17 40 31.01 2.85
15 University of Toronto 98 1028 10.49 14 69 70.41 2.80
16 National University of Singapore 83 866 10.43 13 61 73.49 2.78
17 IBM Thomas J. Watson Research Center 132 1337 10.13 17 52 39.39 2.70
18 Microsoft Corporation 66 637 9.65 12 24 36.36 2.57
19 Imperial College London 88 848 9.64 14 44 50.00 2.57
20 Huazhong University of Science and Technology 131 1218 9.30 13 53 40.46 2.48
Figure 4. Top 100 Organizations Big Data Research: Quantity vs Quality Performance.
3-8- Top 100 Most Productive Authors in Big Data Research
A total of 9269 authors participated in big data research during 2007-16, of which 8452 contributed 1-5 papers each, 621 authors 6-10 papers each, 174 authors 11-20 papers each and 22 authors 21-47 papers each.
Top 100 most productive authors in big data research varied in their productivity from 13 to 47 publications in 10 years. Of these 100 organizations, 24 were from USA (with 422 papers, 19 from China (3410 papers), 12 from Australia (257 papers), 6 each from Italy and U.K. (121 and 99 papers), and others. In terms of citation impact per paper, Sweden registered the highest impact (18.60), followed by Italy (12.59), Australia (12.41) and others (Table 8).
Table 8. Publication and Citation Profile of Top 100 Authors by Country of Origin: 2007-16.
S. No. Country Name No. of
Authors TP TC CPP HI %ICP
1 USA 24 422 3908 9.26 5.58 31.52
2 China 19 3410 2496 7.32 5.26 31.38
3 Australia 12 257 3190 12.41 8.25 69.65
4 Italy 6 121 778 6.43 5.0 24.79
5 U.K. 6 99 657 6.64 5.67 60.61
6 South Korea 5 81 545 6.73 5.20 43.21
7 Germany 4 66 504 7.64 5.25 22.73
8 Canada 4 67 658 9.82 5.75 71.64
9 Italy 3 58 730 12.59 7.33 72.41
10 Japan 3 50 172 3.44 4.0 66.0
11 Austria 2 31 369 11.90 6.50 70.97
12 Romania 2 29 191 6.59 4.50 27.59
13 Norway 1 22 70 3.18 4.0 54.55
14 Portugal 1 15 53 3.53 5.0 6.67
15 Macau 1 13 74 5.69 5.0 53.85
16 Netherlands 1 114 82 5.86 5.0 50.0
17 France 1 13 70 5.38 4.0 76.92
18 Switzerland 1 15 61 4.07 4.0 73.33
19 Taiwan 1 13 32 2.46 2.0 46.15
20 Sweden 1 15 279 18.60 10.0 100.0
21 Denmark 1 14 55 3.93 5.0 92.86
22 India 1 14 44 3.14 5.0 0.00
Together these 100 authors accounted for 6.70% (1779 publications) global share and 15.08% (15018) global citation share during 2007-16. On further analysis of these 100 authors, it was observed that:
Thirty five authors productivity among top 100 authors in big data varied from 60 to 347 publications cumulated in 10 years: A. Cuzzocrea (Italy)(47), R. Ranjan (Australia)(41), J. Chen (Australia)(34), X. Lu (USA) and G. Yu (China)(29 each), A. Y. Zomaya (Australia)(27), X. Zhang (U.K.) and L. T. Yang (China)(25 each), S. Nepal
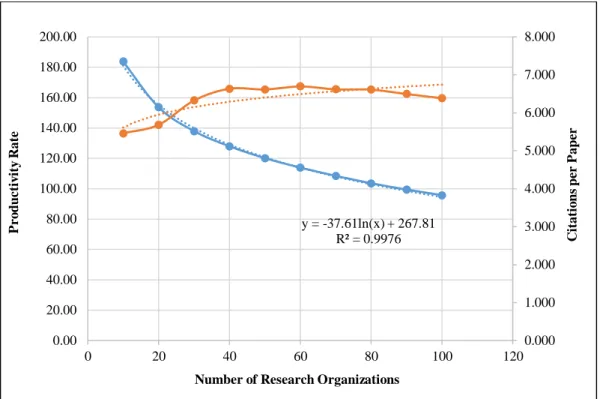
y = -37.61ln(x) + 267.81 R² = 0.9976
0.000 1.000 2.000 3.000 4.000 5.000 6.000 7.000 8.000 0.00 20.00 40.00 60.00 80.00 100.00 120.00 140.00 160.00 180.00 200.00
0 20 40 60 80 100 120
C it at io n s p er P ap er P ro d u ct iv it y R at e
(Australia)(24), F. Herrera (Spain)(23), etc. Of these 35 authors, 10 were from USA, 7 from China, 5 from Australia, 2 each from Japan, South Korea, Spain and U.K. and 1 each from Canada, Germany, Italy, Norway and Switzerland (Table 9)
Thirty six (with citation impact ranging from 0.14 to 54.05) amongst 100 authors registered citation impact above group average of 8.44 citations per publication: H. Chen (USA)(54.05), X. Meng (Romania)(20.0), F. Herrera (Spain)(19.52), J. Wan (China)(19.33), C. Yang (Spain)(19.33), A. V. Vasilakos (Sweden)(18.60), C. Liu (Spain)(18.06), T. Rabl (Canada)(17.10), L. Wang(China)(16.52), A. Y. Zomaya (Australia)(16.19), X. Zhang (USA)(15.76), Z. Xu (China)(15.67), V.Markl (Germany)(15.44), R. Ranjan (Australia)(15.32), M. Poess (USA)(15.27), etc. during 2007-16. Of these 36 authors, 10 were from USA, 6 from Australia, 5 from China, 4 from Spain, 3 from U.K., 2 each from Austria and Canada, and 1 each from Germany, Italy, Romania and Sweden.
Forty five (with ICP ranging from 0.0% to 100.00%) amongst 100 authors accounted for international collaborative publications (ICP) share above the group average (44.86%): A.Y. Zomaya (Australia), A.V. Vasilakos (Sweden), E. Kharlamov (U.K.), I. Horrocks (U.K.) and K. Li (USA)(100% EACH), R. Vatrapu (Denmark)(92.86%), L.T. Yang (China)(92.0%), T. Rabl(Canada)(90.0%) and Q. Jin (Japan)(90.0% each), S. Yu (Australia)(88.89%), J. Ma (Canada)(87.50%), F. Xhafa (Spain)(81.82%), etc. Of the 45 authors, 9 were from Australia, 8 from USA, 4 from China, 3 each from Canada and U.K., 2 each from Austria and Taiwan, and 1 each from France, Italy, Macau, Netherland, Norway, South Korea and Sweden.
Thirty six (with RCI ranging from 0.04 to 14.41) amongst 100 top authors accounted for relative citation index (RCI) share above the group average (2.25): H. Chen (USA)(14.41), X. Meng (Romania)(5.33), F. Herrera (Spain)(5.21), C. Yang (Australia)(5.16), J. Wan (China)(5.16), A. V. Vasilakos (Sweden)( 4.96), C.Liu (Spain)(4.81), T. Rabl (Canada)(4.56), L. Wang (China)(4.41), A.Y. Zomaya (Australia)(4.32), X. Zhang (USA)(4.20), Z. Xu (China)(4.18), V. Markl (Gerany)(4.12), R. Ranjan (Australia)(4.08), M. Poess (USA)(4.07), etc. during 2007-16. Of these 36 authors, 11 were from USA, 4 from Australia, 4 from China, 3 each from Span and U.K. , 2 from Austria and Canada, 1 each from Germany, Italy and Romania (Table 10).
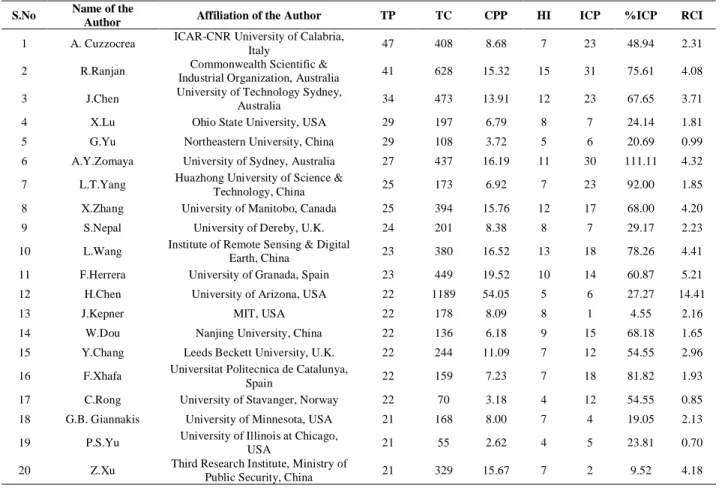
Table 9. Top 20 Most Productive Global Authors in Big Data Research, 2007-16.
S.No Name of the Author Affiliation of the Author TP TC CPP HI ICP %ICP RCI
1 A. Cuzzocrea ICAR-CNR University of Calabria,
Italy 47 408 8.68 7 23 48.94 2.31
2 R.Ranjan Commonwealth Scientific &
Industrial Organization, Australia 41 628 15.32 15 31 75.61 4.08
3 J.Chen University of Technology Sydney,
Australia 34 473 13.91 12 23 67.65 3.71
4 X.Lu Ohio State University, USA 29 197 6.79 8 7 24.14 1.81
5 G.Yu Northeastern University, China 29 108 3.72 5 6 20.69 0.99
6 A.Y.Zomaya University of Sydney, Australia 27 437 16.19 11 30 111.11 4.32
7 L.T.Yang Huazhong University of Science &
Technology, China 25 173 6.92 7 23 92.00 1.85
8 X.Zhang University of Manitobo, Canada 25 394 15.76 12 17 68.00 4.20
9 S.Nepal University of Dereby, U.K. 24 201 8.38 8 7 29.17 2.23
10 L.Wang Institute of Remote Sensing & Digital
Earth, China 23 380 16.52 13 18 78.26 4.41
11 F.Herrera University of Granada, Spain 23 449 19.52 10 14 60.87 5.21
12 H.Chen University of Arizona, USA 22 1189 54.05 5 6 27.27 14.41
13 J.Kepner MIT, USA 22 178 8.09 8 1 4.55 2.16
14 W.Dou Nanjing University, China 22 136 6.18 9 15 68.18 1.65
15 Y.Chang Leeds Beckett University, U.K. 22 244 11.09 7 12 54.55 2.96
16 F.Xhafa Universitat Politecnica de Catalunya,
Spain 22 159 7.23 7 18 81.82 1.93
17 C.Rong University of Stavanger, Norway 22 70 3.18 4 12 54.55 0.85
18 G.B. Giannakis University of Minnesota, USA 21 168 8.00 7 4 19.05 2.13
19 P.S.Yu University of Illinois at Chicago,
USA 21 55 2.62 4 5 23.81 0.70
20 Z.Xu Third Research Institute, Ministry of
Public Security, China 21 329 15.67 7 2 9.52 4.18
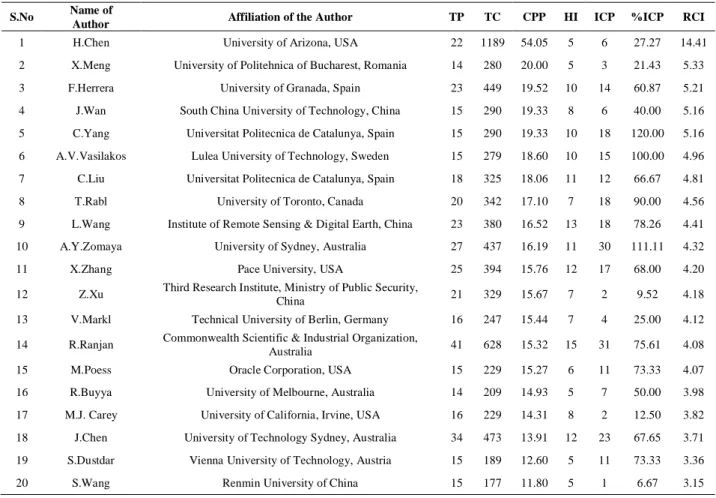
Table 10. Relative Citation Index of Top 20 Authors in Big Data Research, 2007-16.
S.No Name of
Author Affiliation of the Author TP TC CPP HI ICP %ICP RCI
1 H.Chen University of Arizona, USA 22 1189 54.05 5 6 27.27 14.41
2 X.Meng University of Politehnica of Bucharest, Romania 14 280 20.00 5 3 21.43 5.33
3 F.Herrera University of Granada, Spain 23 449 19.52 10 14 60.87 5.21
4 J.Wan South China University of Technology, China 15 290 19.33 8 6 40.00 5.16
5 C.Yang Universitat Politecnica de Catalunya, Spain 15 290 19.33 10 18 120.00 5.16
6 A.V.Vasilakos Lulea University of Technology, Sweden 15 279 18.60 10 15 100.00 4.96
7 C.Liu Universitat Politecnica de Catalunya, Spain 18 325 18.06 11 12 66.67 4.81
8 T.Rabl University of Toronto, Canada 20 342 17.10 7 18 90.00 4.56
9 L.Wang Institute of Remote Sensing & Digital Earth, China 23 380 16.52 13 18 78.26 4.41
10 A.Y.Zomaya University of Sydney, Australia 27 437 16.19 11 30 111.11 4.32
11 X.Zhang Pace University, USA 25 394 15.76 12 17 68.00 4.20
12 Z.Xu Third Research Institute, Ministry of Public Security,
China 21 329 15.67 7 2 9.52 4.18
13 V.Markl Technical University of Berlin, Germany 16 247 15.44 7 4 25.00 4.12
14 R.Ranjan Commonwealth Scientific & Industrial Organization,
Australia 41 628 15.32 15 31 75.61 4.08
15 M.Poess Oracle Corporation, USA 15 229 15.27 6 11 73.33 4.07
16 R.Buyya University of Melbourne, Australia 14 209 14.93 5 7 50.00 3.98
17 M.J. Carey University of California, Irvine, USA 16 229 14.31 8 2 12.50 3.82
18 J.Chen University of Technology Sydney, Australia 34 473 13.91 12 23 67.65 3.71
19 S.Dustdar Vienna University of Technology, Austria 15 189 12.60 5 11 73.33 3.36
20 S.Wang Renmin University of China 15 177 11.80 5 1 6.67 3.15
Top 100 authors in big data research post consistent fall in their productivity and their citation impact as their ranking order drops 1 to 100. This data reveals that top 10 organizations lead in publications productivity and citation impact (Figure 5).
Figure 5. Top 100 Authors in Big Data Research: Quantity vs Quality Performance.
3-9- Medium of Communication in Research
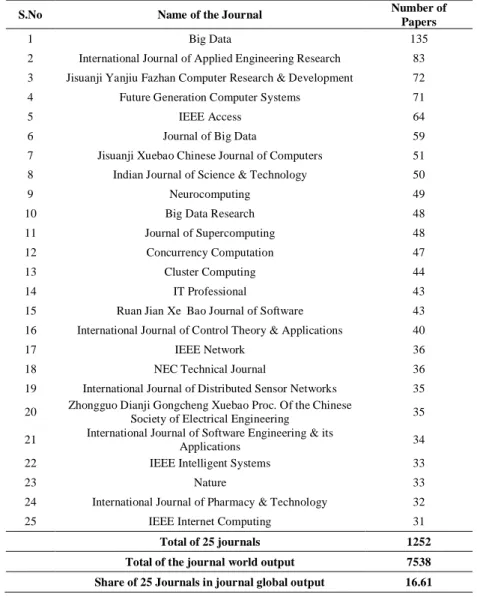
A total of 1603 journals reported 7538 papers in big data research in 10 years during 2007-16, of which 1025 journals contributed 1-5 papers each, 426 journals 6-10 papers each, 109 journals 11-20 papers each, 18 journals 21-30 papers each, 24 journals 31-100 papers each and 1 journal 135 papers. Of the 1603 reporting journals, 25 accounted for 16.61% share of 7538 journal papers, each reporting 31 to 135 papers during the period. The top most productive journal (with 135 papers) was Big Data, followed by International Journal of Applied Engineering Research (83 papers), Jisuanji
0.00 5.00 10.00 15.00 20.00 25.00 30.00 35.00
0 20 40 60 80 100 120
Yanjiu Fazhan Computer Research & Development (72 papers), Future Generation Computer Systems (71 papers), IEEE Access (64 papers), etc. (Table 11).
Table 11. Top 25 Most Productive Journals in Global Big Data Research during 2007-16.
S.No Name of the Journal Number of Papers
1 Big Data 135
2 International Journal of Applied Engineering Research 83
3 Jisuanji Yanjiu Fazhan Computer Research & Development 72
4 Future Generation Computer Systems 71
5 IEEE Access 64
6 Journal of Big Data 59
7 Jisuanji Xuebao Chinese Journal of Computers 51
8 Indian Journal of Science & Technology 50
9 Neurocomputing 49
10 Big Data Research 48
11 Journal of Supercomputing 48
12 Concurrency Computation 47
13 Cluster Computing 44
14 IT Professional 43
15 Ruan Jian Xe Bao Journal of Software 43
16 International Journal of Control Theory & Applications 40
17 IEEE Network 36
18 NEC Technical Journal 36
19 International Journal of Distributed Sensor Networks 35
20 Zhongguo Dianji Gongcheng Xuebao Proc. Of the Chinese
Society of Electrical Engineering 35
21 International Journal of Software Engineering & its
Applications 34
22 IEEE Intelligent Systems 33
23 Nature 33
24 International Journal of Pharmacy & Technology 32
25 IEEE Internet Computing 31
Total of 25 journals 1252 Total of the journal world output 7538 Share of 25 Journals in journal global output 16.61
3-10- Highly Cited Papers
Out of 11104 papers in big data research, less than 1 percent (96, 0.86%) received 100 to 100 + citations per paper in 10 years covering the period 2007-16. These 96 highly cited papers together cumulated 21259 citations, with an average of 221.45 citations per paper. Amongst 96 highly cited papers, 64 received 100-200 citations each, 14 received 200-299 citations each, 7 received 300-399 citations each, received 400-599 citations each, and the rest 8 papers were in 520-1098 citation range. These 96 highly cited papers originated from 19 countries. The USA accounted for the highest number of papers (64), followed by China (16 papers), U.K. (11 papers), Canada (6 papers), Australia and Singapore (5 papers each), South Korea (4 papers), Germany, Ireland, Italy and France (3 papers each), Japan and Spain (2 papers), Hong Kong, India, Malaysia, Macau, Netherlands and Turkey (1 papers each).
These 96 highly cited papers were published in 60 journals, with 3 papers each in Communications of the ACM, IEEE Access and Nature, 2 papers each in Big Data, Dialogue in Human Geography, Harvard Business Review, IEEE Communication Survey & Tutorials, IEEE Intelligent Systems, IEEE Signal Processing Magazine, IEEE Transactions on Emerging Topics in Computing, International Journal of Production Economics, Journal of Parallel & Distributed Computing and MIT Sloan Management Review, and 1 paper each in 31 other journals.
4-
Conclusion
The study provides a comprehensive description and analysis of big data research on a series on bibliometric indicators, covering research publications published across the world in 10-year during 2007-16. Big data research cumulated 26566 publications, and averaged 3.75 citations per paper since publication during the period. In addition, the study reports publication trends in big data research by top countries, top institutions, top authors, top journals, and popular subject areas. The study also characterized analytical outcomes on indicators like average citations per paper, relative citation index, average productivity, and country-level international collaboration share.
The study concludes that big data is a subject of recent origin. Given its major potential to impact business, governance, society, healthcare, industry and many other sectors, big data has emerged as a major discipline. Within a decade big data has witnessed big surge in its research growth to 135.6 %. Top countries like USA, China, India, UK, and Germany have played a prominent role in the growth of big data research even as 61 countries in all had participated and contributed to research in the field during the period. Top countries, top organizations, and top authors, however, differ in terms of qualitative dimensions in big data research measured on relative citation index, citations per paper, and high citations per paper count. Highly cited papers output is limited to less than 1 percent (96, 0.86%) of total big data research output in the world. Besides, highly cited papers output is localized to select few countries like USA and China. USA and China are the global leaders in big data research, whereas other high productivity countries in this field are still distant cousins.
5-
References
[1] Big data in action: definition, value, evolutions, benefits and context. https://www.i-scoop.eu/big-data-action-value-context [2] What is Big Data Analytics? https://www.ibm.com/analytics/hadoop/big-data-analytics#324371
[3] Moorthy, M., Baby, R. & Senthamaraiselvi, S (2014). An Analysis for Big Data and its Technologies. International Journal of Computer Science Engineering and Technology (IJCSET), Vol 4, Issue 12, 412-418.
[4] Halevi, Gali and Moed, Henk F. (2012). The Evolution of Big Data as a Research and Scientific Topic: Overview of the Literature. Research Trends (Special Issue), 3-6.
[5] Singh, V.K., Banshal, S.K., Singhal, K. et al. Scientometric mapping of research on ‘Big Data’. Scientometrics (2015) 105: 727-741. https://doi.org/10.1007/s11192-015-1729-9.
[6] Singh, Punit Kumar and Singh, Ajay P. Diffusion of Big Data in Indian Scientific Literature: Study of Research Productivity and Scientific Collaboration. Library Philosophy and Practice (e-journal) (2017).
[7] Mathisen, B.M., Roman, D., & Wienhofen, L.W. (2015). Empirical Big Data Research: A Systematic Literature Mapping. Information Systems arXiv:1509.03045 [cs.DL]
[8] Porter, A.L. Hunag, Y, Schuehle, Y and Youtie, Jan. Meta data: Big data research evolving across disciplines, players, and topics. Conference Paper. June 2015 DOI: 10.1109/BigDataCongress.2015.44. ieeexplore.ieee.org
[9] Mathisen, B.M., Roman, D., & Wienhofen, L.W. (2015). Empirical Big Data Research: A Systematic Literature Mapping. Information Systems arXiv:1509.03045 [cs.DL]
[10] Kalantari, A., Kamsin, A., Kamaruddin, H.S. et al. (2017). A bibliometric approach to tracking big data research trends. J Big Data (2017) 4: 30. https://doi.org/10.1186/s40537-017-0088-1
[11] Liao, Huchang, Ming Tang, Li Luo, Chunyang Li, Francisco Chiclana, and Xiao-Jun Zeng. “A Bibliometric Analysis and Visualization of Medical Big Data Research.” Sustainability 10, no. 2 (January 11, 2018): 166. doi:10.3390/su10010166.
[12] Gua, Dongxiao, Lia, Jingjing, Lia, Xingguo, Lianga, Changyong., 2017, Visualizing the knowledge structure and evolution of big data research in healthcare informatics. International Journal of Medical Informatics February 2017, 98, 22-32. https://www.sciencedirect.com/science/article/pii/S1386505616302556