New Approaches and Technologies for Quantifying Fecal Contamination in Tidal Creek and Coastal Receiving Waters
Curtis H. Stumpf
A dissertation submitted to the faculty of the University of North Carolina at Chapel Hill in partial fulfillment of the requirements for the Doctorate of Philosophy in the Department of
Marine Sciences
Chapel Hill 2011
Approved by:
Rachel T. Noble, Ph.D.
ABSTRACT
Curtis H. Stumpf: New Approaches and Technologies for Quantifying Fecal Contamination in Tidal Creek and Coastal Receiving Waters
(Under the direction of Rachel T. Noble)
The coastal waters of North Carolina (NC) are important recreational areas for bathing, fishing, and shellfish harvesting. However, much of these coastal waters are contaminated with fecal indicator bacteria (FIB) (Escherichia coli (EC) and Enterococcus
spp. (ENT)) which are used as proxies for pathogens of fecal origin. This fecal contamination largely occurs from improperly functioning septic systems, illicit discharges from wastewater treatment plants, and overland transport to water bodies during rainfall events.
Little is known about loading concentrations and characteristics (transport) of FIB in tidal creeks of the New River Estuary, NC. FIB frequently exceeded regulatory standards for fecal contamination in headwater portions o f tidal creeks. Total loads of 109 -1012 EC and ENT cells occurred over the course of storm events, and storm loading was as much as 30 to 37 times greater than baseflow loading for EC and ENT, respectively. Within the first 30% of creek storm volume for all storms and all creeks combined, a mean cumulative load of only 37% and 44% of the total EC and ENT cells, respectively, were discharged, indicating these creeks are not demonstrating first flush loading characteristics.
indicators, three alternative fecal indicator Bacteroides assays, and optical brighteners was utilized to make more robust source estimates of fecal contamination in four tidal creeks. Indicators of human contamination were found in all creeks despite relatively undeveloped land surfaces. One creek (Southwest) in particular had suggestive human fecal
contamination, as determined by agreement among the entire suite of indicators. Alternative indicator testing methods using Bacteroides spp. DNA assays and Quantitative Polymerase Chain Reaction (QPCR) proved useful at distinguishing human from animal fecal
contamination. However, QPCR for monitoring fecal indicators in complex tidal creek water matrices were less practical due to confounding factors.
The future of water quality monitoring will likely involve the use of rapid biosensors. However, current biosensor technologies are often limited by sensitivity and specificity of analysis. Methods were developed to concentrate, purify, and capture EC, ENT, and
Bacteroides spp. from marine and freshwater samples. Methods were optimized to
concentrate 5 L samples by factors of 221 – 317, with average recovery from concentration of 58.6 ± 20.0%, 48.3 ± 25.5 %, and 27.5 ± 19.1 % for EC, ENT, and B. thetaiotaomicron, respectively. An immunomagnetic separation (IMS) technique was also optimized to
selectively recover EC and ENTfrom samples using antibody labeled magnetic beads. IMS resulted in moderate recoveries of nearly 40% of EC and ENT from marine water samples, enabling detection in biosensor platforms.
Overall, this research provides approaches for calculating and characterizing FIB loading in headwater tidal creeks, using a multiple indicator approach for robustly
ACKNOWLEDGEMENTS
This research was conducted under the Defense Coastal/Estuarine Research Program (DCERP), funded by the Strategic Environmental Research and Development Program (SERDP). Views, opinions, and/or findings contained in this thesis are those of the author and should not be construed as an official U.S. Department of Defense position or decision unless so designated by other official documentation. Additional financial support was provided by Crystal Diagnostics and enumeration materials support from IDEXX. Thanks to Karen Bates at the Morehead City waste water treatment plant for assistance with influent collection, Tony and Patricia Rodriguez for assistance with particle size analysis and use of laboratory equipment, and Kathy Conn and Reagan Converse for technical review. Special thanks to the Pearl and Piehler laboratories, especially Susan Thompson and Rebecca
DEDICATION
TABLE OF CONTENTS
List of Tables ...xi
List of Figures ... xii
List of Abbreviations ...xvi
Chapter 1: Introduction ...1
Background ...2
Stormwater Microbial Loading of Tidal Creeks ...3
Sources of Fecal Contamination ...4
New Methods for Biosensor Detection of FIB ...5
References ...8
Chapter 2: Loading of fecal indicator bacteria in North Carolina tidal creek headwaters: hydrographic patterns and terrestrial runo ff relationships ...13
Introduction ...13
Methods...16
Results ...20
Discussion ...24
Conclusion ...32
References ...45
Introduction ...51
Methods...54
Results ...61
Discussion ...66
Conclusions ...74
References ...87
Chapter 4: Filtration and elution techniques for concentration of intact Escherichia coli, Enterococcus spp.,and Bacteroides thetaiotaomicron cells from seawater...93
Introduction ...93
Methods...96
Results and Discussion ...101
Conclusions ...109
References ...120
Chapter 5: Optimized capture and concentration of Enterococcus spp. and E. coli from water using Immunomagnetic Separation (IMS) ...125
Introduction ...125
Methods...128
Results ...134
Discussion ...137
Conclusions ...142
References ...151
Chapter 6: Conclusion...155
LIST OF TABLES Table
2.1 Watershed size, predominant soil and land use types for each tidal creek ...34
2.2 Loading differences between storm and baseflow (times greater), and days required during dry weather to equal total E. coli and Enterococcus spp. loading during an average storm for each tidal creek...35
2.3 Spearman rank correlations (R2) for all creeks combined and individual tidal creeks for loads versus rainfall metrics and t-test results for average event mean concentrations for EC and ENT during both storm and equivalent baseflow periods. ** Significant at
p<0.01 * Significant at p<0.5...36
3.1 Reaction conditions and standards for all QPCR assays ...77
3.2 Description of tidal creek predominant land cover, fecal indicator detection, and
percent exceedence of regulatory standards for conventional indicators ...78
3.3 Bivariate correlations among log transformed data from all creeks using two-tailed Spearman Rho rank correlation, and expressed as correlation coefficient r. ** indicates
p<0.01 ...79
4.1 Different methods and treatments tested for bacterial concentration, elution, and
particulate removal...111
4.2 Recovery of E. coli and particulate removal efficiency for seawater spiked with
E. coli concentrations of 103 MPN/100 mL ...112
LIST OF FIGURES Figure
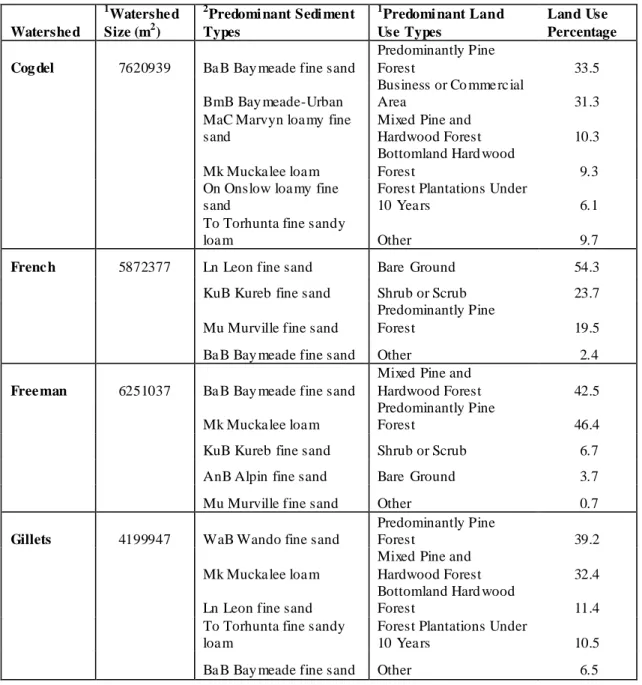
2.1 Streamflow (m3/s) versus log fecal indicator bacteria concentration (Most Probable Number (MPN)/100 mL) and Total Suspended Solids...38
2.2 Box plots for all creeks across all storms of mean (A) E. coli (B) Enterococcus spp. (C) flow (D) and total suspended solids ...39
2.3 Pollutograph representation of intra-storm variation in log concentrations of E. coli
(EC) and Enterococcus spp. (ENT) (MPN/100 mL), and total suspended solids (TSS)
(mg/L) during one representative storm in the four headwater tidal creeks ...40
2.4 Average mass to volume (M/V) plots, to determine fecal indicator bacteria load in
volume of creek discharge, for (A) E. coli and (B) Enterococcus spp. for each tidal creek ...41
2.5 Mean E. coli and Enterococcus spp. concentrations (MPN/g) for instream sediment during summer baseflow conditions in each tidal creek. Error bars represent standard
deviation...42
2.6 Relationship between log concentrations (MPN/100 mL) of E. coli and Enterococcus
spp. during wet weather (rainfall > 1.27 cm) stormflow samples, and dry weather
(rainfall = 0 cm) baseflow samples ...43
2.7 Study site including tidal creeks and map of Marine Corps Base Camp Leje une ...44
2.8 (A) E. coli and total suspended solids (log mg/L) during all conditions (B) and
Enterococcus spp. and total suspended solids (log mg/L) during all conditions.
** Significant at p<0.01 ...45
3.1 Marine Corps Base Camp Lejeune tidal creeks of study. Arrows indicate creeks
examined for Bacteroides spp. using three discrete assays ...80
3.2 Regulatory exceedences for E. coli (right half) and Enterococcus spp. (top half) for each creek during all sampling events. E. coli and Enterococcus spp. exceedences are
3.3 Mean log indicator concentration for each creek. Error bars represent the standard
error of the mean ...82
3.4 Box-plots of log mean concentrations of conventional and Bacteroides indicators for all creeks combined...83
3.5 Relationship of BacHum to HF183 results when HF183 assay produced positive
results. Spearman’s rho= 0.793 and p<0.05...84
3.6 A representative sample for optical brightener decay curves for each tidal creek and Tide 2x standard. Southwest Creek and the 2x Tide standard are positive for optical
brighteners...85
3.7 Relationships among mean log indicator concentrations from each tidal creek
headwater and percent land-development for each watershed ...86
4.1 Diagram of the Multi- filter Method (MFM) for concentration and elution of bacteria for sample volumes less than 1.5 L...113
4.2 Diagram of the In- line Method (ILM) for concentration and elution of bacteria for
sample volumes less than 5 L ...114
4.3 Seawater particulate diameter distribution composition for A. Raw seawater B. Nitex filtered seawater C. Geotech Dispos-a-filter seawater after filtration D. Seawater
centrifuged for 1 min. at 600×g and top 200 mL aspirated. (1) Represents artificial spike with a known grain size to achieve obscuration of the CILAS 1180 particle size analyzer, and (2) represent actual remaining particles in sample after
applied filtration or centrifuging treatment ...115
4.4 Mean total recovery (due to prefiltration, concentration, and elution step) percentage using optimized method for E. coli (EC), Enterococcus spp.(ENT),and
4.5 Concentration of Bacteroides thetaiotaomicron using Sybr Green bacterial staining enumeration method (A) 5 mL seawater (SW) before concentration (B) 100 µl SW after concentration ...117
4.6 Differences in concentration factor of MFM vs. ILM for E. coli ...118
4.7 Percent recovery of E. coli from seawater using Multi- filter Method (MFM) with 212-300 um glass beads vs. no beads, and elution with PBS, PBST-80, and PET
solutions. Error bars represent standard deviation ...119
5.1 The Immunomagnetic Separation Method (IMS) showing A) mixing, B) capture,
C) washing, and D) resuspension of cleaned sample with target bacterial cells ...144
5.2 Recovery of Enterococcus spp. using M280 streptavidin coated DynaBeads and Virostat biotin conjugated polyclonal Enterococcus spp. antibody. Seawater samples amended with sewage, cultured E. faecalis, and E. faecium, and two un-amended tidal creek samples (Gillets and Courthouse) were tested with for recovery of Enterococcus. Immunomagnetic separation indicates moderate capture of sewage amended and
environmental samples and poor capture of samples amended with cultured cells ...145
5.3 Recovery percentage with Dynal tosylactivated beads (concentration of 3.55 × 10⁷) and Meridian E. coli and Enterococcus antibody, mixed with particulates and sewage spiked (8 × 10³ per mL E. coli, 3 × 10³ per mL Enterococcus). All samples mixed with beads, incubated at 37o C at 25 rpm and enumerated after two washes ...146
5.4 Bead recovery of E. coli from bead concentrations of 106 to 107 beads per sample.
E. coli concentrations were ~7 × 10³ per sample, and samples were incubated at 37o C in a shaker incubator for 30 minutes. Average taken from combined Colilert-18 and
mTEC results. Error bars represent standard deviation ...147
5.6 Chemical additions to particle amended sewage spiked sample for 5, 15, and 30 minutes at 37° C and high speed mixing. Raw is the initial sample, and centrifuge control had no chemical added. Control(CNTRL) was 1x PBS, Quercetin(QC) 0.001M, Gallic Acid (GA) 0.001M, Ellagic Acid (EA) 0.0025M, Epigallocatechin Gallate (EA) 0.03 mg/ mL, and Catechin Hydrate (CH) 0.5 mg/ mL. All samples above reference line show greater bacterial availability in sample suspension after treatment ...149
5.7 Epifluorescent microscopy of E. coli bound to particulates and beads. Images were taken after 30 min incubation with magnetic beads and 2 washes. Particulates are still
ABBREVIATIONS Ab: Antibody
APHA: American Public Health Association ATCC: American Type Culture Collection BMP: best management practices
CDx: Crystal Diagnostics CE: cell equivalent
CFU: colony forming units Ct: cycle threshold
DST: defined substrate technology DNA: deoxyribonucleic acid
EPA: United States Environmental Protection Agency EC: Escherichia coli
ENT: Enterococcus species EMC: event mean concentrations FC: fecal coliforms
FIB: fecal indicator bacteria ILM: in- line method
IMS: immunomagnetic separation
LCLC: lyotropic chromonic liquid crystal LOD: limit of detection
MFM: multi- filter method MPN: most probable number M/V: mass to volume
NC: North Carolina
NCDWQ: North Carolina Division of Water Quality ND: non-detects
NRE: New River Estuary OB: optical brighteners
PBS: phosphate buffered saline
PBST: phosphate buffered saline + tween-20 PC: Polycarbonate
QPCR: quantitative polymerase chain reaction RNA: ribonucleic acid
SE: standard error SD: standard deviation
CHAPTER 1 Introduction and Background
Marine waters are important aesthetically, for recreation activities, and as economic stimulants for coastal communities (Lipp et al., 2001; Jeng et al., 2005; Stewart et al., 2007). However, increasing microbial fecal contamination continues to decrease the availability of these waters for recreational (swimming) and commercial uses (shellfish harvesting) and increases risk of disease acquisition from fecal pathogens (Washburn et al., 2003; Fuhrman et al., 2005). For instance, users of fecally contaminated water bodies for bathing and
consumers of shellfish from these waters have a higher risk of illnesses such as
gastrointestinal illness (diarrhea), skin rashes, respiratory related illness (Cabelli et al., 1979; Cabelli et al., 1982; Wade et al., 2006; Colford et al., 2007), and even death in cases of contaminated shellfish consumption (Rippey, 1994). Fecal contamination can originate from livestock, human waste (wastewater treatment plants as well as septic systems), and wildlife. Human source contamination in waters can occur from improperly functioning septic
systems, problems with wastewater treatment plants resulting in illicit discharges, and overland transport to water bodies during rainfall events. Conventional fecal indicator bacteria (FIB) (E. coli and Enterococcus) are used to determine if a water body is
contaminated with fecal material, and therefore pathogens (i.e. harmful bacteria and viruses). The coastal waters of North Carolina (NC) are important recreational areas for
biggest problems in North Carolina (NC) waters, resulting in closure of streams and estuarine waters (Mallin et al., 2000; Coulliette and Noble, 2008; Line et al., 2008). Within the New River Estuary (NRE) (the study site for much of this thesis research), 11.3 km2 of estuarine shellfish waters are impaired, and 62.8 freshwater km are listed as stressed due to fecal contamination, with 163 freshwater km yet to be assessed (NCDWQ 2007). The New River Estuary is of particular importance, due to its location within Marine Corps Base Camp Lejeune (MCBCL). MCBCL is the largest amphibious training base in the United States, simultaneously hosting more than 47,000 Marines. The need for clean water within this watershed is paramount, due to its use for amphibious military training as well as recreational activities such as bathing and shellfishing.
Despite the ubiquity of fecal contamination in many of NC estuaries and costal waters, little is known about transport (loading) or source of contamination (human vs. wildlife) of these fecal indicators. Furthermore, current methods for detection are slow, requiring 18-24 hours to results, increasing risk to water users, and establishing the need for rapid biosensor technologies for water quality analysis. This thesis has focused on ways to more rapidly and accurately determine fecal pathogens in NC estuarine waters. Research was conducted to better understand how these microbes are transported within a coastal syste m, new human-specific bacterial indicators were tested to differentiate between human and wildlife sources, and methods were developed to assist with emerging detection technologies (i.e. biosensors).
Background by Chapter
In eastern North Carolina (NC), tidal creeks are heavily utilized for shellfish harvesting, boating, fishing, swimming, and in the NRE, for amphibious military training (MCBCL, 2006). Loading of FIB to headwater, primarily freshwater, portions of tidal creeks can have cumulative affects downstream in high priority estuarine waters. Understanding FIB loading characteristics of these tidal creek headwaters during storm and baseflow periods is important for overall understanding of impairment and loss of beneficial use of waters of the NRE.
Current sampling methods estimate fecal pollution of waters based on geometric mean sampling or single sample thresholds (USEPA 1986). Due to the rapid fluctuations which can occur in fecal concentrations in stormwater, single sample strategies are often insufficient and could lead to inaccurate water quality designations (DiDonato et al., 2009). An intensive, multi- sampling strategy throughout storm hydrograph (Hyer and Moyer, 2004) and during baseflow is essential in characterization of fecal associated hydrologic patterns, and accurate fecal concentration and loading estimations. There have been no previous attempts to determine hydrological loading characteristics of fecal contamination in tidal creeks of the NRE. Because stormwater runoff can often account for a much greater portion of overall FIB loading in creeks when compared to non-event baseflow loading (Reeves et al., 2004; Surbeck et al. 2006; Krometis et al., 2007), characterizing loading patterns is important in order to accurately manage waters.
quantified during both base and storm flow conditions. FIB load relationships to stream flow and a first flush characterization are presented. Defining these loading trends will assist water quality managers in determining magnitude of water quality impairment, time needed for attenuation of pollutants, and making presumptive closures.
Sources of Fecal Contamination
Conventional indicators (fecal coliforms, Enterococcus spp., and E. coli) are limited in their ability to determine sources of fecal contamination. Understanding source of fecal contamination is paramount, since many pathogens of human concern are derived from human specific sources (Yan and Sadowsky, 2007). Some non-point source contaminated waters have little or very weak correlation with FIB and the occurrence of viral pathogens of human concern (Noble and Fuhrman, 2001; Jiang et al.,2004).The result of such findings could indicate that many waters polluted by non-point source runoff could be overestimating risks to human health (Colford et al., 2008). Therefore it is important to support conventional indicator results of fecal pollution with an indicator that is able to connect source of fecal pollution to human or non- human sources.
Species of Bacteroides have been proposed as alternatives to conventional indicators and as a better predictor of human contamination (Rolfe et al., 1977; Fiksdal et al., 1985).
2007). Previous research has found connections to human fecal contamination and
Bacteroides spp. using discrete assays (Bernhard et al., 2003; Dick and Field, 2004; Carson et al., 2005; Noble et al., 2006). Throughout the NRE, many creek and estuary waters are closed for shellfishing due to high FIB concentrations, though the sources of these fecal contaminants are unclear. Previous work has speculated that in certain tidal creeks (Freeman Creek), contamination from troop activities could be contributing to contamination during storm runoff (C2HM Hill Inc., 2000). Determining presence of Bacteroides spp. in tidal creek headwaters will increase understanding of sources of fecal contamination when combined with conventional fecal indicator data.
In Chapter 3, three Bacteroides spp. assays were examined in an effort to determine source (human vs. wildlife) of fecal contamination. Streams determined to have prevalent conventional FIB contamination were targeted. Optical brightener analysis was also conducted in order to examine if relationships existed between conventional indicators,
Bacteroides molecular assays, and optical brightener results. This “toolbox approach” will help elucidate the potential sources of fecal contamination and risk of exposure to military personnel during training activities, as well as recreational water users.
New Methods for Biosensor Detection of FIB
drawbacks in current technology, numerous rapid and simple biosensors for detection of bacteria and pathogens in waters are in research and development. Biosensors are collectively defined as instruments which bind and enumerate targeted analytes, such as pathogens in water, food, and clinical settings (Helfinstine, 2006).
The use of liquid crystal is one such potentially rapid technology under research and development for use as a biosensor medium. Specifically lyotropic chromonic liquid crystal (LCLC) is non-toxic to bacteria (Woolverton et al., 2005), and when used within a readable cell, could be sensitive and selective, producing results in less than 1 hour (Niehaus, 2004). Liquid crystals have a mesophase in which molecules form a crystal- like alignment, while still maintaining a liquid characteristic (Tam-Chang and Huang, 2008). Crystal Diagnostics (CDx) is currently developing a biosensor utilizing LCLC for detection of fecal indicators and other potential biohazards in both fresh and marine waters. The current prototype utilizes microspheres (magnetic beads) with labeled antibodies, which bind to specific target antigens to form immunocomplexes, resulting in disruption of the LC alignment and changes in
polarized light. Liquid crystal disturbances, or events, caused by aggregate
immunocomplexes can then be enumerated to quantify target cells (Shiyanovskii et al., 2005).
The CDx biosensor is currently in development to detect fecal indicators, including E. coli and Enterococcus spp. However, before testing of bacteria and pathogens can continue, the device must be optimized for dealing with water samples. Current limitations to the success of this prototype and other biosensors are the interference of particulates and
device. These are common problems with many new microbial detection technologies, as water quality thresholds have relatively low cell counts (e.g. 35 CFU/100 mL geometric mean, or 104 CFU/100 mL per single sample Enterococcus spp. thresholds at bathing beaches), while most devices can handle less than 1 mL volumes, requiring concentration of samples (Noble and Weisberg, 2005; Stewart et al., 2008). Chapters 4 and 5 examine sample preparation techniques with seawater samples, including concentration, filtration,
REFERENCES
Bernhard, A.E., Goyard, T., Simonich, M.T., Field, K.G. (2003). Application of a rapid method for identifying fecal pollution sources in a multi- use estuary. Water Research, 37, 909–913.
Cabelli, V.J., Dufour, A.P., Levin, M.A., McCabe, L.J., Haberman, P.W. (1979).
Relationship of microbial indicators to health effects at marine bathing beaches. American Journal of Public Health, 69(7), 690-696.
Cabelli, V.J., Dufour, A.P., McCabe, L.J., Levin, M.A. (1982). Swimming- associated gastroenteritis and water quality. American Journal of Epidemiology, 115(4), 606-616.
Carson, C.A., Christiansen, J.M., Yampara-Iquise, H., Benson, V.W., Baffaut, C., Davis, J.V., Broz, R.R., Kurtz, W.B., Rogers, W.M., Fales, W.H. (2005). Specificity of a
Bacteroides thetaiotaomicron marker for human feces. Applied and Environmental Microbiology, 71(8), 4945-4949.
Colford, J.M., Wade, T.R., Schiff, K.C., Wright, C.C., Griffith, J. F., Sukhminder, S.K., Burns, S., Sobsey, M., Lovelace, G., Weisberg, S.B. (2007). Water quality indicators and the risk of illness at beaches with nonpoint sources of fecal contamination. Epidemiology, 18(1), 27-35.
Coulliette. A.D., Noble, R.T. (2008). Impacts of rainfall on the water quality of the Newport River Estuary (Eastern North Carolina, USA). Journal of Water and Health, 6(4), 473-482.
C2HM Hill, Inc., (2000). Freeman Creek evaluation and assessment. Prepared for US Army Corps of Engineers, Contract No. DACA01-96-0028
Dick, L.K., Field, K.G. (2004). Rapid estimation of numbers of fecal Bacteroidetes by use of a quantitative PCR assay for 16S rRNA genes. Applied and Environmental Microbiology, 70(9), 5695-5697.
Fiksdal, L., Maki, J.S., LaCroix, S.J., Staley, J.T. (1985). Survival and detection of
Bacteroides spp. prospective indicator bacteria. Applied and Environmental Microbiology, 49(1), 148-150.
Fuhrman, J.A., Liang, X., Noble, R. T. (2005). Rapid detection of enteroviruses in small volumes of natural waters by real- time quantitative reverse transcriptase PCR. Applied and Environmental Microbiology, 71(8), 4523-4530.
Helfinstine, S.L., Lavrentovich, O.D., Woolverton, C.J. (2006). Lyotropic liquid crystal as a real time detector of microbial immune complexes. Letters in Applied Microbiology, 43, 27-32.
Hyer, K. E., Moyer, D. L. (2004). Enhancing fecal coliform total maximum daily load
models though bacterial source tracking. Journal of American Water Resources Association, 40(6), 1511-1526.
Ivnitski, D., Abdel-Hamid, I., Atanasov, P., Wilkins, E. (1999). Review: Biosensors for detection of pathogenic bacteria. Biosensors and Bioelectronics, 14, 599-624.
Jeng, H.A.C., Englande, A.J., Bakeer, R.M., Bradford, H.B. (2005). Impact of urban stormwater runoff on estuarine environmental q uality. Estuarine Coastal and Shelf Science, 63, 513-526.
Jiang, S.C., Chu, W. (2004). PCR detection of pathogenic viruses in southern California urban rivers. Journal of Applied Microbiology, 97(1), 17-28.
Kreader, C.A. (1998). Persistence of PCR-detectable Bacteroidesdistasonis from human feces in river water. Applied and Environmental Microbiology, 64(10), 4103-4105.
Krometis, L.H., Characklis, G.W., Simmons, O.D., Mackenzie, J.D., Likirdopulos, C.A., Sobsey, M.D. (2007). Intra-storm variability in microbial partitioning and microbial loading rates. Water Research, 41(2), 506-516.
Lipp, E.K., Farrah, S.A., Rose, J.B. (2001). Assessment and impact of microbial fecal pollution and human enteric pathogens in a coastal community. Marine Pollution Bulletin, 42, 286-293.
Mallin, M.A., Williams, K.E., Esham, E.C., Lowe, R.P. (2000). Effect of human
development on bacteriological water quality in coastal watersheds. Ecological Applications, 10(4), 1047-1056.
MCBCL- Marine Corps Base Camp Lejeune (2006). Integrated Natural Resource Management Plan. http://www.lejeune.usmc.mil/emd/INRMP/INRMP.htm.
Niehaus, G.D. (2004). Self contained assay device for rapid detection of biohazardous agents. United States Patent Publication, Patent # 0185551 A1.
NCDWQ, North Carolina Division of Water Quality (2007). White Oak River Basinwide Water Quality Plan. Planning Section.
Noble, R.T., Fuhrman, J.A. (2001). Enteroviruses detected in the coastal waters of Santa Monica Bay, CA: low correlation to bacterial indicators. Hydrobiologia, 460, 175-184.
Noble, R.T., Weisberg, S.B. (2005). Technologies for rapid detection of bacteria in recreational waters. Journal of Water and Health, 3(4), 381-392.
Noble, R.T., Griffith, J.F., Blackwood, A.D., Fuhrman, J.A., Gregory, J.B., Hernandez, X., Liang, X., Berra, A.A., Schiff, K., (2006). Multitiered approach using quantitative PCR to track sources of fecal pollution affecting Santa Monica Bay, California. Applied and Environmental Microbiology, 72(2), 1604-1612.
Reeves, R.L., Grant, S.B., Mrse, R.D., Copil-Oancea, C.M., Sanders, B.F., Boehm, A.B., (2008). Scaling and management of fecal indicator bacteria in runoff from a coastal urban watershed in Southern California. Environmental Science and Technology, 38(9), 2637-2648.
Rolfe, R.D., Hentges, D.J., Barrett, J.T., Campbell, B. J. (1977). Oxygen tolerance of human intestinal anaerobes. The American Journal of Clinical Nutrition, 30, 1762-1769.
Savichtcheva, O., Okayama, N., Okabe, S. (2007). Relationships between Bacteroides 16S rRNA genetic markers and presence of bacterial enteric pathogens and conventional fecal indicators. Water Research, 41, 3615-3628.
Shiyanovskii, S.V., Schneider, T., Smalyukh, I. I., Ishikawa, T., Niehaus, G.D., Doane, K.J., Woolverton, C.J., Lavrentovich, O.D., (2005). Real- time microbe detection based on director distortions around growing immune complexes in lyotropic chromonic liquid crystals,
Physical Review E, 71(2), 020702, 1-4.
Stewart, J.R., Santo Domingo, J.W., Wade, T.J. (2007). “Fecal pollution, public health, and microbial source tracking.” Eds. Domingo J.W., Sadowsky, M.J. Microbial Source
Tracking; Santo ASM Press: Washington, DC, Chapter 1.
Stewart, J.R., Gast R.J., Fujioka, R.S., Solo-Gabriele, H.M., Meschke, J.S., Amaral-Zettler, L.A., del Castillo, E., Polz, M.F., Collier, T.K., Strom, M.S., Sinigalliano, C.D., Moeller, P.D.R., Holland, A.F. (2008). The coastal environment and human health: microbial indicators, pathogens, sentinels and reservoirs. Environmental Health, 7(Suppl 2):S3, 1-14.
Surbeck, C.Q., Jiang, S.C., Ahn, J.H., Grant, S.B. (2006). Flow fingerprinting fecal pollution and suspended solids in stormwater runoff from an urban coastal watershed. Environmental Science and Technology, 40(14), 4435-4441.
Tam-Chang, S., Huang, L. (2008). Chromonic liquid crystals: properties and applications as functional materials. Chemical Communications, 1957-1967.
USEPA, United States Environmental Protection Agency, (1986). Ambient water quality criteria for bacteria-1986. Office of Water; Regulations and Standards. Washington D.C.
Washburn, L., McClure, K.A., Jones, B.H., Bay, S.M. (2003). Spatial scales and evolution of stormwater plumes in Santa Monica Bay. Marine Environmental Research, 56, 103-125.
Woolverton, C.J., Gustely, E., Li, L., Lavrentovich, O.D. (2005). Liquid crystal effects on bacterial viability. Liquid Crystals, 32(4), 417–423.
CHAPTER 2
Loading of fecal indicator bacteria in North Carolina tidal creek headwaters: hydrographic patterns and terrestrial runoff relationships*
*Published in Water Research (44:16): pg 4704-4715 (Stumpf et al. 2010)
Introduction
addition, loading of FIB to headwater portions of tidal creeks will eventually be transported to downstream areas and estuarine receiving waters. Understanding FIB loading
characteristics of these tidal creek headwaters is important for overall understanding of estuarine and coastal water quality dynamics and beneficial use impairments.
Many tidal creeks and estuaries in NC are listed as “impaired” due to elevated fecal coliform levels. In eastern North Carolina, previous research has shown that greater than 93% of E. coli are fecal coliforms (n=3020, Noble and Kirby-Smith, unpublished data), and therefore EC and FC are used interchangeably for this study. In compliance with section 303(d) of the Clean Water Act (USEPA, 1987), total maximum daily loads (TMDLs) of pollutants are established for each water body based on its designated uses. Fecal contamination, measured through the use of fecal indicator bacteria, is the second most common pollutant responsible for failure of designated use (ie. impairment) in assessed waters in the United States (Stewart et al., 2007). Within the 1,436 km2 New River
Watershed in eastern NC, 11.3 km2 of estuarine shellfish waters are “impaired” and 62.8 km2 of freshwater are “stressed” due to fecal contamination, with 163 km2 of freshwater yet to be assessed for TMDLs (NCDWQ, 2007). Waters designated as “impaired” have FC counts in exceedence of standards for specific beneficial uses such as shellfish harvestings, while “stressed” waters support beneficial use, but are potentially at risk of impairment.
closure of certain shellfish areas in NC based on previous research showing fecal
contamination after this threshold rainfall) are used in some areas of NC to protect public health; however, these thresholds were based on few samples, and Coulliette and Noble (2008) noted that the impairment threshold for the Newport River Estuary based on the shellfish fecal coliform standard occurred even before 2.54 cm of rainfall. In addition, differences among rainfall metrics, including rainfall duration and antecedent ra infall result in high levels of variability in the loads of FIB transported to receiving waters during storms.
Studies to specifically examine FIB of headwater tidal creeks and the potential impact on downstream estuarine shellfishing waters in relations hip to storm loading are few. An important departure of this study from other published wet weather FIB monitoring studies was the use of automated sampling throughout the duration of a storm (as opposed to the use of single grab samples to represent an entire storm), which allows for a more accurate estimate of cumulative storm load and the Event Mean Concentration (EMC). Additionally, this work was also conducted in rarely sampled headwater tidal creeks, and in primarily undeveloped watersheds, with particular soil characteristics (primarily fine sands and loam), and highly productive yet impaired shellfishing waters in eastern NC. Previous studies utilizing automated sampling, and examining similar loading characteristics have primarily been conducted in the western United States, in urban creeks, and highly developed/highly impermeable watersheds. Accurate loading characterization of FIB is imperative for
managing and developing appropriate mitigation strategies for shellfishing waters potentially impaired from fecal contamination throughout the United States.
The goal of this study was to examine the loading of E. coli (EC) and Enterococcus
creeks of the NRE in eastern NC. A bi- monthly and multi-sample flow-paced storm sampling strategy was employed to quantify load during both base and storm flow conditions. The load of FIB was analyzed in relationship to rainfall amount, stream flow, storm duration, and antecedent rainfall. A loading analysis was conducted to determine whether the patterns observed followed a typical “first flush” scenario. Relationships between EC, ENT, and total suspended solids (TSS) were investigated in an effort to understand potential pathways (runoff vs. resuspension of sediment reservoir populations) and begin to understand potential sources (human vs. nonhuman) of fecal contamination. Finally, instream sediments were examined to determine if sediment reservoir populations, resuspended during storm events, were a potentially significant source of FIB to the water column.
Materials and Methods Site Description
have highly vegetated land cover, and little impermeable surfaces and/or development, with the exception of Cogdel Creek (Table 2.1).
Field and Laboratory Methods Storm and Baseflow Sampling
Rainfall
Rainfall was collected via automated rainfall samplers within the Freeman and
Cogdel Creeks watersheds. Freeman Creek rainfall data were utilized for Gillets Creek due to close proximity (approximately 2.67 km separation) and Cogdel data were used for French Creek (approximately 3.7 km separation). Total storm rainfall was calculated in the time between elevation of hydrograph above baseflow until rainfall ceased. Storm rainfall duration was determined by addition of consecutive 0.5 h increments when at least 0.025 cm of
rainfall was recorded, until storm completion. Seven-day antecedent rainfall was determined by summation of all rainfall during the 7 days previous to an event.
Hydrograph Sample Selection
For each storm event, ISCO water samples were selected based on location within the different stages of the hydrograph, determined using ISCO Flowlink Software (Version 4.01). The four storm stages analyzed were: 1) pre-storm, 2) rising limb, 3) peak, and 4) falling limb, as determined by visual hydrograph analysis. Specific conditions for each stage are as follows: “pre-storm” was collected before creek flow increased above baseflow and less than 24 h before storm occurrence, “rising” samples were collected between baseline and peak flow, “peak” samples were determined as the nearest single sample to the peak of the storm hydrograph, and “falling” were samples collected after, but within 24 h of peak flow. Similar multi- time point sample collection approaches, incorporating pollutograph
FIB Enumeration and TSS Measurement
Water samples were processed in duplicate using Colilert-18 and Enterolert (IDEXX® Laboratories, Westbrook, ME) at a 1:10 dilution to calculate most probable number (MPN) of EC and ENT. Bottle controls were intermittently analyzed to determine if FIB
accumulated in empty ISCO sample bottles in the period between deployment and sample collection. Results showed no contamination with EC and ENT. ISCO sample tubing was flushed before individual samples were co llected, and assumed uncontaminated, as previous research under similar sampling conditions found little sample line contamination (less than 4 CFU/100 mL for E. coli) using similar samplers (Solo-Gabriele et al., 2000). TSS
concentrations were determined using mass collected on 0.7 µm filters, after a volume of sample was filtered, according to standard method 2540D (APHA, 1998).
Sediments
To test the potential of instream sediment sources of FIB, sediment cores were collected during summer (May, June, July) baseflow conditions when FIB concentrations were typically highest, and processed to acquire FIB concentration/gram. Duplicate cores (n=24) were collected directly above ISCO water sampling locations in each creek following methods of Fries et al. (2008). Sediments were resuspended in phosphate buffered saline, and enumerated using Colilert-18 and Enterolert as previously described for water sample
bacterial enumeration.
All statistics were conducted either using SPSS (version 11.0) or Microsoft EXCEL software. An EXCEL interpolation function was used to estimate FIB concentrations between sample points, similar to load estimation methods used previously (Ensign et al., 2006). Volumetric flow (m3/s) was calculated by multiplying velocity (m/s) by wetted cross-sectional area (m2) of each culvert, which was calculated using the cross sectional geometry and water level (measured using pressure transducers). Total load (cells (MPN)/time) for baseflow and storm flow conditions were estimated by multiplying FIB concentration (MPN/100 mL) by flow volume (m3) per 30 min period.
Relationships among FIB loads, precipitation metrics (total rainfall, storm duration, and antecedent rainfall), streamflow, and TSS were tested using spearman rank correlation coefficient analysis. FIB and TSS concentrations were log transformed due to their non-normal distribution, and log values were used to assess relationships among the indicators and for comparison to streamflow, precipitation metrics, and TSS. EMCs were log
transformed and tested using a t-test to measure significant differences between storm and equivalent baseflow periods. Significance was accepted at α = 0.05.
Results
FIB Total Load and EMC
difference between base loading and total storm loading for both EC and ENT was at Freeman Creek. Calculations of equivalent time (days) of baseflow to achieve loading for one average storm event produced variable results among creeks. Freeman had the greatest temporal disparity, requiring as many as 110 and 134 baseflow days to achieve similar total loading of EC and ENT, respectively, for one average storm (duration = 1.03 days) (Table 2.2). Gillets required the fewest baseflow days, 97 and 48 days for EC and ENT, respectively (Table 2.2).
EMCs during storm and baseflow conditions were examined between creeks and all creeks combined. EMCs are defined as total pollutant mass (M) divided by total flow volume, or M/V, and as used as means to compare and correct for different flow volume between creeks and storms (Kayhanian and Stenstrom, 2005). The median storm EMCs were 7.07 × 10² and 1.96 ×10² MPN/100 mL for storm EC and ENT, respectively, and 1.48 ×10² and 4.84 × 101 MPN/100 mL for baseflow EC and ENT, respectively, for all creeks
combined. Average EMCs for individual creek EC and ENT during storms and equivalent baseflow periods ranged from 8.25 × 100 (MPN/100 mL) to 1.58 × 10³. Storm and baseflow FIB EMCs were statistically different when all creeks were combined (p<.01 for EC and ENT), and for individual creeks (Table 2.3). Freeman EC EMC and Gillets ENT EMC were the only creeks with no significant differences between storm and baseflow (Table 2.3). FIB Patterns
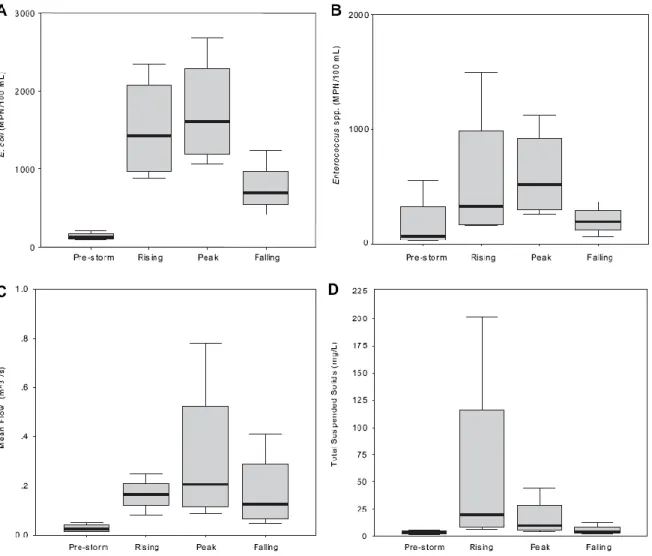
throughout the four stages of the hydrograph (pre, rising, peak, and falling), bacterial concentrations (EC and ENT) increased during rising and peak stages, and declined with falling hydrograph flow rates (Figure 2.2). Pollutographs for each storm and each creek indicate intra-storm variability between EC and ENT concentrations at the different stages of the hydrograph (Figure 2.3), and was common across all storms and all creeks. Pollutant mass to discharge volume (M/V) ratios were developed for each creek during each storm event to determine if a “first flush” phenomenon was observed. A first flush is said to exist when the greatest contaminant concentrations, and therefore loads, occur at the onset of a storm (Lee et al., 2002) and decline after the initial contaminant pulse is flushed from the system (Gupta and Saul, 1996). Bertrand-Krajewski et al. (1998) defined a first flush as 80% of total storm pollutant mass occurring in the first 30% of the storm discharge volume. All creeks combined averaged 37 and 44% flushing of EC and ENT loads, respectfully, within the first 30% of storm volume. Cogdel, Gillets, and French Creeks had similar average M/V loading ratios, while Freeman Creek had the lowest ratio of M/V in the first 30% of
discharge volume (Figure 2.4).
Rainfall Metrics
correlation with EC loading (Table 2.3) and no significant correlations occurred between EC or ENT EMCs and rainfall duration. At individual creeks there was no significant correlation between rainfall duration and total loading and EMC of EC or ENT (Table 2.3). Seven-day antecedent rainfall ranged from 0 cm to 5.9 cm, with an average of 1 cm. Antecedent rainfall was not significantly correlated with FIB load for all creeks combined, or for individual creeks, with the exception of ENT total load at Cogdel (Table 2.3). Antecedent rainfall was not significantly correlated with FIB EMC for all creeks combined, or for individual creeks.
TSS and Instream Sediments
TSS concentrations were examined to determine if there were relationships between FIB concentrations and streamflows. TSS showed a moderate correlation with streamflow in Gillets and Cogdel (Figure 2.1). For all creeks combined, the largest load of mean TSS occurred during the rising limb of storm flow, indicating more of a first flush (in terms of M/V ratio) than FIB (Figure 2.2).However, TSS M/V ratios never reached the previously-defined 80% first flush threshold in any creek (Bertrand-Krajewski et al., 1998).During all conditions and in all creeks combined, TSS showed weak correlation with EC and ENT (Figure 2.8). This was also true for individual creeks, with the exception of French
(correlation of EC to TSS, R2 = 0.28, p<.01 and ENT to TSS, R2=0.27, p<.01). In all creeks, sediment bacterial average concentrations ranged from 19-168 and 28-451 MPN/g, for EC and ENT, respectively (Figure 2.5). Freeman creek had the highest instream sediment concentrations of EC and ENT, while Gillets had the lowest.
The relationship between EC and ENT changed dramatically depending on rainfall conditions. For all creeks, dry weather resulted in weak EC and ENT correlation, while wet weather (rainfall >1.27 cm in 24 h) resulted in a much stronger correlation (Figure 2.6). Wet weather also exhibited a nearly 1:1 ratio of EC to ENT. When streams were examined individually, these relationships were even more strongly correlated. For example, at Cogdel Creek, the EC to ENT correlation was weak during dry weather (R2 = 0.23, p<.05) and strong during wet weather (R2 = 0.80, p<.01).
Discussion
Loading Characterization
Although the watershed area surrounding MCBCL is generally rural with low density residential and light industrial land use, concentrations and loading rates in these four
headwater creeks demonstrate prevalent FIB contamination, and elevated wet weather levels in comparison to baseflows. Freeman and Gillets Creek subwatersheds have little to no development and are primarily used for military training exercises, while French is used primarily as an artillery impact area. Despite the limited potential for human fecal
contamination, total loading of FIB during rainfall events ranged from 109-1012 FIB cells per storm in each creek, and storm EMCs ranged from 4.65 × 101 to 5.31 × 10³ (MPN/100 mL), and 1.53 × 101 to 4.76 × 10³ (MPN/100 mL), for EC and ENT, respectively. These FIB loads are similar to those reported by Line et al. in small rural creeks of eastern NC (2008).
However, total loads and EMCs of FIB in our NC tidal creeks were several orders of
of FIB in developed and more impervious watersheds (Mallin et al., 2000; Schoonover and Lockaby, 2006), but also emphasize the magnitude of these differences between urban vs. primarily undeveloped watersheds.
Overall, these tidal creek headwaters are supplying large FIB contaminant loads to downstream shellfishing areas. With a shellfish water quality standard for fecal coliforms (FC) of 14 MPN/100 mL in NC, dilution into larger volume shellfishing areas is inadequate in buffering delivery of upstream contaminant loads unless significant tidal flushing is present, which is not the case in these creeks. For instance, average EC load in Freeman Creek during storm events was 1.3 × 10¹¹ MPN/storm. Assuming no decay, tidal exchange, or inputs from downstream or in-creek/local sources before or at the shellfishing beds, and using the average volume (C2HM Hill, 2000) of the entire creek to estimate a rough, maximum, completely- mixed concentration of FC in downstream shellfishing areas, FC concentrations would exceed the FC standard by nearly 4.5 times. However, these FC water quality standards are problematic, due to the potential fo r natural sources (i.e. birds, plants, soils and sediments, etc.) to contribute significant concentrations of FC and other FIB to source waters (Whitlock et al., 2002; Steets and Holden, 2003; Anderson et al., 2005). Future changes to shellfish standards (ie. higher FC standards, a reference system approach, alternative indicators, etc.) might improve estimations of true impairment and differentiation between natural sources and anthropogenic fecal contamination.
First Flush and Pollutographs
stormwater inputs, receiving water conditions, and appropriate remediation strategies. For instance, if first flush patterns of FIB delivery to high priority shellfishing waters are observed, with 80% (a mass:volume ratio typically accepted for characterizing stormwater pollutant first flush patterns) of fecal coliforms delivered during the initial 30% of storm runoff volume, then specific types and sizes of best management practices (BMPs) such as retention basins may be more appropriate for stormwater treatment. There has been no previous attempt to determine FIB loading characteristics in headwater tidal creeks of NC. Our data do not support a first flush scenario for either EC or ENT concentrations for combined creek loading data (Figure 2.4). Mass loading to individual creeks averaged as much as 62% in the first 30% of volume but never achieved 80% loading. Individual storms that approached first flush were generally short (<12 h) in duration, and intense (rainfall > 3 cm), but this was not always the case. Examination of patterns of loading of FIB in creeks in central NC and southern California revealed similar findings (Surbeck et al., 2006; Krometis et al., 2007). Interestingly, this is contrary to first flush loading analyses that have been documented for other contaminants such as heavy metals, hydrocarbons, and nutrients (Line et al., 1997; Lee et al., 2002; Stein et al., 2006; Tiefenthaler et al., 2008; Barco et al., 2008), though these findings are often in more developed and/or highly impervious watersheds (Sansalone and Cristina, 2004). We conclude that FIB in the examined tidal creeks
Pollutographs of EC, ENT, and TSS were developed to determine how contaminant concentrations occurred in comparison to creek discharge (streamflow) over time. Results indicate FIB concentration increase and decrease with similar streamflow changes. For instance, one representative storm plotted for each creek indicates increases in EC, ENT, and TSS with the rising limb of the hydrograp h, higher levels at streamflow peaks, and decline with the falling limb (Figure 2.3). Average TSS concentrations showed more of an initial increase with the rising limb (Figure 2.2), possibly due to more of a first flush type of loading, and/or streambed armoring (i.e., easy to erode sediment is scoured during the early part of the storm, the streambed is then “armored” and harder to erode despite similar shear stresses) (Chin et al., 1994). These pollutograph FIB patterns were similar to other studies in several different watersheds (Surbeck et al., 2006; Krometis et al., 2007; Stein et al., 2007). Again, these similar results across different watersheds and geographic areas support the need for entire storm mitigation strategies for reductions of FIB inputs to receiving waters. In addition, variability between sample points emphasizes the need for intensive multi-point sampling throughout storms, to acquire accurate FIB contamination estimates. Current single- grab sample methods for sampling are an insuffic ient means to accurately characterize FIB during storm events due to this intra-storm variability.
Base versus Storm Loading
Load of FIB and EMCs varied among the four sampled creeks; however, total load of FIB and EMCs for all creeks combined during storm events always exceeded baseflow load during equivalent antecedent baseflow periods. Gillets Creek exhibited the smallest
high baseflow concentrations. It is unclear what is causing these high baseflow levels of FIB. Overall, mean storm loads were equivalent to approximately 1.5 - 4.5 months of baseflow loads. A similar comparison was made in central NC where baseflow to storm load
equivalencies were greater than 1 year (Krometis et al., 2007). However, these streams had much greater discharge (average flow 0.5 m3/s vs. less than 0.12 m3/s in this study) and occurred in watersheds characterized by higher levels of impervious surface coverage and residential use. Despite a smaller baseflow loading component, baseflows contribute substantial fractions of annual FIB loads and contribute to closures of downstream shellfishing areas, especially in creeks such as Gillets, with high ambient (i.e. non-storm related) FIB concentrations. This would be especially true during years with few rainfall events leading to a greater portion of loading during dry periods. However, in these tidal creeks, and in geographic regions with large scale rainfall events (such as tropical storms and nor’easters), storms can contribute concentrations of FIB many orders of magnitude larger than equivalent baseflow periods.
Rainfall Metric Relationships
Cogdel (Table 2.3). These results demonstrate that rainfall could be a useful predictor, but also highlight the wide range of variability in FIB in relation to rainfall (storm, ambient, and antecedent) rainfall scenarios.
The lack of correlation between FIB loading and rainfall metrics could be due to subwatershed land use and soil conditions. Three of the four subwatersheds under
examination are undeveloped and forested, and have soils classified as moderate to rapidly permeable, comprised mostly of sands (CH2M Hill, 1998; CH2M Hill, 2000; USDA, 2010). Terrestrial stormwater runoff generally occurs after soil saturation and reduced infiltration of rainfall on the land surface (Tyrell and Quinton, 2003). Forested and densely vegetated landscapes in combination with high soil permeability might increase the storm magnitude (intensity, duration) necessary to cause significant differences in FIB loading. For instance, Cogdel Creek, the only developed subwatershed (~31% impervious surface), had the only significant correlation between total ENT loading and antecedent rainfall. One explanation for these results is that land use and soil type are moderating storm duration and antecedent rainfall effects on FIB loading, and tidal creeks in more developed areas with substantial impervious surfaces and/or in areas with low permeable soils may be more prone to FIB contamination from runoff.
FIB Runoff Relationships Terrestrial Runoff
in all creeks, with the exception of ENT in Gillets (Figure 2.1). Others have pointed out that the correlation between streamflow and FIB is often related to rainfall and runoff transport of terrestrial fecal pollutants (Nagels et al., 2002). However, TSS was moderately related to streamflow and weakly related to FIB. Similar results were found in a study conducted in nearby watershed examining fecal coliforms (Line et al., 2008). This is surprising, considering instream sediment resuspension typically increases greatly via erosion with increased flow velocity and associated shear stress (Steets and Holden, 2003). However, this does not seem to be the case in these watersheds, possibly due to their heavily vegetated and minimal gradient landscapes, which likely increases rainfall retention and infiltration, and limits soil scouring from runoff during storm events.
Instream Sediments
rampant resuspension, we conclude that FIB concentrations are primarily due to terrestrial source runoff.
E. coli to Enterococcus spp. Ratios
EC and ENT concentrations were strongly coupled during storm events but not during baseflow. Strong coupling of EC and ENT concentrations are observed in fresh fecal
Conclusions
Understanding the percent load FIB per flow period during a storm is important in assisting water quality managers to develop BMPs and plan for shellfish harvesting closures (presumptive closures). The results of this study, when compared to more developed and impervious watersheds, support previous findings of changing concentrations of FIB based on watershed land use, but these results also emphasize the magnitude of these differences between urban vs. primarily undeveloped watersheds. This is especially true in geographic regions with large scale rainfall events (such as tropical storms and nor’easters), where storms can contribute concentrations of FIB much larger than equivalent baseflow periods. Due to intra-storm variability between points throughout the storm, a multi-sampling approach through entire storm duration is necessary for more accurate estimation of fecal contamination. Current single-grab sample methods (ie. one sample per storm) are
insufficient to accurately characterize FIB due to this intra-storm variability. Since neither ENT nor EC followed first flush loading patterns, and are primarily contributed to the estuarine system during storm events, mitigation strategies for FIB reduction will need to consider full storm duration. In addition, watershed characteristics (land cover and soil types) could be responsible for modification of loading patterns of FIB and TSS. Finally, FC
shellfish standards may need to be reassessed due to elevated concentrations from natural sources, which is likely the case in these undeveloped watersheds.
Acknowledge ments
1 T. Minter Unpublished Data 2 USDA, WebSoil Survey, 2010
Table 2.1. Watershed size, predominant soil and land use types for each tidal creek
Watershe d
1
Watershe d Size (m2)
2
Predomi nant Sedi ment Types
1
Predomi nant Land Use Types
Land Use Percentage Cog del 7620939 Ba B Bay meade fine sand
Predominantly Pine
Forest 33.5
BmB Bay meade-Urban
Business or Co mme rc ial
Area 31.3
MaC Marvyn loa my fine sand
Mixed Pine and
Hardwood Forest 10.3
Mk Mucka lee loa m
Bottomland Hard wood
Forest 9.3
On Onslow loa my fine sand
Forest Plantations Under
10 Yea rs 6.1
To Torhunta fine sandy
loa m Other 9.7
Frenc h 5872377 Ln Leon fine sand Bare Ground 54.3
KuB Kureb fine sand Shrub or Scrub 23.7
Mu Murville fine sand
Predominantly Pine
Forest 19.5
Ba B Bay meade fine sand Other 2.4
Free man 6251037 Ba B Bay meade fine sand
Mixed Pine and
Hardwood Forest 42.5
Mk Mucka lee loa m
Predominantly Pine
Forest 46.4
KuB Kureb fine sand Shrub or Scrub 6.7
AnB Alpin fine sand Bare Ground 3.7
Mu Murville fine sand Other 0.7
Gillets 4199947 WaB Wando fine sand
Predominantly Pine
Forest 39.2
Mk Mucka lee loa m
Mixed Pine and
Hardwood Forest 32.4
Ln Leon fine sand
Bottomland Hard wood
Forest 11.4
To Torhunta fine sandy loa m
Forest Plantations Under
10 Yea rs 10.5
Creek
Loadi ng Di fference Be twee n Stor m and Baseflow
Equi vale nt Baseflow Days to Equal Average Stor m Load
EC ENT EC ENT
Cog del 22 22 121 121
Frenc h 25 20 92 73
Gillets 29 14 97 48
Free man 30 37 110 134
Creeks Loadi ng Total Rainfall Rainfall Dur ation Antece dent
Rainfall Aver age Stor m Eve nt Mean Concentr ati ons
Aver age Baseflow Event Mean Concentr ati ons All Creeks
Combine d Total
Discharge .294 .313 -0.047
Cog del E . c o li T o ta l L o a d in g
0.62 -.134 0.294
E
.
c
o
li
7.51 × 102 * 3.58 × 102 *
Frenc h .810* -.393 -0.464 1.58 × 10³ ** 1.44 × 10² **
Gillets 0.261 -.067 -0.506 1.17 × 10³ ** 1.92 × 10² ** Free man 0.143 .687 -0.317 5.93 × 10² 5.72 × 101
All Creeks
Combine d .534** .193 -0.145 1.11 × 10³ ** 2.03 × 10² **
Cog del E n te ro c o c cu s s p p . T o ta l L o a d in g
.778** .109 .657*
E n te ro c o c cu s sp p .
9.08 × 102 * 1.24 × 102 *
Frenc h -0.286 .071 0.146 5.02 × 10² ** 7.11 × 101 **
Gillets 0.127 .128 -0.15 1.18 × 10² 8.35 × 101
Free man 0.429 .687 -0.049 9.8 × 101 ** 8.25 × 100 **
All Creeks
Combine d .537** .393* 0.118
3.87 × 10² **
7.91 × 101 **
Table 2.3. Spearman rank correlations (R2) for all creeks combined and individual tidal creeks for loads versus rainfall metrics and t-test results for average event mean concentrations for EC and ENT during both storm and equivalent baseflow periods. ** Significant at p<0.01 * Significant at p<0.5
Figure 2.1. Streamflow (m3/s) versus log fecal indicator bacteria concentration (Most Probable Number (MPN)/100 mL) and Total Suspended Solids (TSS) for creeks (A) Cogdel (B) French (C) Gillets (D) Freeman, during all flow conditions. ** Significant at p<0.01
Figure 2.2. Box plots for all creeks across all storms of mean (A) E. coli (B) Enterococcus spp. (C) flow (D) and total suspended solids
Figure 2.3. Pollutograph representation of intra-storm variation in log concentrations of E. coli (EC) and Enterococcus spp. (ENT) (MPN/100 mL), and total suspended solids (TSS) (mg/L) during one representative storm in the four headwater tidal
Figure 2.4. Average mass to volume (M/V) plots, used to determine fecal indicator bacteria load per volume of creek discharge, for (A) E. coli and (B) Enterococcus spp. for each tidal creek
0 100 200 300 400 500 600 700 800
Cogdel French Gillets Freeman
Creek Sediments In s tr e a m S e d im e n t FI B ( M P N /g ) E. coli Enterococcus spp.
y = 0.42x + 0.85
R2 = 0.12**
y = 0.82x - 0.05
R2 = 0.56**
0.5 1 1.5 2 2.5 3 3.5 4 4.5
0.5 1 1.5 2 2.5 3 3.5 4
Log E. coli (MPN/100mL)
Log E n te ro c o c c u s s p p . (M P N /1 0 0 m L ) Stormflow Baseflow
Figure 2.6. Relationship between log concentrations (MPN/100 mL) of E. coli and
R2 = 0.18** -1 0 1 2 3 4
0 1 2 3 4 5
Log E. coli (MPN/100mL)
L o g TS S ( m g /L )
R2 = 0.16**
-1 -0.5 0 0.5 1 1.5 2 2.5 3 3.5
0 1 2 3 4 5
Log Enterococcus spp. (MPN/100mL)
L o g TS S ( m g /L ) A. B.
Figure 2.8. (A) E. coli and total suspended solids (log mg/L) during all conditions (B) and
REFERENCES
Anderson, K.L., Whitlock, J.E., Harwood, V.J. (2005). Persistence and differential survival of fecal indicator bacteria in subtropical waters and sediment. Applied and Environmental Microbiology, 71(6), 3041-3048.
APHA- American Public Health Association (1998). Standard method for the examination of water and wastewater. 20th Edition. Washington, D.C.
Barco, J., Papiri, S., Stentstrom, M.K. (2008). First flush in a combined sewer system. Chemosphere, 71, 827-833.
Bertrand-Krajewski, J., Chebbo, G., Saget, A. (1998). Distribution of pollutant mass vs. volume in stormwater discharges and the first flush phenomenon. Water Research, 32(8), 2341-2356.
CH2M Hill (2008). Long term watershed management plan for Cogdel’s Creek; C2HM Hill, Inc., Prepared for US Army Corps of Engineers. Contract No. DACA01-96-D-0028.
CH2M Hill (2000). Freeman Creek evaluation and assessment; C2HM Hill, Inc., Prepared for US Army Corps of Engineers, Contract No. DACA01-96-0028.
Chin, C.O., Melville, B.W., Raudkivi, A.J. (1994). Streambed Armoring. Journal of Hydraulic Engineering, 120(8), 899-918.
Coulliette, A.D., Noble, R.T. (2008). Impacts of rainfall on the water quality of the Newport River Estuary (Eastern North Carolina, USA). Journal of Water and Health, 6(4), 473-482.
Crane, S.R., Moore, J.A. (1986). Modeling enteric bacterial die-off: a review. Water, Air, and Soil Pollution, 27, 411-439.
Ensign, S.H., McMillan, S.K., Thompson, S.P., Piehler, M.F. (2006). Nitrogen and phosphorus attenuation within the stream network of a coastal, agricultural watershed. Journal of Environmental Quality, 35(4), 1237-1247.
Fries, S.J., Characklis, G.W., Noble, R.T. (2006). Attachment of fecal indicator bacterial to particles in the Neuse River Estuary, N.C. Journal of Environmental Engineering, 132(10), 1338-1345.
Fries, S.J., Characklis, G.W., Noble, R.T. (2008). Sediment–water exchange of Vibrio sp. and fecal indicator bacteria: Implications for persistence and transport in the Neuse River Estuary, North Carolina, USA. Water Research, 42(4-5), 941-950.
Geldreich, E.E., Best, L.C., Kenner, B.A., Van Donsel, D.J. (1968). The bacteriological aspects of stormwater pollution. Journal of Water Pollution Control Federation, 40(11), 1861-1872.
Gupta, K., Saul, A.J. (1996). Specific relationships for the first flush load in combined sewer flows. Water Research, 20(5), 1244-1252.
Hai, L., Handao, C. (1982). Significance of fecal coliform and fecal streptococcus in water pollution monitoring. Acta Academiae Medicinae Wuhan, 2(4), 251-253.
Hyer, K.E., Moyer, D.L. (2004). Enhancing fecal coliform total maximum daily load models though bacterial source tracking. Journal of American Water Resources Association, 40(6), 1511-1526.
Kayhanian, M., Stenstrom, M.K. (2005). Mass loading of first flush pollutants with treatment strategy simulations. Transportation Research Record: Journal of the Transportation
Research Board, 1904, 133-143.
Kibbey, H.J., Hagedorn, C., McCoy, E.L. (1978). Use of fecal streptococci as indicators of pollution in soil. Applied and Environmental Microbiology, 35(4), 711-717.
Lee, J.H., Bang, K.W., Ketchum, L.H., Choe, J.S., Yu, M.J. (2002). First flush analysis of urban storm runoff. Science of the Total Environment, 293(1-3), 163-175.
Line, D.E., Wu, J., Arnold, J.A., Jennings, G.D., Rubin, A.R., (1997). Water quality of first flush runoff from 20 industrial sites. Water Environment Research, 69(3), 305-310.
Line, D.E., White, N.M., Kirby-Smith, W.W., Potts, J.D. (2008). Fecal coliform export from four coastal North Carolina Areas. Journal of American Water Resources Association, 44(3), 606-617.
Lipp, E.K., Kurz, R., Vincent, R., Rodriguez-Palacios, C., Farrach, S.R., Rose, J.B. (2001). The effects of seasonal variability and weather on microbial fecal pollution and enteric pathogens in a subtropical estuary. Estuaries, 42(4), 286-293.
Mallin, M.A., Williams, K.E., Esham, E.C., Lowe, R.P. (2000). Effect of human development on bacteriological water quality in coastal watersheds. Ecological Applications, 10(4), 1047-1056.
Mallin, M.A., Ensign, S.H., McIver, M.R. Shank, G.C., Fowler, P.K. (2001). Demographic, landscape, and meteorological factors controlling the microbial pollution of coastal waters. Hydrobiologia, 460(1-3), 185-193.
Mallin, M.A., Lewitus, A.J. (2004). The importance of tidal creek ecosystems. Journal of Experimental Marine Biology and Ecology, 298(2), 145-149.
Mallin, M.A., McIver, M.R., Wells, H.A., Parsons, D.C., Johnson, V.L. (2005). Reversal of eutrophication following sewage treatment upgrades in the New River Estuary, NC.
Estuaries, 28(5), 750-760.
Nagels, J.W., Davies-Colley, R.J., Donnison, A.M., Muirhead, R.W. (2002). Faecal contamination over flood events in a pastoral agricultural stream in New Zealand. Water Science and Technology, 45(12), 45-52.
Noble, R.T., Fries, J.S. (2005). Estuarine sediment beds as a reservoir for human pathogens: monitoring transport of populations of Enterococci and Vibrio sp. in the Neuse River