The Role of Unverifiable Information in Online Peer-to-Peer Lending
By: Benjamin Director Honors Thesis Economics Department
March 2015
Approved
___________________________
1. Acknowledgements
2. Abstract
Over the past decade, online peer-to-peer lending has emerged as a viable alternative to traditional consumer finance by connecting individuals with small financing needs with
individual investors seeking the consistent returns of lending traditionally reserved for financial institutions. To date, the literature on leading loan providers like Lending Club and Prosper Marketplace is relatively sparse and has failed to keep up with the constantly changing industry funding standards. This study contributes to this body of literature by examining information that is unverified by the Lending Club such as stated loan purpose and homeownership. While
previous studies have examined a now obsolete interest rate auction process and used machine learning techniques to analyze complex loan descriptions, this study differentiates itself by examining the current Lending Club industry standard and incorporating a larger subset of data. Our results indicate that these unverified factors are significantly correlated with loan
performance but also that Lending Club’s interest rate assignment process acts as a partial control for these deviations. While statistically significant disparities do emerge even after Lending Club’s interest rate assignment process, these marginal differences become
3. Introduction
Despite all the great waves of innovation of the twentieth and twenty-first centuries, basic consumer finance is still primarily carried out through traditional banks. While this has long been the case, a series of innovative financial technology companies led by Lending Club and Prosper Marketplace are beginning to reshape consumer credit markets through the advent of online peer-to-peer (P2P) lending. Online peer-to-peer lending works by assigning small scale borrowers (generally those asking for less than $35,000) an interest rate and helping them get their loan funded by connecting them with lenders who each contribute a small fraction of the principal and receive residual income through interest payments. The intermediaries generate profit through small servicing costs. Since its founding in 2006 through the end of 2015, Lending Club issued over $15.9 billion in loans, distancing itself from its biggest competitor Prosper’s $6 billion and emergingas the U.S. market leader in online P2P lending1.
This study examines the role of unverified and soft information in the payment patterns of online peer-to-peer borrowers utilizing data from the Lending Club. Unverified information refers to the components of loan applications which are not always verified in the Lending Club’s loan review process. Soft information is non-quantifiable information that can still be materially important. Burke et. al (2012) describes an illustrative example of unverified information in noting how borrowers for homes often provide past rent and utility repayment history to banks but the banks do not actually always verify this information. In a similar bent,
1 Lending Club loan issuance as of December 31, 2015. Updated numbers can be found at
Lending Club does not necessarily verify all information provided by a borrower in the review of every loan application. As an example of soft information in the context of business lending, Petersen (2004) cites how in evaluating potential businesses to which to lend, bank
representatives perceive soft information such as “the ability of the manager, their honesty, the way they react under pressure.” Surely these are unquantifiable characteristics, but they certainly have material impact on the creditworthiness of the firm.
This analysis centers on the information that borrowers provide to potential lenders in their profile but which are not always verified in the Lending Club’s loan review process or are non-quantifiable. While profile verification can happen, it does not occur for every loan and investors often must choose loans before a final profile verification and hence must evaluate these borrower-supplied factors with a degree of uncertainty. These verification factors, home ownership, employment length, gross income, debt-to-income ratio and location, all have real effects on a borrower’s likelihood of making interest payments on time and fully repaying their loan. Although each of these factors influence a borrower’s repayment likelihood, without verification investors must consider these data-points with some hesitation. For instance, for loans issued in 2014, 29 percent of monthly incomes were verified and 41 percent had the source of income verified. 2 Intriguingly, Lending Club internal analysis has shown that from 2010 to
2014 non-verified loans were charged-off less often than income verified and income-source verified loans.3
2 Lending Club categorizes a loan’s income verification status as either “income verified,” “income source verified”
or “not verified.” “Income verified” indicates Lending Club has confirmed the borrower’s stated income is within 10% of their stated income amount and “income source verified” indicates Lending Club has confirmed the source of a borrower’s income.
3 Lending Club analysis utilized data in their Loan Stats dataset that is same source of data as this thesis (“Income
My research differentiates itself from the prior literature by focusing on Lending Club and the current industry standard of online P2P lending, by incorporating a continuous variable for loan repayment that strictly differentiates between delinquent and non-delinquent loans, and by having more data from a longer period of time. With loans lasting for 36 or 60 months, much more data is now available for the complete loan cycle activity since Lending Club was only founded in 2006.
My research serves two central purposes. Firstly, it provides insight into whether
investors should consider qualitative and unverified factors in their assessment of Lending Club loans. Our research finds that even when controlling for loan grade, loans of different purpose do not perform equally. To investors only able to afford a few loans of any given grade, this is material information as it suggests investors should systemically choose and avoid certain loan purposes. These discrepancies lead to a discussion of the degree to which Lending Club has created an efficient market for consumer loans. To address this question, we consider the predictive power of our model relative to that of just using Lending Club assigned interest rates.
Research inthis topic provides further insight into the customers of one of the fastest growing companies in the U.S. and broadens the understanding of online consumer credit
contributes to the understanding of the functioning of these markets by examining how unverified and qualitative factors drive certain borrowers to delinquency.
This begins with an analysis of the prior literature in online peer-to-peer lending as well as a discussion of information acquisition and signaling in credit markets. Following the review is the theoretical model outlining the agents in online peer-to-peer markets and how both verified and unverified information affects their decision process. Next is a discussion of the econometric model and accompanying data used to analyze the impact of these different types of information. Finally, the paper concludes with a discussion of these results.
4. Literature Review
There is a growing body of literature about online P2P lending as well as a vast research on the workings of consumer finance, lending, and financial intermediaries. Broadly, the relevant research are text studies in online finance, various examinations of the role of signaling and information acquisition in finance, and cheap talk in lending. Much of the pre-existing literature on online P2P borrower behavior utilizes data from Prosper.com involving a now obsolete interest rate setting process. In this process, borrowers were allowed to request an interest rate and then be funded at an interest rate determined through an auction process. Prosper no longer utilizes this system and Lending Club has never used this system, so it is valuable to examine how financing works when interest rates are set by the intermediary only.
Multiple papers have studied how textual information and the formation of narratives can not only influence lenders but have real correlation with loan performance. Firstly, Gao and Lin (2015) analyzed text descriptions in Prosper and Lending Club using a machine learning
correlated with loan repayment prospects. Herzenstein et al (2011) likewise analyzed over 1,000 loan descriptions from Prosper.com and found that different identity features crafted in a loan description can make suggestions about loan performance. These papers certainly suggest lenders could benefit from loan descriptions, but this is a now obsolete element.4 As such, it is
valuable to assess loans with the information with which investors are actually being provided today. By focusing on a set list of loan purposes, our analysis provides investors a tool to correctly interpret qualitative information.
Significant research suggests that lenders do in fact try to glean additional information out of lenders beyond that which is verified. This research was primarily done using Prosper data, so shifting sources to Lending Club provides new insight and expands the research
literature to a larger dataset. Michels (2012) determined that for Prosper, unverifiable disclosures could help lower interest rates by 1.27% and increase bid activity by 8%. The findings of
Michels suggest a potential benefit to investors who can accurately assess Lending Club’s unverified information. Kawai et al. (2014) examined Prosper’s interest rate auction process in which a borrower sent a maximum interest rate to lenders. Kawai et al. suggest and give substantial evidence to say that a low maximum rate can signal good credit to potential lenders by telling them they have other potential sources of credit and are likely in good financial standing. Iyer et al. (2014) determined that non-expert lenders who utilized Prosper’s interest rate auction setting did in fact make an effort to infer additional information about loans and were able to accurately infer about one-third of this additional information.
4 On March 19, 2014 the Lending Club formally discontinued the use of descriptions citing how loan description
As such, we set out to reframe this type of analysis but by updating it to the current specifications for loan selection utilized by the largest intermediary, Lending Club. Loan purpose is the closest element in today’s online P2P market to a loan description, so examining
correlations between loan purpose and performance is the current equivalent of this type of analysis. In examining these purposes, we gain insight into the potential that investors should give preference for certain borrower types in much the same was as someone would previously choose amongst loans through their descriptions.
I base much of my econometric analysis on the work of Mach et al. (2014). Mach et al. utilizes a logistic regression to assess the performance of small business loans on Lending Club. We expand this loan purpose analysis to a wider set of loan purposes as well as include a
continuous variable to determine how much principle was repaid, giving investors more insight into the nature of these delinquencies. Additionally, our research extends Mach’s work to a much larger dataset since Lending Club total loan issuance ballooned from less than 100,000 loans to nearly 1.3 million from 2012 to 2015.5 Hence, I distinguish my research through further defining
loan performance and extending to more unverified factors. Even with respect to the in-depth analysis of small business loans in Mach et al, our analysis supports the relevance of this research because it shows the underperformance of small business loans has been maintained even since Lending Club began offering small business loans in 2014 and business lines of credit in 20156.
5 At the end of 2012, Lending Club had issued 95,902 loans worth $1,178,238,775. At the end of 2015, those
numbers had grown to 1,276,150 loans worth $15,982,054,451.
6 While anyone applying for a traditional Lending Club loan can state “Small Business” as their loan purpose, today
5. Theoretical Model
The theoretical model encompasses three agents, each trying to maximize his respective utility through his engagement with a series of decisions. These agents, of course, are 1)
borrowers seeking to ensure they meet their immediate cash needs and receive a loan while minimizing their interest expense, 2) the intermediary seeking to maximize profit through underwriting loans and collecting fees, and 3) lenders seeking to maximize their investment return while minimizing risk.
5.1. Assumptions
The model herein is predicated on a few major assumptions about payment capabilities, borrowers, the intermediary, and lenders. Firstly, it is assumed that a single late payment in a given period results in immediate default for all subsequent periods. This naturally is not the case, as borrowers in actuality can miss or make late payments and continue to pay in future periods. Additionally, the model ignores the possibility of early payments and instead assumes a borrower can only make the minimum payment each month in full. While these assumptions may not describe real online or traditional lending markets, the absence of such payments patterns will not inhibit the implications of the model as it still describes each agent’s approach to his problem. Moreover, our empirical analysis adopts this binary framework in evaluating delinquency probabilities and in only considering the total amount of principle repaid, so little is lost in this generalized framework.
As for the agents, all are assumed to be rational and abide by some homogenous
verified information, a realistic setting since much of the verified information is provided by a credit agency rather than the Lending Club. All borrowers are assumed to be rational, meaning they seek out a loan only if they have determined the immediate cash infusion is worth either making 36 or 60 future payments or risking defaulting and hurting their credit profile.
5.2. The Borrower’s Problem
The decision of a borrower can be looked at as a three step decision process. Firstly, he determines whether he needs an immediate cash infusion in the form of a loan. Secondly, he determines if he should accept a loan through the Lending Club. Finally, each month a borrower assesses whether the utility-maximizing decision is to make the next repayment, suffer a
delinquent payment, or even default on their loan.
With our study’s focus on the role of verified or unverified information, we break
borrowers into two types, those who have a high probability of repayment, and those who have a low probability of repayment. A borrower’s type is determined by all verified and unverified factors and gives the true underlying probability that a borrower makes all his payments on time. Hence, we construct the set below to represent the underlying true distribution of all borrowers, where Φ is the borrower’s type.
Φ = ,
Φ (denoted Φ ) that will help him choose one loan of a given rate versus another. One should also note that high probability borrowers can still default or make late payments and that a low probability borrower can still make all payments, but that this will only occur given some shock
ε during the months after the loan is funded that is unforeseen or unexpected. After he has taken out a loan, a borrower is faced with a decision between the cost of repayment and the cost of default in each period t:
= (Φ) ℎ
The equation above for the cost of repayment normalizes a borrower’s cost to zero and adds to represent any period-specific shock that makes completing a loan repayment
exceptionally manageable or difficult. The expected value of the shock is equal to 0 and it is assumed to be independent of borrower type Φ. Example shocks for non-zero ε could be a lost job (ε > 0) or winning a local lottery (ε < 0) that makes the difficulty of loan repayment harder or easier than expected. The equation (Φ)is the cost of default for a borrower subject to his type Φ and the period t wherein default occurs. This is a function of borrower type, as we assume good borrowers determine it is suboptimal to default more than their low probability peers. It is also a function of time as defaulting sooner with a larger balance has a larger effect then
defaulting later. This illustrates that a borrower’s only major reason not to default when using an online P2P lender like Lending Club that does not take collateral is the impact to one’s credit score.
pay to a certain point and default, or to not take out a loan at all. We let denote the discount factor, where (0,1).
=
( ) − ( )
( ) − ∗ ) − (Φ ∗) ∗
0 ℎ
5.3 The Lending Club’s Problem
As the intermediary, the Lending Club can be viewed as an expert middleman (Biglaiser 1993). The intermediary’s goal is to maximize profit through extracting the most in fee revenue and minimizing costs. Since the Lending Club’s pricing structure is set right now, the main goal is to facilitate the largest amount of loan issuance while minimizing costs. In order to do this successfully, it should be in their objective to encourage the most people to use their lending service. We assume the Lending Club adds no value to an individual loan for either a borrower or an investor. Instead, it provides the borrower value by connecting him to a wide array of investors. For investors, it provides access to a number of borrowers and also facilitates information through assigning borrowers interest rates and grades that inform them of a borrower’s position.
arrives, regional demand limitations will vanish. Each virtual bank will gain in advantage as its network increases.” In such a situation, network effects arise in which more borrowers and lenders opt for one intermediary and thus increase the volume of loans on that platform and thereby encourage future borrowers and lenders to choose that intermediary (Arthur 1996).
Recognizing this opportunity for increasing returns to scale, Lending Club has a huge incentive to create the rate setting process that the most borrowers and lenders trust. Burke et al (2012) use a model for mortgage markets to examine the marginal cost of adding more
incremental information to a potential loan profile and whether that additional benefit is actually optimal. Burke et al argues there exists an optimal amount of information a traditional mortgage broker should acquire that keeps the broker’s reputation strong while minimizing his costs. In this situation of increasing returns to scale, the price for a strong reputation would likely be higher than that of a mortgage market as network effects make it crucial the intermediary becomes the online lending platform of choice. Thus, for the intermediary, considering
unverifiable information is important because it increases its reputation and suggests to potential borrowers and lenders they have the best, most reliable service.
5.4. The Lender’s Problem
= ∗
= Return on loan; =Number ofPayments Made; p = Repayment Value which can be normalized to 1.
For our model, how a lender will actually achieve his highest return is by being best able to predict the borrower’s type Φ by assessing a combination of verified and unverified
information most effectively and picking the loan with a predicted borrower type Φ′ that is closest to 1. Lenders are unable to determine a borrower’s “type,” but they are provided with the composition of the borrower’s verified and self-reported information. Thus, lenders seek to estimate the borrower’s type as a linear combination of verified and unverified information:
Φ = +
Φ = estimated borrower type
= sensitivity to verified (i = V)or unverified (i = U)information, θ ∈ (0,1)
= Borrower s verified information either V , V with subscript high or low
= Borrower s unverified information, either U , U with subscript high or low
The term is the product of the lender’s sensitivity to verified information multiplied by the verified information supplied to the lender via the intermediary. Likewise, the product
could see and verified good information is the best thing he could see in determining if a borrower is of type H or L.
We can assume Φ ∈ (0,1), where the higher the number is the more confident a lender is that the borrower is type . Thus, a value of one would indicate a lender’s complete confidence a borrower is type and zero would indicate complete confidence a borrower is type , and any number in between is the borrower’s assumption of the borrower’s type.
Finally, now that we have determined an estimate of a borrower’s type, we illustrate how a P2P lender can use this information to maximize expected return subject to discount rate by choosing the loan with the highest maximum expected return which is determined by the lender’s prediction of Φ and the repayment value which was normalized to 1 above:
E[R] = [ ∙ ] = [ ] ∙ = [ |Φ] ∙ = [ | [Φ]] ∙
= [ | Φ ] ∙ = [ | + ] ∙
5.5. Synthesis of Theoretical Model Discussion
The theoretical framework above outlines the basic decisions with which the different participants in this market are faced. Using the empirical analysis outlined below, we show how understanding of unverified information could influence each of these parties and seek to append or modify these models to illustrate how each agent can maximize his own objective. It is
and potentially look at this through the lens of cheap talk since they are effectively sending unconfirmed information to investors. The Lending Club could utilize this information to more accurately determine what credit group to assign a borrower to, or they could perhaps further specify a borrowers’ delinquency risk and thereby create more narrow debt tranches. As
discussed, this presents an opportunity for the Lending Club to emerge as the dominant platform and benefit from network effects that will yield increasing returns to scale. Finally, investors can gain insight on whether different borrowers default differently and if there is a way to make a more specific investor model that better describes their decision process and also sheds light on how best to consider unverified information in the allocation of investment capital.
This framework provides rationale for why investors may not use unverified information in their analysis even if statistically significant deviations are found between loans with different unverified characteristics. Two potential explanations are costs associated with information verification or undersupply of loans of certain types. This could be explained in this theoretical model if one considers that lenders have costs attached with increasing Θ (sensitivity to unverified information) to a level high enough to use unverified information effectively.
Additionally, the other implication could be explained as undersupply if one assumes that lenders are in fact fully informed of the impact of unverified information in deducing a borrower’s type but because of a dearth of supply in loans with certain characteristics they fund suboptimal loans. Having outlined the potential importance of unverified information to each market participant, we now explain the empirical model utilized to analyze the extent to which unverified
6. Empirical Model
To gain insight on Lending Club’s assessment of loans, we estimate a linear regression of the interest rate paid on the loans with robust standard errors:
= + + + + +
Rate is the Lending Club assigned interest rate for loan i to borrower x in year t. Purpose is the borrower’s stated purpose of the loan. Borrower is a vector for the characteristics of the borrower. Loan is a vector for the characteristics of the loan. Year is an indicator variable for the year the loan was issued. Borrower consists of characteristics about the borrower such as his FICO score, housing and employment status, and characteristics of the county he resides in.
Loan contains characteristics specific to the loan itself such as its term and amount. The variable is a state effect which we use in both the random and fixed effects estimation and is an error term. These vectors represent the different decisions a lender is faced with evaluating from the theoretical model. Borrower variables are unique to the individual borrower, loan variables give insight on how different loans fare across loan types and year and state fixed effects control for other differentiating factors.
After establishing a model of Lending Club’s interest rate assignment, we estimate loan performance through a measure of delinquency then a continuous model based on the amount of principle repaid. Firstly, we consider logit estimates of whether the loan becomes delinquent or not7:
7 We supplement our findings with probit estimates but take our logit estimates to be the most accurate and use these
Pr ( = 1) = ( + + + + +
)
where ( ) = ( )
A loan is classified as delinquent if it is either in default, charged off, or late beyond 30 days. The above probability model contains the vectors from the interest rate calculation as well as a new dummy variable Verify for income verification and a continuous variable for the fraction of the loan funded by investors as compared to the Lending Club.
To control for potentially skewed results, we repeat these regressions with restrictions on the loan grade as well as the date of the loan’s issuance. Repeating the regressions only for individual grades of a loan ensure that loan purposes that are typically issued to lower quality borrowers do not appear to have outsized bad performance8. Additionally, we repeat the
regression restricted to 36 month loans issued on or before December 31, 2012 and 60 month loans issued on or before December 31, 2010. This allows us to focus our analysis on only those loans which have gone through their whole payment life cycle.
After establishing this binary measure, we turn to a continuous measure of loan performance by taking a linear estimate the fraction of principle repaid:
= + + + + +
+ + +
We utilize simple OLS as well as state level random and fixed effects estimates with robust standard errors with the same vectors from the delinquency estimate. Princ is computed as
the total amount of principle received by investors divided by the amount of the loan. To ensure current loans do not skew results, we only estimate this continuous measure for 36 month loans issued on or before December 31, 2012 and 60 month loans issued on or before December 31, 2010. Again, we repeat our analysis by individual loan grade to ensure there are no biases already found by the Lending Club.
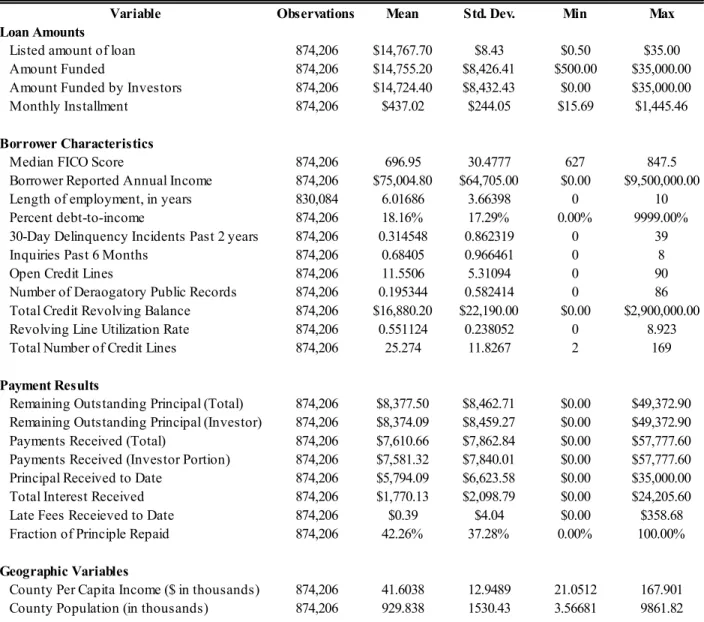
7. Data
This analysis utilizes individual loan-level data from the Lending Club for loans issued between 2007 and December 31, 20159. This Loan Statistics dataset contains loan and borrower
characteristics as well as performance results for 874,206 loans. The dataset contains the following relevant information: Lending Club loan subgrade, funded interest rate, borrower zip code, borrower state, number of delinquencies in past two years, month of borrower’s earliest credit line, employment length, borrower’s FICO score range, amount of the loan, home
ownership, reported income, whether and how income was verified, number of open credit lines, loan purpose, term of loan, the loan’s current status, the borrower’s revolving credit balance and utilization rates, and the amount funded by investors. Utilizing the borrower’s zip code, we also provide insight into how the population of a borrower’s county and its per capita income
influence loan performance. Table 11.1.1 in the appendix contains tables outlining key summary statistics for each quantitative variable as well as information on the distribution of different loans by their loan grade, purpose, and other factors.
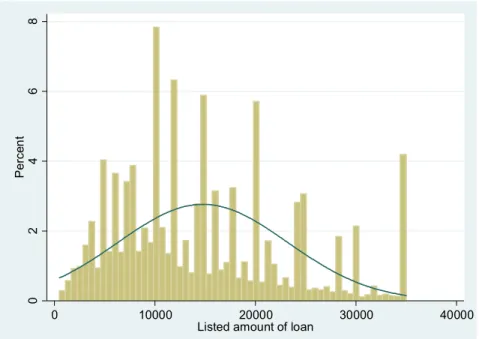
Figures 1 and 2 show informative distributions of loans and borrowers utilizing Lending Club. The average loan with Lending Club in our dataset had a principle of $14,767.70 with a
monthly principle payment of $437.02. We overlay the chart with a normal curve as the spikes represent round numbered loan values rather than major differences between loan value
preferences. The average Median FICO score for borrowers is 696.65 with nearly all borrowers having a median FICO score above 662.10
Figure 1. Loan Amount Distribution
10 Two borrowers from 2007 had median FICO scores of 627 and 632, and the rest were all 662 or above.
0
2
4
6
8
Pe
rc
en
t
0 10000 20000 30000 40000
Figure 2. Median FICO Score Distribution
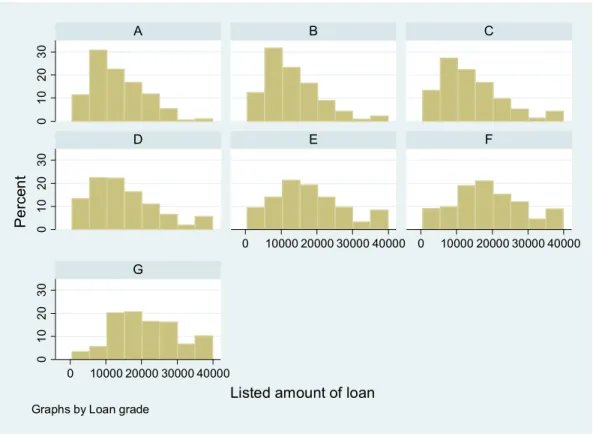
The figures below illustrate different trends observable in the data. Firstly, we see in Figure 3 the strong affect that a loan’s amount can have on the interest rate. A rated loans are the
0
2
4
6
8
10
Pe
rc
en
t
600 650 700 750 800 850
lowest interest rate loans and they are highly skewed to loans less than $10,000, whereas F and G, the lowest loans have many larger valued loans:
Figure 3 Loan Amount by Loan Grade
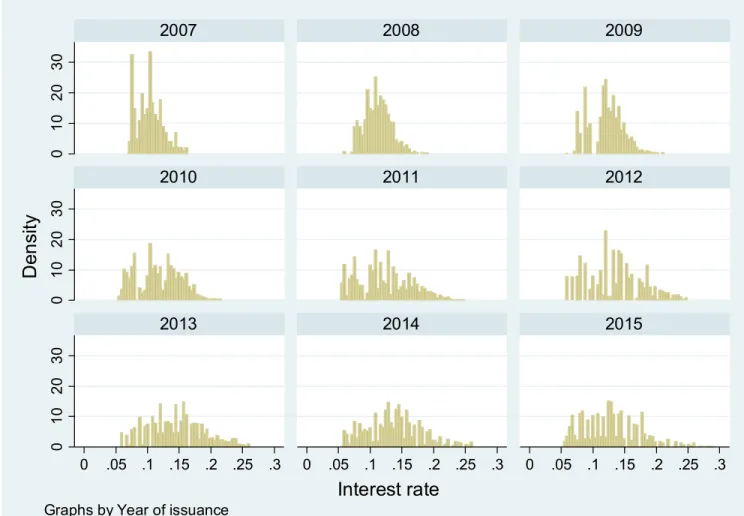
We also find in Figures 4 and 5, shown below, that Lending Club has been diligent in issuing loans mainly with less default risk. This supports our discussion of the Lending Club’s current position as an emerging platform that does not want to issue too many bad, delinquent loans or else run the risk of a consumer departure to Prosper. Each year, as Lending Club has distanced itself from Prosper, it has become more willing to issue riskier, higher interest rate loans. Figure 3 also suggests a network effect occurring for those seeking debt relief by the overwhelmingly issuance of loans intended for refinancing of credit card debt and debt
0
10
20
30
0
10
20
30
0
10
20
30
0 10000 20000 30000 40000 0 10000 20000 30000 40000
0 10000 20000 30000 40000
A B C
D E F
G
Pe
rc
en
t
consolidations. This is evidence that borrowers have identified the benefit of borrowing through a platform such as lender for these purposes and have thus continued to utilize this service. Inter
Figure 4 Yearly Interest Rate Distributions
0
10
20
30
0
10
20
30
0
10
20
30
0 .05 .1 .15 .2 .25 .3 0 .05 .1 .15 .2 .25 .3 0 .05 .1 .15 .2 .25 .3
2007 2008 2009
2010 2011 2012
2013 2014 2015
D
en
sit
y
Interest rate
0 50,000 100,000 150,000 200,000 250,000 300,000 350,000 400,000 450,000
Figure 5: Loan Volume by Purpose and Grade
8. Results and Findings: 8.1 Interest Rate Analysis
To estimate Lending Club’s interest rate formulation, we estimate a linear regression:
= + + + + +
Interest rate paid is the interest rate expressed as a percent value, not as a decimal. Purpose is an indicator variable for the stated loan purpose with Car Financing being the base case. Home indicates whether the borrower is a renter or home owner as compared to the base case of someone with a mortgage. Term is a dummy variable to differentiate between 36 and 60 month loans. Amount is the listed amount of the loan applied for by the borrower11. FICO
corresponds to the median of the borrower’s FICO range at the time the loan was originated. Employment is the number of years the borrower has been employed12. Income is the per-capita
income, in thousands of dollars of the county from which the borrower applied for the loan. Population is the population, in thousands of people, of the county from which the borrower applied for the loan13. Years range from 2007 to 2015. Finally, is a control for state level fixed-
and random-effects in year t.
11 If the credit department elects to reduce the loan amount at a certain point in time, this value reflects that change. 12 This variable is truncated to zero or ten if employment length is less than one year or greater than ten years,
respectively.
13 For both population and income, county level data comes from the Bureau of Economic Analysis’s “Local Area
Our regression results using ordinary least squares and random- and fixed- state effects are shown in the appendix in Table 11.2.1. Controlling for these factors, results indicate Lending Club assigned interest rates are not consistent across loan purposes. Results indicate that loans aimed at refinancing credit card debt are assigned interest rates 1.65 percentage points lower than car financing loans, all else being equal. Conversely, small business loans and moving expense interest rates were 3.27 and 3.13 percentage points higher, respectively. Also renewable energy financings, home down payments, dream vacations and other purposes all increased the interest rate by at least two percentage points.
Results also indicate a $1000 increase in the amount of the loan increased the interest rate by 0.07 percentage points. Each additional year someone had been working affected a decrease of .002 percentage points. A one-point increase in FICO scores lowered the interest rate by .06 percentage points. Higher borrower-reported annual incomes lowered interest rates by .003 percentage points per $1,000. Increasing the term of the loan from 36 to 60 months raised the interest rate by 3.84 percentage points. For every $1,000 increase in per-capita county income, loans received a .004 percentage point decrease in the assigned interest rate. Finally, home owners received 0.43 percentage point higher interest rates and renters received 0.48 percentage point higher interest rates. Additionally, loans funded in 2009, 2012, 2013 and 2014 received the highest interest rates.
8.2 Loan Purpose and Delinquency Analysis:
refinancings, debt consolidations, and wedding expenses. In Table 8.2.1 below, we compare results of our delinquency analysis for each loan purpose with the interest rate coefficients we determined from Lending Club.
Table 8.2.1: Logit Delinquency vs. Interest Rate Analysis
Marginal Effects Fixed Effects
Delinquency coef/se Interest Rate coef/se
Refinancing Credit Card -0.008*** Refinancing Credit Card -1.654***
(0.002) (0.026)
Wedding Expenses -0.003 Consolidate Debt -0.187***
(0.004) (0.034)
Car Financing (Base) Car Financing (Base)
Consolidate Debt 0.005** Educational 0.273**
(0.002) (0.108)
Major Purchase 0.008*** Home Improvement 0.294***
(0.003) (0.033)
Home Improvement 0.010*** Major Purchase 0.384***
(0.002) (0.046)
Vacation 0.020*** Wedding Expenses 1.273***
(0.004) (0.067)
Other 0.021*** Medical Expenses 1.977***
(0.002) (0.046)
Home Down Payment 0.023*** Vacation 2.141***
(0.004) (0.062)
Medical Expenses 0.025*** Other 2.174***
(0.004) (0.035)
Educational 0.026** Home Down Payment 2.875***
(0.011) (0.086)
Moving Expenses 0.031*** Renewable Energy Financing 2.904***
(0.004) (0.125)
Renewable Energy Financing 0.040*** Moving Expenses 3.126***
(0.012) (0.068)
Small Business Loan 0.063*** Small Business Loan 3.269***
(0.004) (0.057)
Number of observations 829,517 Number of observations 829,643
These results clearly indicate that certain loan purposes do result in different loan performances, even when controlling for the factors that make up much of Lending Club's
interest rate assignment model. However, when considering loans by their subgrades we find that much of the significance of these results are mitigated. As Tables 11.2.4 and 11.2.5 of the
appendix show, for loans rated A through F, many purposes that were of minor initial
significance lose their significance and those that were very significant reduce their significance. Repeating this within individual subgrades or regressing against interest rate also corroborates this finding. However, certain examples do still exist that show irregularity and incorrect interest rate assignment. Remarkably, in loan grades A through E Small Business loans underperform at the 1% significance level. For A and B loans, renewable energy financing and moving expenses also underperform as shown in Tables 4 and 5. While an immediate reaction is to assume that this is a result of worse performing loans being higher rated loans, irregularities such as the case of wedding expenses suggest some inconsistencies in Lending Club rate assignment.
For investors, our results suggest investors should seek out those loans which are targeted at wedding expenses as they are often charged relatively higher rates for an extremely low delinquency rate. However, a test of Lending Club’s ability to create an efficient online marketplace is whether this irregularity will gradually be reduced through assigning lower interest rates to this loan category. With this being said, it is important to contextualize that wedding expenses only accounted for slightly more than 2,000 of the nearly 830,000 loans considered in our analysis. As such, it is difficult to foresee this as a major arbitrage opportunity. A topic for further research is to examine the market for these loan purposes with incongruous rates in Lending Club’s secondary market, the Note Trading Platform14.
14 The Note Trading Platform is a service Lending Club offers hosted by FOLIOfn Investments, Inc. that creates a
8.3 Income Verification Analysis:
As for borrowers’ incomes, our results support Lending Club’s claims that it adequately verifies borrowers’ incomes. For every $1,000 increase in self-reported annual income, Lending Club lowers interest rates by .003%. This lowered interest rate is matched by a .0002% deduction in the probability of a loan being delinquent.
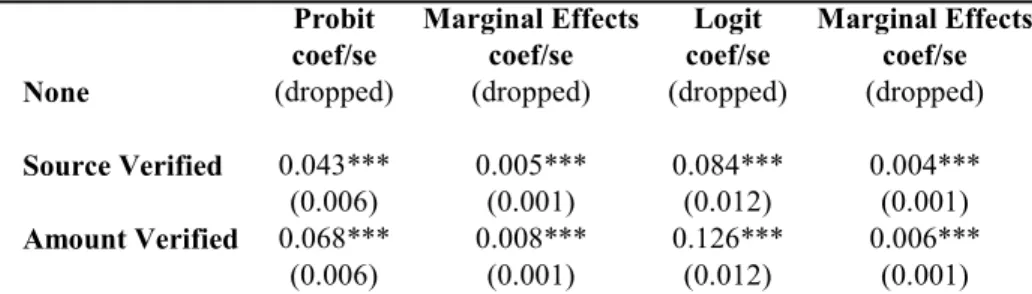
More importantly for Lending Club’s reputation as a fair loan provider is the
performance of their verified loans. Table 8.3.1 below shows the relative change in performance between loans that receive no income verification, those of which the source is verified, and those of which the amount is verified. As shown by the positive coefficients of source and income verification, loans are more likely to become delinquent if they are taken out by borrowers on which Lending Club elects to perform income verification. Loans of which the source or amount of the borrower’s income are verified in the loan review process actually perform worse than their counterparts which are unverified, indicating that lending Club is taking sufficient measures to ensure fraudulent loans do not make it through the loan verification
process.
Table 8.3.1. Relationship Between Income Verification and Delinquency
Probit Marginal Effects Logit Marginal Effects
coef/se coef/se coef/se coef/se
None (dropped) (dropped) (dropped) (dropped)
Source Verified 0.043*** 0.005*** 0.084*** 0.004*** (0.006) (0.001) (0.012) (0.001)
Amount Verified 0.068*** 0.008*** 0.126*** 0.006*** (0.006) (0.001) (0.012) (0.001)
Note: Measures marginal effect on delinquency, all else being at means.
Delinquency is determined as having a loan status of "charged off,""default," or "late (31-120 days)"; robust standard errors shown below; * Denotes
significance levels P<.01 - ***; P<.05 - **; P<.1 - *; State fixed effects included in estimation.
While Mach (2014) did a similar analysis of loan purpose, the analysis below contributes to the prior literature by incorporating the continuous variable of principle repayment. We find that borrowers asking for loans intended for car financing, wedding expenses, and credit card refinancing generally pay back the highest percent of the initial principle amount that is funded by the loan. Once more small business loans and renewable energy financing are found in the bottom quarter of loan performance. Interestingly, home down payments seem to be in the middle of the pack for principle repayment and delinquency rates yet still receive the third highest interest rate. Again this indicates a potential discrepancy between Lending Club’s interest rate assignment and the amount that an investor can expect to return on his investment. This does not necessarily determine irrational interest rate assignment, however, as this only considers the fraction of principle repaid and does not reflect the compensation investors receive in interest rate payments.
8.5 Economic Rationales for Loan Purpose Results:
As the leading player in the U.S. online peer-to-peer lending market, Lending Club has established itself as a unique alternative to the traditional consumer finance marketplace. Still in its infancy as an organization, Lending Club has already created a robust market for borrowers seeking credit and investors seeking access to relatively safe consumer loans. In our analysis, we find that this market is somewhat efficient, but still presents a theoretical opportunity for
arbitrage through selectively choosing loans that are intended for certain purposes.
performing credit card re-financing, car financing, and debt consolidation loans and the highest rates to small business, moving expenses, and renewable energy financing, all bad performers.
While Lending Club does not publish its model of interest rate assignment nor do borrowers still provide loan descriptions for investors, we are able to theorize some of the disparity between loan performances through economic rationales. Firstly, recalling that over 99% of requested loans receive full funding, we are relatively confident borrowers have little economic incentive to deceive on a loan application unless they believe Lending Club will assign them a higher interest rate. Even if they were skeptical of this, the threat of being removed from the service for a fraudulent application suggests borrowers have deterrence from committing fraud.
Conversely, for those loans which have higher incidence of failure, borrowers at worst take on exceptional risk and at best are likely unconcerned with their credit. As Mach et al (2014) suggests, borrowers that opt for a loan for a small business through Lending Club’s consumer platform are likely unable to maintain credit access for their business and have a higher likelihood of failure. This has only become more probable since Lending Club began offering business loans and business lines of credit.15
Similarly, loans for education are shown to be one of the worst performers in both our logistic and ordinary least squares regressions despite only having the fourth highest interest rate. The marginal effect of educational purpose on delinquency is a 2.6% increase over car
financings, the fourth highest. However, educational loans are assigned only 0.27% higher than car financings, the fourth lowest, all else being equal.
A possible explanation for this can be constructed when recalling that Herzenstein et al. (2011) found that lenders respond positively to crafted identities in online applications with descriptions. It is possible that lenders receive additional utility helping someone gain access to education, thereby increasing the demand for these loans and driving down their interest rates. On the other hand, those borrowers seeking out education are likely in a diminished financial standing as they require additional education to meet certain needs. Without empirical evidence to substantiate these claims, these rationales are not to be taken as concrete explanations but rather as examples to illustrate that inconsistencies in performance between borrowers of different loan purpose can be grounded in economical reasoning.
15 While anyone applying for a traditional Lending Club loan can state “Small Business” as their loan purpose, today
8.6 Economic Rationales for Home Ownership Results:
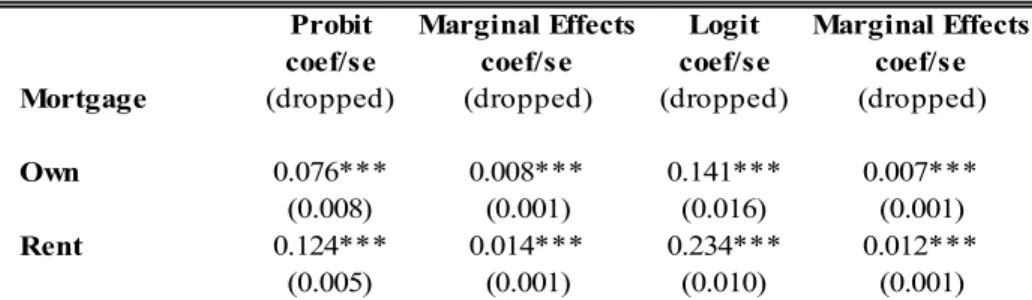
Another unverified factor for lenders to consider is the housing situation of a borrower. Our analysis suggests statistically significant correlation exists between one’s homeownership status and the probability his loan becomes delinquent. As evidenced in Table 8.6.1, renters are most likely to go delinquent, followed by home owners and then those who have a mortgage. This is also reflected in interest rate assignment as evidenced in Table 11.2.1. Once more, economic rationalization presents compelling explanations for this ordering.
Table 8.6.1. Relationship Between Home Ownership and Delinquency
Probit Marginal Effects Logit Marginal Effects
coef/se coef/se coef/se coef/se
Mortgage (dropped) (dropped) (dropped) (dropped)
Own 0.076*** 0.008*** 0.141*** 0.007***
(0.008) (0.001) (0.016) (0.001)
Rent 0.124*** 0.014*** 0.234*** 0.012***
(0.005) (0.001) (0.010) (0.001)
Note: Measures marginal effect on delinquency, all else being at means. Delinquency is determined as having a loan status of "charged off,""default," or "late (31-120 days)"; robust standard errors shown below; * Denotes significance levels P<.01 - ***; P<.05 - **; P<.1 - *; State fixed effects included in estimation.
homeowners may be less credit sensitive than mortgage owners as they are likely less concerned about their credit as they already own a home which is the largest purchase most individuals will need to make in their lifetime. On the other hand, since they do not have any rent payments to make, home owners likely have less of a monthly financial commitment to make than renters. Whereas renters and homeowners may be willing to forego payment, borrowers who have a mortgage are often highly incentivized to make loan payments given that a late payment on a Lending Club loan will influence their credit score. Since adjustable-rate-mortgages and refinancing applications are extremely common today, someone with a mortgage is highly sensitive to his credit score as changing it can either significantly increase or decrease his monthly mortgage payment amount. Thus, even though mortgage payments are typically higher than rent payments and therefore more difficulty to make, those with a mortgage have the highest potential cost of default, (Φ), and thus are most likely to repay their loans.
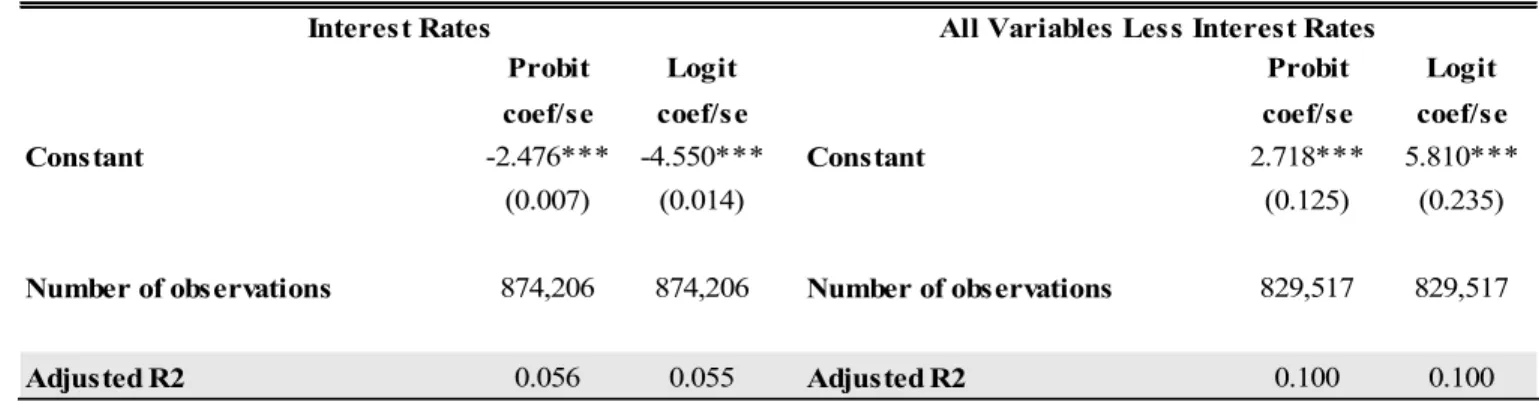
8.7 Discussion of Predictive Power of Interest Rates Compared to All Variables:
Briefly returning to our theoretical model discussion, we seek to determine whether it is optimal for investors to consider more factors in their analysis or merely defer to the Lending Club’s interest rate assignment process in determining whether to invest in a loan. In Table 8.7.1 below, we compare the explanatory powers of a probit and logit analysis on loan delinquency for just the Lending Club’s assigned interest rate with our earlier described probit and logit analysis using all variables a lender can see at the time he chooses to fund a loan. Once more we use robust standard errors. Our results demonstrate that a model encompassing all variables available to a lender except for the interest rate has more predictive power about the borrower’s
performance than an interest rate alone based on the higher Adjusted of the second
research on the many factors available for consideration in a loan application may not merit a lender conducting extensive additional analysis. Moreover, some of this increase must be
attributed to the model having more variables regardless of their economic impact. Thus, we find lenders can receive a statistically significant marginal increase in predictive power by
considering a myriad of verified and unverified factors but that likely these deviations are economically insignificant.
Table 8.7.1. Predictive Power of Interest Rates vs. All Loans
Interest Rates All Variables Less Interest Rates
Probit Logit Probit Logit
coef/se coef/se coef/se coef/se
Constant -2.476*** -4.550*** Constant 2.718*** 5.810***
(0.007) (0.014) (0.125) (0.235)
Number of observations 874,206 874,206 Number of observations 829,517 829,517
Adjusted R2 0.056 0.055 Adjusted R2 0.100 0.100
Note: * Denotes significance levels P<.01 - ***; P<.05 - **; P<.1 - *;
9. Conclusion:
discrepancies across geographies as lenders are able to filter by state and our analyses suggest further discrepancies may emerge when considering loans by state or even zip code.
While these discrepancies emerge, as discussed in Section 8.7, the Lending Club has created a marketplace that lacks significant opportunities for feasible arbitrage. The economic impact of one loan being less likely to become delinquent than another by fractions of a percent suggests it is economically intractable to exploit these inefficiencies. For institutional investors, exploiting loan purposes is manageable through automated trading algorithms, but those
algorithmic trading schemes will favor diversification across loan purposes rather than an exclusive pursuit of a few factors. For consumer lenders selecting only a few loans for a small amount, it is possible that opting for certain purposes over another within a given subgrade is reasonable using the filter tool, but they would have to gain more access to Lending Club’s interest rate assignment model to ensure they are in fact making a sound judgment in choosing one purpose over another.
Adopting the language of Fama (1991) for efficiency in equity markets, predictability becomes a central issue in assessing the market efficiency of Lending Club and other online peer-to-peer lending markets. In analyzing past performance data, we have been able to find discrepancies between loan performance and interest rates that suggest someone who controlled for other factors could theoretically select loans of a certain purpose over another within a given subgrade and receive an elevated return. As discussed, however, our findings indicate Lending Club has constructed what Fama describes as a “weaker and economically more sensible”
performance with respect to unverified information but should not expect to find opportunities for outsized returns. For this platform company seeking to become the dominant player in what is currently a two-sided market, Lending Club’s market efficiency will serve it will in
10. Bibliography
Arthur, W. Brian. "Positive feedbacks in the economy." The McKinsey Quarterly 1 (1994): 81-96.
Biglaiser, Gary. “Middlemen as Experts”. The RAND Journal of Economics 24.2 (1993): 212– 223. Web.
Burke, Jeremy M., Curtis R. Taylor, and Liad Wagman. "Information acquisition in competitive markets: An application to the US mortgage market." American Economic Journal:
Microeconomics 4.4 (2012): 65-106.
"Changes to loan listings as of March 19th, 2014." Lending Club. Lending Club Corporation, n.d. Web. 29 Nov. 2015.
Crawford, Vincent P. 2003. “Lying for Strategic Advantage: Rational and Boundedly Rational Misrepresentation of Intentions,” The American Economic Review, Volume93 No. 1 133-149.
Fama, Eugene F.. “Efficient Capital Markets: II”. The Journal of Finance 46.5 (1991):
1575-1617.
Farrell, Joseph, and Rabin Matthew, 1996, “Cheap Talk,” Journal of Economic Perspectives, 10(3): 103-118.
Freedman, S., & Jin, G. Z. 2014. The Signaling Value of Online Social Networks: Lessons from Peer-to-Peer Lending. Working paper.
Gao, Q. and M. Lin, 2015. Linguistic Features and Peer-to-Peer Loan Quality: A Machine Learning Approach.
Inderst, R. (2008): “‘Irresponsible Lending’ with a Better Informed Lender,” Economic Journal, 118, 1499-1519
Iyer, R., Khwaja, A. I., Luttmer, E. F. P., & Shue, K. 2014. Inferring Asset Quality: Determining Borrower Creditworthiness in Peer-to-Peer Lending Markets. Working paper.
Jeremy Michels (2012) Do Unverifiable Disclosures Matter? Evidence from Peer-to-Peer Lending. The Accounting Review: July 2012, Vol. 87, No. 4, pp. 1385-1413.
Kawai, Kei; Ken Onishi and Kosuke Uetake (2014) “Signaling in Online Credit Markets”, New York University.
Herzenstein, M., Dholakia, U. M., Andrews, R. L. 2011. Strategic herding behavior in peer-topeer loan auctions. Journal of Interactive Marketing, 25(1) 27–36.
Herzenstein, M., Sonenshein, S., & Dholakia, U. M. 2011. Tell me a Good Story and I may Lend you my Money: The Role of Narratives in Peer-to-Peer Lending Decisions. Journal of Marketing Research, 48: S138-S149.
Houser, Daniel and Wooders, John, Reputation in Auctions: Theory, and Evidence from eBay. Journal of Economics & Management Strategy, Vol. 15, pp. 353-369, Summer 2006. Hucks, Randall J. Voluntary Involuntary Disclosure. Diss. U of Michigan, 2015. N.p.: n.p., n.d.
Business Administration. Web.
Mach, Traci, Courtney Carter, and Cailin R. Slattery. "Peer-to-peer lending to small businesses."
(2014).
Petersen, Mitchell A. Information: Hard and soft. working paper, Northwestern University 2004.
“Small Business Loans: Fixed Rate Financing Up to $300,000.” Lending Club Corporation, n.d.
11. Appendix:
11.1 Summary Statistics
Table 11.1.1. Summary Statistics for Quantitative Variables
Variable Observations Mean Std. Dev. Min Max
Loan Amounts
Listed amount of loan 874,206 $14,767.70 $8.43 $0.50 $35.00
Amount Funded 874,206 $14,755.20 $8,426.41 $500.00 $35,000.00
Amount Funded by Investors 874,206 $14,724.40 $8,432.43 $0.00 $35,000.00
Monthly Installment 874,206 $437.02 $244.05 $15.69 $1,445.46
Borrower Characteristics
Median FICO Score 874,206 696.95 30.4777 627 847.5
Borrower Reported Annual Income 874,206 $75,004.80 $64,705.00 $0.00 $9,500,000.00
Length of employment, in years 830,084 6.01686 3.66398 0 10
Percent debt-to-income 874,206 18.16% 17.29% 0.00% 9999.00%
30-Day Delinquency Incidents Past 2 years 874,206 0.314548 0.862319 0 39
Inquiries Past 6 Months 874,206 0.68405 0.966461 0 8
Open Credit Lines 874,206 11.5506 5.31094 0 90
Number of Deraogatory Public Records 874,206 0.195344 0.582414 0 86 Total Credit Revolving Balance 874,206 $16,880.20 $22,190.00 $0.00 $2,900,000.00 Revolving Line Utilization Rate 874,206 0.551124 0.238052 0 8.923
Total Number of Credit Lines 874,206 25.274 11.8267 2 169
Payment Results
Remaining Outstanding Principal (Total) 874,206 $8,377.50 $8,462.71 $0.00 $49,372.90 Remaining Outstanding Principal (Investor) 874,206 $8,374.09 $8,459.27 $0.00 $49,372.90 Payments Received (Total) 874,206 $7,610.66 $7,862.84 $0.00 $57,777.60 Payments Received (Investor Portion) 874,206 $7,581.32 $7,840.01 $0.00 $57,777.60 Principal Received to Date 874,206 $5,794.09 $6,623.58 $0.00 $35,000.00 Total Interest Received 874,206 $1,770.13 $2,098.79 $0.00 $24,205.60
Late Fees Receieved to Date 874,206 $0.39 $4.04 $0.00 $358.68
Fraction of Principle Repaid 874,206 42.26% 37.28% 0.00% 100.00%
Geographic Variables
Table 11.1.2. Loan Purpose by Loan Subgrade
Loan Purpose A B C D E F G Total
Car Financing 2,327 2,644 2,080 1,004 443 151 31 8,680
27% 30% 24% 12% 5% 2% 0% 100%
Refinancing Credit Card 50,575 71,792 50,522 20,579 7,844 1,816 299 203,427
25% 35% 25% 10% 4% 1% 0% 100%
Consolidate Debt 72,761 143,102 150,455 87,699 45,812 14,362 3,109 517,300
14% 28% 29% 17% 9% 3% 1% 100%
Educational 78 101 88 31 13 4 1 316
25% 32% 28% 10% 4% 1% 0% 100%
Home Improvement 9,870 14,270 13,536 7,444 4,127 1,399 342 50,988
19% 28% 27% 15% 8% 3% 1% 100%
Home Down Payment 379 608 778 731 606 343 159 3,604
11% 17% 22% 20% 17% 10% 4% 100%
Major Purchase 3,847 4,680 4,261 2,402 1,175 425 102 16,892
23% 28% 25% 14% 7% 3% 1% 100%
Medical Expenses 822 1,791 2,538 1,839 941 355 77 8,363
10% 21% 30% 22% 11% 4% 1% 100%
Moving Expenses 337 790 1,489 1,471 793 332 76 5,288
6% 15% 28% 28% 15% 6% 1% 100%
Other 3,599 8,183 12,163 9,922 5,189 2,200 605 41,861
9% 20% 29% 24% 12% 5% 1% 100%
Renewable Energy Financing 57 89 141 140 83 41 10 561
10% 16% 25% 25% 15% 7% 2% 100%
Small Business Loan 825 1,419 2,253 2,475 1,782 888 373 10,015
8% 14% 22% 25% 18% 9% 4% 100%
Vacation 436 973 1,547 1,110 440 125 22 4,653
9% 21% 33% 24% 9% 3% 0% 100%
Wedding Expenses 441 535 471 487 201 101 22 2,258
20% 24% 21% 22% 9% 4% 1% 100%
Total 146,354 250,977 242,322 137,334 69,449 22,542 5,228 874,206
17% 29% 28% 16% 8% 3% 1% 100%
Table 11.1.3. Loan Status by Loan Subgrade
Status A B C D E F G
Charged Off 2,195 7,845 9,739 8,002 4,680 2,286 591
6% 22% 28% 23% 13% 6% 2%
Current 71,454 120,300 120,460 69,252 33,792 10,428 2,366
17% 28% 28% 16% 8% 2% 1%
Default 11 38 72 47 32 18 5
5% 17% 32% 21% 14% 8% 2%
Fully Paid 32,099 52,614 40,716 23,245 9,923 3,707 908
20% 32% 25% 14% 6% 2% 1%
In Grace Period 261 1,000 1,522 1,235 744 299 90
5% 19% 30% 24% 14% 6% 2%
Late (16-30 days) 98 333 549 477 332 121 42
5% 17% 28% 24% 17% 6% 2%
Late (31-120 days) 378 1,569 2,715 2,273 1,479 603 191
4% 17% 29% 25% 16% 7% 2%
Total 106,496 183,699 175,773 104,531 50,982 17,462 4,193
17% 29% 27% 16% 8% 3% 1%
The table above sorts each loan by its status within each subgrade. The percentages denote the percent across each loan status rather than each loan grade.
Table 11.1.4. Loan Term by Loan Subgrade
Term A B C D E F G Total
36 Months 103,315 155,502 117,963 58,657 16,567 3,525 369 455,898
23% 34% 26% 13% 4% 1% 0% 100%
60 Months 3,181 28,197 57,810 45,874 34,415 13,937 3,824 187,238
2% 15% 31% 25% 18% 7% 2% 100%
Total 106,496 183,699 175,773 104,531 50,982 17,462 4,193 643,136
11.2 Regression Results
Table 11.2.1. Interest Rate Estimations
OLS Random Effects (State) Fixed Effects (State)
coef/se coef/se coef/se
Loan Purposes
Car Financing (dropped) (dropped) (dropped)
Refinancing Credit Card -1.655*** -1.655*** -1.654***
(0.033) (0.026) (0.026)
Consolidate Debt -0.184*** -0.184*** -0.187***
(0.033) (0.033) (0.034)
Educational 0.282** 0.282*** 0.273**
(0.116) (0.106) (0.108)
Home Improvement 0.298*** 0.298*** 0.294***
(0.035) (0.031) (0.033)
Home Down Payment 2.879*** 2.879*** 2.875***
(0.078) (0.086) (0.086)
Major Purchase 0.389*** 0.389*** 0.384***
(0.040) (0.044) (0.046)
Medical Expenses 1.981*** 1.981*** 1.977***
(0.049) (0.046) (0.046)
Moving Expenses 3.140*** 3.140*** 3.126***
(0.059) (0.071) (0.068)
Other 2.183*** 2.183*** 2.174***
(0.036) (0.033) (0.035)
Renewable Energy Financing 2.915*** 2.915*** 2.904***
(0.157) (0.125) (0.125)
Small Business Loan 3.275*** 3.275*** 3.269***
(0.049) (0.057) (0.057)
Vacation 2.151*** 2.151*** 2.141***
(0.058) (0.064) (0.062)
Wedding Expenses 1.280*** 1.280*** 1.273***
(0.072) (0.065) (0.067)
Home Ownership
Mortgage (dropped) (dropped) (dropped)
Own 0.446*** 0.446*** 0.433***
(0.012) (0.015) (0.015)
Rent 0.485*** 0.485*** 0.476***
(0.008) (0.018) (0.012)
Table 11.2.1. Interest Rate Estimations
OLS Random Effects (State) Fixed Effects (State)
coef/se coef/se coef/se
Loan Characteristics
36 Month Loan (dropped) (dropped) (dropped)
60 Month Loan 3.837*** 3.837*** 3.836***
(0.009) (0.017) (0.016)
Listed amount of loan 0.065*** 0.065*** 0.065***
(0.001) (0.002) (0.002)
Median FICO Score -0.056*** -0.056*** -0.056***
(0.000) (0.000) (0.000)
Length of employment, in years -0.002** -0.002 -0.002*
(0.001) (0.002) (0.001)
Per Capita Income Per County -0.003*** -0.003** -0.004***
(0.000) (0.001) (0.001)
County Population 0.000 0.000 0.000
(0.000) (0.000) (0.000)
Borrower Reported Annual
Income -0.000*** -0.000*** -0.000***
(0.000) (0.000) (0.000)
Percent debt-to-income 0.066*** 0.066*** 0.066***
(0.001) (0.001) (0.001)
30-Day Delinquency Incidents
Past 2 years 0.010** 0.010* 0.009
(0.004) (0.006) (0.006)
Inquiries Past 6 Months 0.903*** 0.903*** 0.907***
(0.004) (0.008) (0.008)
Open Credit Lines 0.019*** 0.019*** 0.019***
(0.001) (0.002) (0.002)
Number of Deraogatory Public
Records -0.008 -0.008 -0.007
(0.006) (0.011) (0.011)
Total Credit Revolving Balance -0.000*** -0.000*** -0.000***
(0.000) (0.000) (0.000)
Revolving Line Utilization Rate 1.142*** 1.142*** 1.144***
(0.023) (0.048) (0.050)
Total Number of Credit Lines -0.044*** -0.044*** -0.044***
(0.000) (0.002) (0.002)
Percent Funded by Investors (dropped) (dropped) (dropped)
Table 11.2.1. Interest Rate Estimations
OLS Random Effects (State) Fixed Effects (State)
coef/se coef/se coef/se
Year
2008 0.570*** 0.570*** 0.576**
(0.171) (0.212) (0.222)
2009 1.917*** 1.917*** 1.929***
(0.165) (0.195) (0.203)
2010 0.504*** 0.504** 0.512**
(0.164) (0.209) (0.218)
2011 0.656*** 0.656*** 0.661***
(0.163) (0.205) (0.216)
2012 1.941*** 1.941*** 1.945***
(0.162) (0.196) (0.208)
2013 2.421*** 2.421*** 2.426***
(0.162) (0.217) (0.230)
2014 1.304*** 1.304*** 1.309***
(0.162) (0.215) (0.227)
2015 0.217 0.217 0.224
(0.162) (0.210) (0.223)
Statistics
Constant 48.316*** 48.316*** 48.311***
(0.198) (0.268) (0.273)
F 26,288.635 415,485.120
Number of observations 829,643 829,643 829,643
R2 0.538 0.538
Adjusted R2 0.538 0.538
Table 11.2.2. Probit Logit Delinquency Analysis
Probit Logit coef/se coef/se Loan Purposes
Car Financing (dropped) (dropped)
Refinancing Credit Card -0.090*** -0.187*** (0.023) (0.047)
Consolidate Debt 0.055** 0.097**
(0.023) (0.046)
Educational 0.232** 0.441***
(0.091) (0.167)
Home Improvement 0.104*** 0.198***
(0.025) (0.050)
Home Down Payment 0.216*** 0.400***
(0.038) (0.073)
Major Purchase 0.089*** 0.161***
(0.028) (0.055)
Medical Expenses 0.225*** 0.434***
(0.031) (0.061)
Moving Expenses 0.271*** 0.514***
(0.034) (0.066)
Other 0.195*** 0.375***
(0.024) (0.049)
Renewable Energy Financing 0.337*** 0.634*** (0.078) (0.147)
Small Business Loan 0.466*** 0.875***
(0.028) (0.054)
Vacation 0.181*** 0.351***
(0.037) (0.073)
Wedding Expenses -0.042 -0.074
(0.042) (0.081)
Home Ownership
Mortgage (dropped) (dropped)
Own 0.076*** 0.141***
(0.008) (0.016)
Rent 0.124*** 0.234***
(0.005) (0.010)
Table 11.2.2. Probit Logit Delinquency Analysis
Probit Logit
coef/se coef/se Income Verification
None (dropped) (dropped)
Income Source Verified 0.043*** 0.084***
(0.006) (0.012)
Income Verified 0.068*** 0.126***
(0.006) (0.012)
Loan Characteristics
36 Month Loan (dropped) (dropped)
60 Month Loan 0.178*** 0.350***
(0.005) (0.010)
Listed amount of loan 0.009*** 0.021***
(0.001) (0.001)
Median FICO Score -0.006*** -0.011***
(0.000) (0.000) Length of employment, in years -0.005*** -0.010***
(0.001) (0.001)
Per Capita Income Per County -0.001*** -0.002***
(0.000) (0.000)
County Population 0.000*** 0.000***
(0.000) (0.000) Borrower Reported Annual Income -0.000*** -0.000***
(0.000) (0.000)
Percent debt-to-income 0.010*** 0.018***
(0.000) (0.001) 30-Day Delinquency Incidents Past 2 years 0.011*** 0.020***
(0.003) (0.005)
Inquiries Past 6 Months 0.095*** 0.182***
(0.002) (0.004)
Open Credit Lines 0.003*** 0.008***
(0.001) (0.001) Number of Deraogatory Public Records -0.033*** -0.064***
(0.005) (0.010) Total Credit Revolving Balance -0.000*** -0.000***
(0.000) (0.000) Revolving Line Utilization Rate 0.076*** 0.186***
(0.013) (0.026)
Total Number of Credit Lines -0.004*** -0.007***
(0.000) (0.001)
Percent Funded by Investors 0.000*** 0.000***
(0.000) (0.000)
Table 11.2.2. Probit Logit Delinquency Analysis
Probit Logit coef/se coef/se Year
2007 (dropped) (dropped)
2008 -0.152 -0.338*
(0.104) (0.190)
2009 -0.224** -0.412**
(0.098) (0.177)
2010 -0.252*** -0.466***
(0.096) (0.174)
2011 -0.190** -0.354**
(0.096) (0.172)
2012 -0.223** -0.427**
(0.095) (0.172)
2013 -0.353*** -0.669***
(0.095) (0.172)
2014 -0.587*** -1.119***
(0.095) (0.172)
2015 -1.176*** -2.368***
(0.095) (0.172)
Statistics
Constant 2.718*** 5.810***
(0.125) (0.235)
Number of observations 829,517 829,517
Adjusted R2 0.100 0.100
Table 11.2.3. Probit Logit Delinquency Marginal Effects Probit Logit coef/se coef/se Loan Purposes
Car Financing (dropped) (dropped)
Refinancing Credit Card -0.009*** -0.008*** (0.002) (0.002)
Consolidate Debt 0.006** 0.005**
(0.002) (0.002)
Educational 0.030** 0.026**
(0.014) (0.011)
Home Improvement 0.012*** 0.010*** (0.003) (0.002)
Home Down Payment 0.027*** 0.023*** (0.005) (0.004)
Major Purchase 0.010*** 0.008***
(0.003) (0.003)
Medical Expenses 0.029*** 0.025*** (0.004) (0.004)
Moving Expenses 0.036*** 0.031***
(0.005) (0.004)
Other 0.024*** 0.021***
(0.003) (0.002)
Renewable Energy Financing 0.047*** 0.040*** (0.013) (0.012)
Small Business Loan 0.071*** 0.063*** (0.004) (0.004)
Vacation 0.022*** 0.020***
(0.005) (0.004)
Wedding Expenses -0.004 -0.003
(0.004) (0.004)
Home Ownership
Mortgage (dropped) (dropped)
Own 0.008*** 0.007***
(0.001) (0.001)
Rent 0.014*** 0.012***
(0.001) (0.001)
Income Verification
None (dropped) (dropped)
Income Source Verified 0.005*** 0.004*** (0.001) (0.001)
Income Verified 0.008*** 0.006*** (0.001) (0.001)
Loan Characteristics
36 Month Loan (dropped) (dropped)
60 Month Loan 0.021*** 0.019***
(0.001) (0.001)
Listed amount of loan 0.001*** 0.001*** (0.000) (0.000)
Median FICO Score -0.001*** -0.001*** (0.000) (0.000)
Length of employment, in years -0.001*** -0.001*** (0.000) (0.000)
Per Capita Income Per
County -0.000*** -0.000***
(0.000) (0.000)
County Population 0.000*** 0.000*** (0.000) (0.000)
Borrower Reported Annual
Income -0.0001*** -0.0002***
(0.000) (0.000)
Percent debt-to-income 0.001*** 0.001*** (0.000) (0.000)
30-Day Delinquency Incidents
Past 2 years 0.001*** 0.001***
(0.000) (0.000)
Inquiries Past 6 Months 0.011*** 0.009*** (0.000) (0.000)
Open Credit Lines 0.000*** 0.000*** (0.000) (0.000)
Number of Deraogatory Public
Records -0.004*** -0.003***
(0.001) (0.000)
Total Credit Revolving Balance -0.000*** -0.000*** (0.000) (0.000)
Revolving Line Utilization Rate 0.009*** 0.009*** (0.002) (0.001)
Total Number of Credit Lines -0.000*** -0.000*** (0.000) (0.000)
Year
2007 (dropped) (dropped)
2008 -0.041 -0.051*
(0.030) (0.031)
2009 -0.059** -0.061**
(0.028) (0.029)
2010 -0.065** -0.068**
(0.028) (0.029)
2011 -0.051* -0.053*
(0.028) (0.029)
2012 -0.059** -0.063**
(0.028) (0.029)
2013 -0.087*** -0.091***
(0.028) (0.029)
2014 -0.129*** -0.131***
(0.028) (0.029)
2015 -0.188*** -0.188***
(0.028) (0.029)
Number of observations 829,517 829,517
Table 11.2.4. Fraction of Principle Repaid Linear Regression Analysis OLS Random Effects
(State)
Fixed Effects (State)
Loan Purposes coef/se coef/se coef/se
Car Financing (dropped) (dropped) (dropped) Refinancing Credit Card 0.015*** 0.015*** 0.015***
(0.005) (0.003) (0.003) Consolidate Debt -0.007 -0.007* -0.007* (0.005) (0.004) (0.004)
Educational -0.032** -0.032** -0.031**
(0.015) (0.015) (0.015) Home Improvement -0.011** -0.011** -0.011**
(0.005) (0.005) (0.005) Home Down Payment -0.041*** -0.041*** -0.040***
(0.011) (0.010) (0.010)
Major Purchase -0.005 -0.005 -0.005
(0.006) (0.005) (0.005) Medical Expenses -0.031*** -0.031*** -0.031***
(0.008) (0.007) (0.006) Moving Expenses -0.025*** -0.025** -0.025**
(0.009) (0.011) (0.011)
Other -0.029*** -0.029*** -0.029***
(0.005) (0.005) (0.005) Renewable Energy Financing -0.081*** -0.081*** -0.081***
(0.025) (0.020) (0.020) Small Business Loan -0.085*** -0.085*** -0.084***
(0.007) (0.008) (0.008)
Vacation -0.024** -0.024* -0.025*
(0.010) (0.013) (0.013)
Wedding Expenses -0.001 -0.001 -0.001
(0.007) (0.006) (0.006)
Home Ownership
Mortgage (dropped) (dropped) (dropped)
Own -0.011*** -0.011*** -0.011***
(0.003) (0.004) (0.004)
Rent -0.012*** -0.012*** -0.011***
(0.002) (0.003) (0.002)
Income Verification
None (dropped) (dropped) (dropped)
Income Source Verified -0.004* -0.004* -0.004* (0.002) (0.002) (0.002) Income Amount Verified -0.005** -0.005** -0.004**
(0.002) (0.002) (0.002)
Loan Characteristics