breeze particles in a nonconducting silica sphere background wetted withN a2SO4 solution. Based on a method used in geological field work, it is known that this type of system exhibits a peak in the phase response as a function of frequency. We vary the size of the conducting particles, the concentration of the electrolytic solution and the volume fraction of conducting particles to verify theoretical predictions about the behavior of this system. The frequency of the phase peak is confirmed to vary roughly as the inverse of the square of the conducting particle radius for particles with radii between 95 and 166 microns, and linear relations are found for the frequency of the phase peak and the electrolytic concentration and the amplitude of the phase peak and conducting particle volume fraction. Conductivity and dielectric measurements are also explored.
I. INTRODUCTION
The induced polarization (IP) phenomenon was ob-served, perhaps as early as 1913, by French scientist Con-rad Schlumberger who was exploring electro-prospecting methods. Schlumberger noticed that if he passed a DC current through rocks containing metallic sulfides and abruptly turned off the current, the current through the rock would slowly decay like a capacitor. Until World War II, the IP phenomenon was studied primarily in the USSR where it was used for well logging and geophysical exploration. During World War II, the U.S. Navy, inde-pendent of Schlumberger’s work, utilized the concept to detect underwater mines, creating a pole like device with current and voltage electrodes and inputting a square wave current. Significant exponential decays correlated to the presence of mines that could be towed away[1]. Despite continued development, there are many poten-tial applications of induced polarization that have not yet been realized. It is feasible that the IP phenomenon might be used to discriminate between minerals and that IP measurements may be used to calculate physical prop-erties like porosity or clay content but these ends have proven to be difficult[1].
Both Schlumbergers observations and the mine detection method highlight two key features of the induced polar-ization effect. In both cases metal surfaces appear to store charges which are released after the charging pro-cess ends and produce a decaying current - essentially a capacitive process. Secondly, the mine detection method occurs in and around salty water where electrolytes are abundant. Indeed, when metallic materials are embed-ded in an electrolytic solution and impedance measure-ments are taken large dielectric signals are observed. Un-der the influence of an applied electric field ions accumu-late on the metallic surface creating image charges in the metal. This double layer of charges acts like a ca-pacitor. In addition, so called active ions might induce electrochemical interactions at the metal surface creat-ing diffusive currents that transport ions to the interface. Both effects are included in a theoretical description of the phenomena by Wong, leading to predictions which we attempt to validate experimentally. We study the com-plex impedance response of conductive particles that are embedded in an electrolytic background medium. Specif-ically, our goal is to determine the grain size dependence of the impedance response as well as dependences on
electrolyte conductivities and the volume of conducting particles. While similar studies have been undertaken[2] our work is the first where particle size, background me-dia and electrolyte conductivity are carefully controlled. Hopefully a greater understanding of the way that these parameters effect the IP phenomenon will help towards the yet unrealized applications of IP measurements.
II. THEORETICAL BACKGROUND
Peter Debye was the first to provide a general model for the dielectric relaxation of polar materials. Consid-ering noninteracting polar molecules, Debye found that the frequency dependent dielectric can be written as
(ω) =0−i00= 0−∞ 1 +iωτ0
(1)
where0 is the real component of the dielectric,00 is the imaginary component of the dielectric, 0 is the static
dielectric constant,∞ is the infinite frequency dielectric
constant andτ0 is the relaxation time of the medium [3].
(1) describes a dielectric dispersion where the real com-ponent of the dielectric constant changes from a high value, 0, at low frequency, to a low value, ∞ at high
frequency. The width of the dispersion is given by the relaxation time τ0. This relationship can be plotted on
what is known as an Argand diagram as a semicircle, where the real component is on the x-axis and the neg-ative of the imaginary is on the y-axis. For example, in water this transition occurs at 3GHz withτ0= 5.3·10−11s
Generally, experimental data, particularly that of liquids and low temperature solids, is flattened out compared to the Debye model, with a lower maximum complex com-ponent. Cole and Cole[4] built upon the work of Peter Debye and realized that experimental data could be fitted using an extra parameterαin the equation below
(ω) = 0−∞ 1 + (iωτ0)1−α
(2)
whereαvaries from 0 to 1. In this case, the Argand di-agram is a flattened semicircle.
models[5]. While they are useful, the Cole-Cole and sim-ilar models are only empirical and provide no insight into the physical behavior of the system.
While Debye and the Cole brothers were concerned with dielectric relaxation in liquids, Wong[6] developed a theory specifically for metallic particles in a dielec-tric medium. His description proves to be predictive and therefore can be tested in carefully designed exper-iments. We will attempt to summarize the key points of this model below. Consider a spherical, perfect con-ductor in an electrolytically conducting background with an applied voltage. The applied voltage causes the ions in the electrolyte to drift through the solution and charges within the perfect conductor to migrate similarly. Charges would like to pass between the conducting par-ticle and the solution but this is generally not possible, as bulky electrolytic ions like N a+ usually cannot per-meate the lattice of the material (such ions are known as inactive ions). As such, an electric dipole is induced on the conducting particle and nearby electrolytic ions sit on the boundary of the charge carrier because of the strong local electric field in what is known as a double layer. It is still possible for some electrochemical reactions to take place, where charges pass through the charged par-ticle electrolyte boundary (these ions are known as active ions) so that the conducting particles and their surround-ing charge layers can be thought of as somethsurround-ing like a leaky capacitor. Wong assumes that the concentration of active ions is much lower than that of inactive ions. Wong is able to model this system using almost ex-clusively classical electrodynamics and diffusive motion. The flux density of both positive and negative ions is taken to be the sum of a diffusion term and an electric field term
Jp=−Dp∇p+µppE (3)
Jn=−Dn∇n−µnnE (4)
wherepandnare the positive and negative charge pop-ulations respectively,µgives the associated mobility and D gives the associated diffusivity. Applying the continu-ity equation
∇ ·J =−∂ρ
∂t (5)
Wong applies (5) to (3) and (4) to get
∂p
∂t =Dp∇
2p−µ
p∇ ·pE (6)
∂n
∂t =Dn∇
2n+µ
n∇ ·nE (7)
Assuming a small electric field, p and n can each be thought of as a constant background plus a temporal and spatial perturbation. A similar equation is found
for the population of active cations and poisson’s tion is also considered for a total of four coupled equa-tions. The resulting algebra is fairly substantial and is solved with the help of Laplace transformations and sep-aration of variables, ultimately obtaining an equation for the dipole moment of a single charged particle of the form E(jω, a)a3 = E0a3f(jω, a) where jω is the
fre-quency variable, a is the radius of the particle, E0 is
an amplitude factor largely determined by the applied field andf(jω, a) is the frequency dependent reflection coefficient. This can be related to the conductivity of a system of charged particles in an electrochemical envi-ronment through the Maxwell formula
σe(jω)
σ0
=1 + 2vf(jω, a)
1−vf(jω, a) (8)
whereσeis the effective complex conductivity, σ0 is the
conductivity of the electrolytic medium andv is the vol-ume fraction of conducting particles of radius a. This formula can be easily extended to a distribution of par-ticles of different radii. The Maxwell formula neglects interactions between the charged particles, which is as-sumed to be a reasonable model for a volume fraction of conducting particles below 0.16. f(jω, a) is a substantial formula which depends on a number of parameters which are difficult to control experimentally, such as the con-centrations of active and inactive ions, cation and anion diffusivities and the rates of electrochemical interactions. It can be shown that
f(jω, a)→ −1
2 asω→0
which corresponds to the reflection coefficient of an insu-lator and
f(jω, a)→1 asω→ ∞
which corresponds to the reflection coefficient of a perfect conductor. Less rigorously, the leaky capacitor model supports this - at very high frequencies the capacitor branch acts as a short with no impedance, while at very low frequencies after an initial transient charges will only move through the resistive branch. The phase angle is expected to form a peak at a certain frequency and the location of this peak is predicted to depend on particle size.
It is important to note that Wong predicts the system to follow the Debye model in the absence of electrochemical reactions – that is, Wong attributes Induced Polariza-tion to electrochemical reacPolariza-tions. To test this theory, we attempt to experimental create a system without electro-chemical interactions.
III. EXPERIMENTAL
of at least 1250◦ C. Individual particles then have their surfaces modified to improve contact conductance[7]. The coke breeze was then sifted using a Gilson Company Performer III sifter. Samples were sifted 10 to 12 grams at a time at amplitude 9 with the tapper turned on for 24 hours. To ensure that appropriately sized particles ended up in the regions they needed to, particles were imaged using high vacuum scanning electron microscopy and images were analyzed using image analysis software ImageJ. The default algorithms for sizing particles were not particularly helpful as the coke breeze was similar in color to the carbon tape it was placed on, so the bound-aries of the particles were manually drawn on. As the particles were roughly elliptical, we looked at the feret diameter (the longest distance between any two points on the diameter) and the minferet (the smallest distance between any two opposite points on the diameter). A particle was thought to be successfully sifted if the feret diameter was greater than the lower bound on the size and the minferet was smaller than the upper bound on the size. For these sifter settings, virtually all particles ended up in the appropriate size bin.
FIG. 1. Gilson Company Performer III sifter. Sieves are ordered with coarse meshes at the top and finer meshes on the bottom. Sample is placed in the top sieve and secured. The gilson has both amplitude adjustable 60Hz vibrations as well as the tapper which operates at 1Hz.
The coke breeze was then mixed with 8µm silica spheres purchased from Angstromsphere. The silica spheres were chosen as our background material as they have a purely resistive behavior in the frequency regime of interest and are much smaller then our conducting par-ticles and appear to be homogenous under SEM imag-ing. The primary purpose of the background material is to hold the conducting particles in a location so that they are spread out throughout the cell. In our prelimi-nary measurements, we noticed that sometimes we could see small air bubbles on the wall of our electrochemical cell and that the presence of these bubbles corresponded to noisier data. Assuming that these corresponded to trapped air, as Angstromsphere confirmed that the sil-ica spheres were porous, we elected to place our samples
in a vapor chamber until they reached equilibrium (de-termined by the point at which the mass of our sample leveled off). Doing so we no longer observed the small air bubbles, so we elected to make this a part of our process. Our samples were wetted with 1mL N a2SO4 solution,
which was chosen for its stability, so as to hopefully pre-vent electrochemical reactions within the sample. Our impedance measurements were taken with a Gamry Interface 1000 and a custom cylindrical electrochemical cell. The cylindrical cell is made of 5 distinct pieces of acrylic with circular outer current electrodes and inner ring voltage electrodes with small slits cut out of the rings. The separation between the voltage electrodes is 12mm, while the separation between adjacent voltage and current electrodes is 8mm; the radius of the bore is 5mm. Measurements were taken from 1MHz down to 0.01Hz with 20 points per decade, in the potentiostatic mode with a 25mV AC signal. A 250g weight was placed on top of the cell to ensure good contact between the top current electrode and the sample.
FIG. 3. SEM images of 45-50 mesh coke breeze (top, 46x magnification) and silica spheres (bottom, 4150x magnifica-tion)
IV. DATA AND ANALYSIS
At each frequency, the magnitude of the impedance and the phase angle are measured, which is equivalent to measuring the the real and complex impedance. To extract a dielectric, we model our sample as a leaky ca-pacitor, that is a resistor and capacitor in parallel. It is much easier to analyze this circuit in terms of admittance rather than impedance.
Y = 1 Z = (
1
1
ZR+
1
ZC
)−1= 1
R +jωC (9)
By taking the imaginary component of the impedance and dividing by the frequency we can get the capacitance. Knowing that
C=0
A
d (10)
and the geometry of our cell it is simple to reach the dielectric constant. Similarly, we can use this model to determine the complex conductivity.
We begin with background measurements consisting of just the silica spheres and the appropriate concentration
of N a2SO4 solution. The background measurement
al-lows us to confirm that there is minimal variation in the phase response as a function of frequency and provides σ0 used in (8).
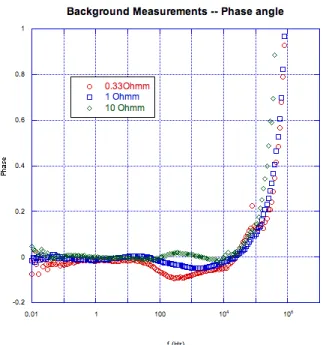
FIG. 4. Measurements of salt solutions with silica for dif-ferent frequencies. In the range from 0.01 to 10000Hz phase variations for the background are around 0.1◦or less, so they are small in comparison to the observed signals
Using 1Ωm N a2SO4solution we took 5 measurements
FIG. 5. Phase and dielectric response as a function of fre-qency for 3 distinct grain sizes of particles. We can see that the phase peak for smaller particles occurs at a higher fre-quency and a higher amplitude, as predicted by Wong, while larger particles exhibit a higher dielectric constant in the re-gion between 1 and 100Hz.
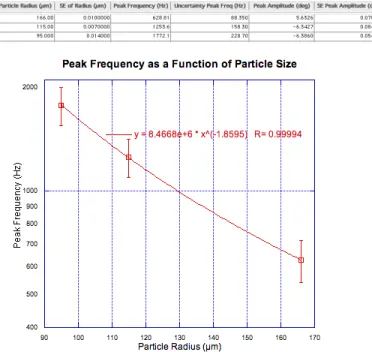
FIG. 6. Data for the relationship between peak frequency, peak frequency amplitude and particle size. In this size regime we can find a powerlaw relationship between particle radius and the peak frequency of the phase response.
FIG. 7. The ratio|σe(jω)
σ0 |. Wong predicts this behavior in
Fig. 3 of his paper[6].
Additionally, we plotted the normalized conductivity |σe(jω)
from the full equation for the complex reflection coeffi-cients.
To determine the effect of electrolytic concentration, data was also gathered for 0.33, 1, and 10Ωm N a2SO4
for 10% volume 80-100 mesh sample. Each measurement was taken 5 times and averaged, with error coming from the standard error. Although Wong does not explicitly state the effect of electrolytic concentration on the phase spectra, the concentration of the electrolytic background is observed to significantly affect the frequency of the phase peak.
FIG. 8. Phase response as a function of ionic concentration for 3 different ionic concentrations with 10% 80-100 mesh con-ducting particles. The phase peak moves to higher frequency for increasing salinity.
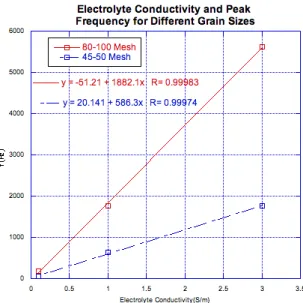
FIG. 9. Phase response as a function of electrolyte conductiv-ity for 3 distinct grain sizes of particles. Phase peak frequency is linearly related to conductivity.
FIG. 10. Their is a linear relationship between conductivity and peak frequency but, the linear relationship depends on particle size.
For comparison, single measurements were also taken for the effect of concentration at a grain size of 45-50mesh. Interestingly, we can see that the relationship between electrolyte conductivity and peak frequency do not appear to be the same for a different grain sizes, al-though both relationships are linear.
ionic solution. The raw phase data is shown in the plot below.
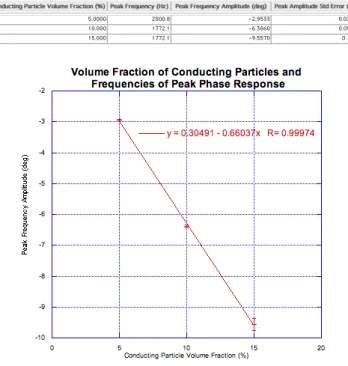
FIG. 11. Phase response as a function of the volume fraction of coke breeze in our samples. We can see that higher vol-ume fractions produce a higher amplitude phase respone, but we do not expect this effect to occur at much higher volume precents, as above the percolation threshold there will be di-rect conducting paths between the electrode, shorting out the polarization effect.
A linear relationship was found between the volume fraction of conducting particles and maximum phase re-sponse, which was agrees with Wong’s simulations (al-though Wong’s simulations were for samples between 2% and 8% conducting particles). As stated above, this can only be expected to be valid for some regime below the percolation threshold (that is the volume fraction at which, given a random mixture of nonconducting and conducting particles, we can expect to form long chains of conducting particles through the sample).
FIG. 12. A plot of the frequency of the phase peak for different volume fractions. This graph should have an intercept of 0, but there is a small background signal on the order of the experimental intercept.
FIG. 13. Normalized conductivity as a function of conducting particle volume for the same 80-100 Mesh sample with 1Ωm electrolytic background. This picture corresponds to Fig. 2 in Wong[6]
As before, we plotted the normalized conductivity to see how it is affected by particle volume. This time, higher volume fractions will have a larger ∞ and a
smaller0, as expected from (8), and all curves should
pass through a common point where the complex reflec-tion coefficient is 0 at |σe(jω)
frequency and low frequency and low frequency limits are slightly off from the predicted values, although their separation is roughly accurate.
V. SUMMARY
The peak frequency of the phase response was found to be given by the formula fpeak = 8.47·106+a−1.86
whereais the average conducting particle radius for val-ues of abetween 150 and 355 microns in 1Ωm N a2SO4
solution, roughly agreeing with Wong’s predictions for the presence of electrochemical reactions. The relation-ship between peak frequency and electrolyte conductiv-ity was determined to be linear, specifically fpeak =
51.21 + 1882.1σelec for 10% 80-100 mesh particles where
σelec is the electrolyte conductivity in units of mS, and
the relationship between the volume fraction of conduct-ing particles and peak frequency amplitude was also de-termined to be linear, in agreement with Wong’s electro-chemical model, for up to 15% conducting particles. The relationship between volume fraction and peak frequency amplitude was found to beApeak= 0.305−0.66vwhere
v is the percent of total volume taken up by conducting particles and Apeak is in degrees. Additionally, the
nor-malized conductivity behaved as predicted by the Wong model for varying particle size and particle volume frac-tion, although the limiting values were off.
Our results and Wong’s predictions fundamentally dis-agree. The most important extension of our work is to verify that there are no electrochemical reactions present
at the interface of the coke breeze particles. Hopefully, the presence or absence of electrochemical reactions can be determined through NMR measurements. We are also considering introducing an additive that will induce elec-trochemical reactions, to see in what way this will affect our measurements. Future work could extend to sizes on the order of 1 or 10µm. In this range, Wong predicts a change from inverse square proportionality to inverse proportionality between peak frequency and particle size. Unfortunately sieving Loresco Coke Breeze to get this size range is not viable as it takes much too long, but par-ticles acquired in another manner may have different sur-face chemistry allowing for more or less electrochemical reactions. Another area for future work is the interplay between solution conductivity and particle size. Rather than being independent, our results shows that the ef-fects appear interrelated. Further measurements could determine the nature of this interdependency. Similarly, there may be interplay between particle size and volume percent.
VI. ACKNOWLEDGEMENTS
Thanks to Patrick Doyle and Alfred Kleinhammes for their guidance, and to my committee members Jianping Lu and Louise Dolan for their time. This project was supported by the Gillian T. Cell Senior Thesis Research Award in the College of Arts and Sciences administered by Honors Carolina.
[1] H Siegel et al. The early history of the induced polarization method. The Leading Edge. 2007; 26(3): 312-321 [2] M Mahan, J Redman, D Strangway. Complex resistivity
of synthetic sulphide bearing rocks. Geophysical Prospect-ing. 1986;34(5): 743-768
[3] P Debye. Polar Molecules. 1929
[4] Kenneth S. Cole and Robert H. Cole. Dispersion and Ab-sorption in Dielectrics I. Alternating Current
Characteris-tics. The Journal of Chemical Physics. 1941; 9(341): 341-351
[5] A Jonscher. Dielectric relaxation in solids. Journal of Physics D: Applied Physics. 1999; 32: (R57-R70)
[6] J Wong. An electrochemical model of the induced-polarization phenomenon in disseminated sulfide ores. Geophysics. 1979; 44(7): 1245-1265