by
Nathan Alexander Page
A Masters Project submitted to the faculty of the University of North Carolina at Chapel Hill
in partial fulfillment of the requirements for the degree of Master of City and Regional Planning
in the Department of City and Regional Planning
Chapel Hill
2015
Approved by:
_____________________________________________________________See Hard Copy
TABLE OF CONTENTS
INTRODUCTION ... 3
RELEVANCE TO TRANSPORT POLICY OF URBAN FORM ... 6
URBAN FORM IN BANGALORE ... 7
THEORY OF INDUCED DEMAND AND IMPLICATIONS ON TRAVEL PATTERNS ... 7
Adoption of Personal Vehicles ... 9
DATA: THE 2014 BANGALORE HOUSEHOLD SURVEY ... 10
INCLUSION CRITERIA FOR ANALYSIS ... 10
SCOPE OF REVIEW ... 11
METHODOLOGY ... TESTING FOR MONOCENTRICY ... 12
McDonald’s Method ... 12
Dokmeci’s Method ... 15
DIFFERENCES IN TRAVEL PATTERNS BY GENDER ... 16
DIFFERENCES IN TRAVEL PATTERNS BY INCOME ... 19
Income and Travel Patterns... 21
DISCUSSION ... 21
1.MONOCENTRICY VERSUS POLYCENTRICITY IN BANGALORE ... 21
2.GENDER AND TRAVEL PATTERNS ... 22
3.INCOME AND TRAVEL PATTERNS ... 23
CONCLUSIONS ... 24
ACLNOWLEDGEMENTS ... 26
Many developing nations are currently faced with the challenge of designing and implementing transportation infrastructure and systems in the context of rapidly growing urban populations and constrained resources. Inappropriately designed transportation infrastructure has negative implications through increased emissions.1 Appropriately designed transportation infrastructure must be tailored to
the unique demands of a city, and respond appropriately to the differing demands of different kinds of urban form – e.g., monocentric or polycentric, require different transport practices. Energy demands in a monocentric city are larger per capita than those in a polycentric city (Figueroa 2014), adding to
increased emissions. As cities in India continue to develop, the facilitation of pedestrian and biking infrastructure may have the largest positive effect on emissions, especially in polycentric cities with several small self-supporting nodes. However, within monocentric cities, commutes are likely to be longer, in both time and distance, with a high percentage of the trips congesting the central area of the city.
With the rapid urbanization of India, there has been increasing consumption of transportation, transportation infrastructure, and natural resources. Some cities in the developing world have confronted this growth in demand through mass transit with high ridership, particularly in South America. As the cities in developing countries continue to grow, it is imperative that future infrastructure practices and policies focus on efficient methods and plans to proactively prevent the continued rise and sustained use of individual motorized vehicles (Chen 2011). The implications of comprehensive transit planning that understand the linkage between land use and transportation, will have significant effects on emissions in cities.
1
Currently, India’s per person emissions of carbon dioxide are one tenth that of the United
States. As such, the potential impact of increased motorization in a growing nation should not be
overlooked or underestimated, especially as the cycle of adoption of single-occupancy,
Comparable to other developing countries, traffic congestion is becoming an ever increasing problem in India. Trip times greater than an hour for distances less than five kilometers are commonly reported in commuter reports and assessments. Travel times greater than an hour are an indicator of increasing burdens on transportation networks, which results in decreased accessibility to services by commuters/residents. Problems caused by a lack of functioning and efficient transportation lines are exacerbated by the haphazard application of design and implementation of roadbuilding regulations. Bangalore has high levels of congestion throughout the day, made up primarily of private motorized transit, auto rickshaws, and buses. Besides inadequate planning and insufficient investment in viable public transit systems, a second reason for this congestion may relate to the misreading of a city’s urban form and the resulting misdiagnosis of its transport options that unknowingly and/or unintentionally result in the problems seen in most cities: increased private vehicle use, increased emissions, and a lower quality of life for the residents. For example, in a monocentric city, spending on pedestrian infrastructure could be the wrong choice if done on the outskirts, where the majority of trips are greater than one-mile. Conversely, in a polycentric city where hypothetical trip distances are less than one mile, spending on a mass transit system to move individuals further distances could also result in low ridership, and thus an increase in the per capita emissions (Tiwari, 2002).
In this paper I focus on Bangalore, India, a rapidly growing city that is a classic case study of
appropriate transportation choices?; 2) How do travel patterns differ by income. This question is central to understanding issues of access and the distribution of transportation burdens on different population segments; and 3) finally, a related question is about gender justice in transportation. How do Bangalore’s travel patterns differ by gender? This assessment will provide a detailed understanding and insight to develop appropriate transit investments in the future. Greater understanding of the differences across transportation needs and demands by gender and income will allow for better informed transport policy initiatives.
RELEVANCE TO TRANSPORT POLICY OF URBAN FORM
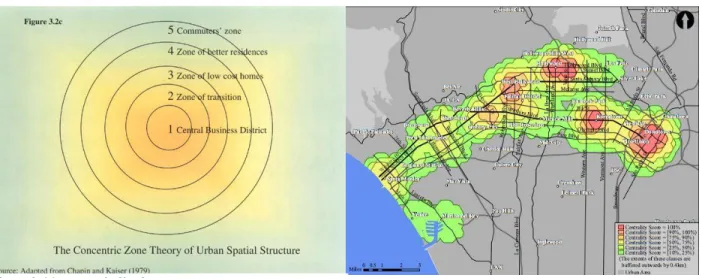
To understand the effects of infrastructure on commute patterns across city forms (e.g., monocentric versus polycentric), analysis of urban form is important. Urban form is defined by Warner (2014) as the spaces, places and boundaries that define city life, and is under transition in India. According to some estimates, 70% of the built environment that will exist in 2030 is yet to be built (McKinsey 2010). Urban form and transportation patterns are cyclical (Litman 2015). “Monocentric” urban form cities are typified as having a dominant Central Business District (CBD) (Figure 1). The Central Business District serves as a main location for jobs and commerce that encourages routine commuting from populations living in the surrounding environments. In this case scenario the majority of commuters
live in zones 3, 4, and 5. In a monocentric city, the transportation network facilitates commuting into the central city for the largest share of employees.
In a “Polycentric” city (Figure 2, Los Angeles), there are multiple nodes (areas) which serve as diverse business districts. Residents may commute to the closest node to their house thereby allowing for and encouraging shorter commuting distances. In a polycentric city, mass transit systems are feasible, however, their primary purpose shits to serve as a means to connect the business districts to commercial districts, which typically is a larger share of total trips.
When investigating travel differences in Dutch cities, Schwanen (2001) determined that the deconcentration of urban land uses, as seen in a polycentric city, results in an increased amount of non-motorized transit. With income distributions in Indian cities, polycentric form allows individuals to access, via walking, employment which they may otherwise not be able to afford because of transportation costs (Tiwari, 2002). Likewise, White (1988) determined that decentralizing employment reduced overall commute times, with residents tending to seek employment in spatial proximity to their residence.
The prevailing view in existing literature is that access to a CBD is best provided by a mass-transit network for the network to be efficient, likewise, a dominant CBD must exist for a high capacity transit system to be feasible. Therefore, the need for a more complete understanding of Indian cities is critical and immediate. If countries similar to India develop in the same manner as the United States, they would require twenty times more energy than currently consumed
(http://www.worldpopulationbalance.org/energy_india).
Thus, the literature studies commute patterns across city forms on the basis of the total time and distance for home-based work trips. In addition, cities in India are denser than their western
decreased commute times, decreased emissions, and reduced costs, than in comparably sized monocentric cities.
URBAN FORM IN BANGALORE
Bangalore has recently seen increased economic growth due to its role as India’s IT hub, resulting in the city’s population almost doubling in the past four decades, rising from less than two million
individuals in 1971 to more than ten million today. The adoption of cars, taken from the registration data, suggests that more than one-hundred times more automobiles were registered in Bangalore in each individual year for 2009, 2010, and 2011, when compared to all vehicles registered in the decade from 1986-1996. Individuals living in the region say that this number dwarfs in comparison to the adoption of motorized two-wheelers, a phenomenon common to the developing world. Travel choices are influenced by access to existing infrastructure and availability of access to transport (e.g., moped) (Bopp, 2013). Given the recent trends in increased access to motorized two-wheelers and registered automobiles, coupled with the growth in urbanization, construction, and transportation demands, Bangalore should adapt policies and practices that appropriately address Bangalore’s urban form and proactively address the potential impact from the unintended effects of emissions on quality of life.
Leading transport planners in India (e.g., Dinesh Mohan 2008, Geetam Tiwari) posit that “high ownership of motorcycles, [and the] non-availability of funds to build expensive grade separated metro systems and official plans encouraging multi-nodal business activity in… [cities] have resulted in the absence of dense high population Central Business Districts (CBD).” They argue that this has led to city forms which encourage a particular type of growth, which takes the “…form of relatively dense cities- within cities,” pushing the boundaries of urban agglomerations to swell to unsustainable scales.
patterns. Land use is not solely a function of transportation; transportation is also a function of land use (Rodriguez 2004). Because transit is a means to an end, a means of reaching a specific amenity or benefit (good or service) and not a good in and of itself, the expansion of transport networks can determine how effectively that amenity/benefit can be reached or whether the result will be costly congestion. A
comprehensive understanding of this symbiotic relationship is imperative to determining effective policies to mitigate adverse effects and develop proactive practices to minimize emissions.
From my field observations in Bangalore and conversations with local planners, it is clear that recent transportation decisions, such as the location of the airport, and zoning decisions that created the disconnected satellite cities of Whitefield and Electronic City, have contributed to sprawl. The distribution of economic activity throughout these zones has led to an increasing residential zone beyond the
traditional city center. Thus, the construction of gated communities on the urban periphery demonstrate sprawl that is already occurring. Lacking access to viable public transit, coupled with the distances to access amenities, the modal shares generated by the gated communities are dominated by the
automobile (EMBARQ India 2014). For example, buses and walking make up only 16% of trips originating in these Gated Communities, compared to 61% of all trips in the city of Bangalore, (Ibid). While the creation of polycentric job centers may reduce mean commute times, the lack of dense attractors, in the form of concentrated employment centers, results in reduced efficiency for high capacity metro transit in the future. The dominance of employment within a single ward over others would indicate that the connectivity to that node could be improved through mass transit. However, if no nodes dominate, the economic centers that do not have mass transit could end up subsidizing the centers that do.
THEORY OF INDUCED DEMAND AND IMPLICATIONS ON TRAVEL PATTERNS
the need for additional roads and therefore result in a negative feedback cycle in which the pedestrian environment is constantly eroded (Litman 2014). Many times, this leads to leapfrogged development and a lack of funds to pay for road maintenance and repair, a trend which is further worsened by the
additional traffic encouraged by the additional paved areas. In the case of India, Badami (2004) points out that the majority of funding goes to building freeways and flyovers that further fragment the urban fabric since they are difficult for foot-traffic to navigate. As mentioned previously, the cost for a single flyover can equal that of an inexpensive bus rapid transit (BRT) line.
Adoption of Personal Vehicles
The current trend in many developing countries is to engage in suburban development that is primarily accessible by personal vehicle (Mohan 2002). Further, this suburban development reinforces the adoption of the personal vehicle, which subsequently results in increased demand for high-speed roadways in the city. Lack of planning in these areas mainly because they fall outside of formal
jurisdictions has resulted in completely market based solutions, with huge externalities that cities in the developing world are just beginning to cope with. The impacts of sprawling development on the environment and on quality of life are only beginning to be understood, even in high income countries. Moreover, the capital required for remediating sprawling development is far more intensive than that required for the construction of centralized, compact, mixed-use development in the first place.
The intended and unintended increases in the production of additional personal vehicle trips is of growing concern in many Indian cities, where the largest increase in building activity is occurring on the urban fringe in the form of gated communities (EMBARQ 2014). As Schnore anticipated in 1959, “… downtown congestion would be relieved, [but] the growth in cross-hauling could eventually overwhelm suburbs with traffic.” This congestion is already occurring in many Indian cities, leading to increased time in transit for public transit and individual private transit, as well as increased walk times due to the disruption of a pedestrian network created by flyovers inside the city.
When coupled with the disruption to the pedestrian routes experienced by a grade-separated interchange, as well as the subsequent high-speed pedestrian collisions that frequent these structures, a need for solutions tailored to the Indian context is evident. This is also corroborated by Sabapathy (2012), who states that Bangalore should make “investments for transportation infrastructure and transportation policy… directed towards encouraging public transport, walking and non-motorized transport, rather than the sole development of roadway infrastructure that primarily caters to personalized modes of high-income commuters.” In the context of India, the largest observed need for transportation infrastructure and planning relates to multi-modal connections tailored to the predominate mode – walking (Badami 2004, EMBARQ 2014).
DATA AND ANALYSIS: THE 2014 BANGALORE HOUSEHOLD SURVEY Inclusion Criteria for Analysis
comparison with a proposed dominant employment node. I propose two methods for testing the monocentricy of Bangalore, as explained below. However, due to the survey targeting structures, all slums were excluded from analysis. This comprehensive dataset was supplemented further by a 445 household survey done in gated communities throughout the city. The gated community survey gathered many of the same questions as addressed in the Bangalore Household Survey, and are therefore able to be used to draw comparisons between the two. Together these datasets allow us to better understand the current urban form and transportation choices and patterns of Bangalore residents. During 2014, I worked firsthand with the Bangalore Household Team, and was involved in reviewing and analyzing spatial distributions of transportation patterns, as well as differences across gender and income, to understand the contribution of urban form to transit in developing countries.
Scope of Review
do not help in reduction of private vehicle use, congestion or pollution.” However, if a city is
monocentric, with the major traffic attractor in a centralized location, the value added by mass transit lines increases. As such, a misdiagnosis of the city structure negatively affects the design and allocation of transportation infrastructure and landuse policies. As India continues to grow into the world’s most populous country, this effect has the potential to drastically impact emissions, energy consumption, land use, and transport requirements for the future.
TESTING FOR MONOCENTRICY
In order to address the issues of urban form in Bangalore, I will apply two different methods to test for monocentricy. Due to data restrictions, I am not able to use methods which include employment, and thus will use McDonald’s 1987 method, as well as Dokmeci’s 1994 method. While the applications of these methods are less than ideal, the model that they present should allow us to accurately define Bangalore as mono- or polycentric.
McDonald’s Method
In 1987, John McDonald created a method to test for employment subcenters in “The Identification of Urban Employment Subcenters” published in the Journal of Urban Economics. McDonald created concentric rings around the Loop in Chicago, and tested for differences in travel patterns.
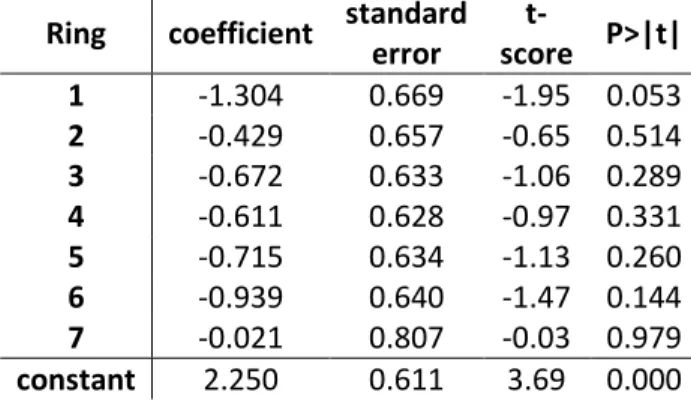
My model (table 1), a linear regression of the average travel time from each ring, explained less than two percent of the variation in travel time (Adj R-squared = 0.0197).
Table 1: Linear Regression of the Average Travel Time by Ring
Ring coefficient standard error
t-score P>|t|
1 -1.304 0.669 -1.95 0.053
2 -0.429 0.657 -0.65 0.514
3 -0.672 0.633 -1.06 0.289
4 -0.611 0.628 -0.97 0.331
5 -0.715 0.634 -1.13 0.260
6 -0.939 0.640 -1.47 0.144
7 -0.021 0.807 -0.03 0.979
constant 2.250 0.611 3.69 0.000
Due to the homogeneity between transport patterns within the wards, as well as the low value of R-squared, this model suggests that the rings themselves, and thus the distance from the geographical city center, does not influence travel times. However, there is some indication that travel times are significant (P > 0.053) in the first ring- namely, the urban core. This may, however, simply be a result of the job/housing balance in the location, rather than a reflection of the form. As such, if employment data by ward are available in the future, a more rigorous application of McDonald’s method is warranted.
system does not increase accessibility for those who need it most, and should be abandoned in favor of one comprehensive bus network.
Dokmeci’s Method
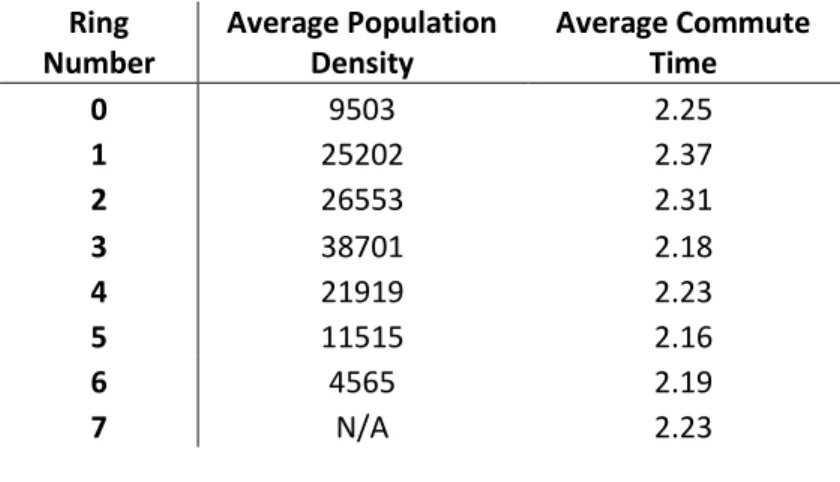
In 1994, Dokmeci and his team tested for monocentricy in the city of Istanbul. They had hypothesized that the population growth on the peripheral districts led to subsequent employment growth in the same, resulting in a more polycentric city. This was envisaged as a result of Istanbul becoming so large that “due to agglomeration diseconomies, a monocentric urban structure could no longer prevail.” If the same effects are seen in Bangalore, one can presume that the threshold has been exceeded wherein transportation patterns have forced the city to shift to polycentricity. While Dokmeci used a three part method, involving volume of paper mail, employment levels per district, and commute times, I used only the commute times, since the mail volumes and employment levels were not available at the same level of analysis.
Table 2: Average Commute Time by Ring
Ring Number
Average Population Density
Average Commute Time
0 9503 2.25
1 25202 2.37
2 26553 2.31
3 38701 2.18
4 21919 2.23
5 11515 2.16
6 4565 2.19
7 N/A 2.23
t-stat= 0.576, p-value= 0.586). The rings used in this analysis were defined above in figure 4. While this method misses where the employment centers are located, the extrapolation of average commute time by ring from the CBD reinforces the earlier findings, suggesting that Bangalore is polycentric. The fact that this is independent of the population densities could be an indicator of a poor alignment between jobs and housing available in the city.
The second range for travel time (table 2) was between 15 and 30 minutes per one-way trip, which indicates that the average commute in the city is potentially short enough to be shifted to a less energy intensive use. Table 3 below shows us that the majority of these trips are being made by walking, BMTC busses, and two-wheelers. While two-wheelers increase accessibility, their inherent danger may not be the best fit for the chaotic road network that exists in Bangalore. As such, an increase in the provision of public transit, and additional provision of safe non-motorized networks could be a good fit for these short-duration trips.
DIFFERENCES IN TRAVEL PATTERNS BY GENDER
The literature indicated that women generally have less time to spend in traveling, due to their need to fulfill familial responsibilities within the household. As such, the accessibility for the same household will generally be higher for males than for females, in the context of Bangalore. This results in a mismatch which planners and policy makers should consider when they are recommending
In the survey, displayed in table 3 below, a Pearson chi-square test indicated that travel mode differs by gender (χ2 = 409.79, p<0.001). The largest differences were in women being less likely to travel via two-wheeler (34 % of male trips vs. 10 % of female trips), and more likely to walk (24% of male trips vs. 46% of female trips). Time spent traveling also differed by gender (χ2 = 99.47, p<0.001), with females traveling shorter durations than males, particularly in the Less than 15 Minute category, with 29% of men, but 40% of all female trips. Women (39% of trips) are also more likely to ride public transit than men (34% of trips), which results in an uneven negative impact from poor public transit for female commuters. When investigating Travel Time by gender (figures 5 and 6), males travel at least as long as females do for every ward, with the exceptions being Jakkuru (n=63, female=18), which is located to the north of town and Prakash Nagar (n=38, female=8), near MG Road. This analysis indicates that while travel times differ by gender, it appears that females are traveling for shorter durations than their male counterparts.
In summary, I have determined that travel patterns in aggregate are vastly different for women and men in the city of Bangalore. As mentioned above, this is an important consideration for future transit provision. These effects are not only prevalent across mode, but also across travel time, which when taken together restrict accessibility for women in the developing world more than for their male counterparts.
Table 3: Travel time by Mode and Gender
Male (P<0.001)
Auto Bicycle BMTC Bus Car Company/School Bus Other Taxi Two-Wheeler Walking Grand Total
Less than 15 Minutes 0.96% 0.29% 2.06% 0.26% 0.91% 0.42% 0.05% 8.07% 15.77% 28.78%
15-30 Minutes 0.99% 0.73% 8.90% 1.35% 2.58% 0.29% 0.08% 14.60% 7.68% 37.18%
30-45 Minutes 0.10% 0.21% 8.35% 0.65% 1.01% 0.10% 0.03% 7.47% 0.57% 18.50%
45- 60 Minutes 0.00% 0.03% 4.22% 0.31% 0.78% 0.10% 0.00% 2.76% 0.10% 8.30%
More than 1 hour 0.60% 0.00% 4.03% 0.13% 0.70% 0.21% 0.03% 1.48% 0.05% 7.23%
GrandTotal 2.65% 1.25% 27.56% 2.71% 5.98% 1.12% 0.18% 34.37% 24.17%
Female (P<0.001)
Auto Bicycle BMTC Bus Car Company/School Bus Other Taxi Two-Wheeler Walking Grand Total
Less than 15 Minutes 1.30% 0.14% 1.73% 0.29% 2.02% 0.58% 0.00% 3.47% 30.92% 40.46%
15-30 Minutes 1.66% 0.22% 11.27% 0.87% 4.91% 0.07% 0.00% 4.55% 13.58% 37.14%
30-45 Minutes 0.29% 0.07% 8.89% 0.29% 1.45% 0.00% 0.07% 1.23% 0.94% 13.22%
45- 60 Minutes 0.00% 0.00% 5.20% 0.07% 0.87% 0.00% 0.00% 0.22% 0.14% 6.50%
More than 1 hour 0.00% 0.00% 1.73% 0.00% 0.51% 0.00% 0.00% 0.43% 0.00% 2.67%
DIFFERENCES IN TRAVEL PATTERNS BY INCOME
As gender was determined to be important above, demonstrated by the divergent travel patterns of females and males, income may also play a role in the accessibility an individual experiences. Thus, an investigation of travel patterns by income levels can contribute to our understanding of deficiencies and unintended consequences of established transportation networks.
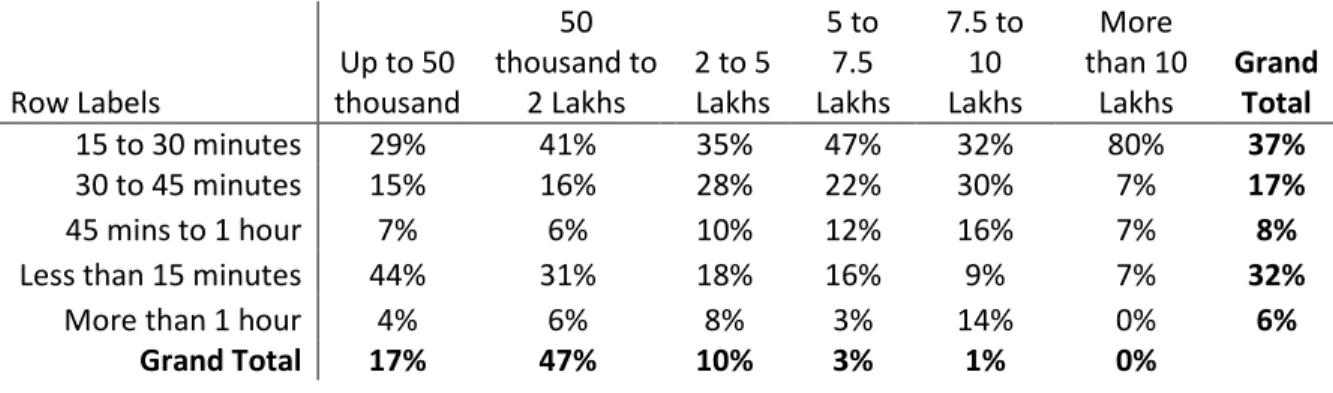
A regression of Travel Time on Income using the logarithmic transformation of each of these variables allows for calculation of elasticity and indicates that for each 22% increase in income, there is a corresponding 15-minute increase in travel time. Thus, in the Bangalore Household Survey, as wealth increases, the distance traveled increases (P<0.001) (Table 4). However, income explains only 3% of the variation in travel time (adjusted R-squared = 0.03), indicating that there are potentially other variables that have much higher predictive value than income. This reinforces the findings previously discussed and highlights how income is linked less with travel patterns in India than in the western context.
Table 4: Commute Time by Income
Row Labels
Up to 50 thousand
50 thousand to
2 Lakhs
2 to 5 Lakhs 5 to 7.5 Lakhs 7.5 to 10 Lakhs More than 10 Lakhs Grand Total
15 to 30 minutes 29% 41% 35% 47% 32% 80% 37%
30 to 45 minutes 15% 16% 28% 22% 30% 7% 17%
45 mins to 1 hour 7% 6% 10% 12% 16% 7% 8%
Less than 15 minutes 44% 31% 18% 16% 9% 7% 32%
More than 1 hour 4% 6% 8% 3% 14% 0% 6%
Figure 7: Travel Time by Income
When Travel Time is regressed on Income stratified by bracket, however, all P values exceed 5%, indicating that a finer gradation than above or below the median household income is not statistically significant. This may be a result of the lack of predictive power of income on travel time in the Indian context, or a result of the wide variation in size of each income bracket (i.e., only 5% of the surveyed population fell within the highest three income brackets).
DISCUSSION
1. Monocentricy vs Polycentricity in Bangalore
Given that both of our methods indicated a lack of monocentricy within the city of Bangalore, I determined that the city is, in fact, polycentric. This results in a mismatch between the ongoing Bangalore Namma Metro project and what current transportation practice suggests fits best with the spatial
structure of the city of Bangalore. While metro may be the best solution for cities with dominant central business districts, this is quite unlikely to be the case here. As such, provision to increase the current metro beyond the existing footprint should no longer be investigated.
2. Gender and Travel Patterns
Researchers have found important differences across gender for both travel time and mode. As Anand and Tiwari (2005) wrote, “women spend more time traveling on slower modes of transport.” The quality of life implications for low-income households with both parents working are worthy of
consideration for planners in all fields. While in the past, women found ways of accessing work near their homes (Anand 2005), as impoverished Indian households are forced to the edges of cities though
programs similar to Urban Renewal in the U.S. (Anand 2005, Doshi 2012), their increasing travel times reduce time for reproductive, productive, and leisure activities. Due to the share of reproductive
responsibility placed on women, and the mode shares in which they engage, women “will only find work within 1 hour of commuting time” (Anand 2005). As Anand also addresses, a lack of mobility “causes poverty by affecting [women’s] access to livelihood opportunities.”
The public transport facilities in India have been reported as being “…insufficient and dismal” (Ashalatha 2013). Ashalatha reports that women in Thiruvananthapuram prefer buses even over cars. This disparate impact is especially important in locales where women are increasing their involvement in the professional workplace, and require higher degrees of accessibility in order to meet all of the
between mode shares (Anand 2005). Because of the effect of gender on travel patterns, the need to understand how woman are using the transportation network in Bangalore is also important.
3. Income and Travel Patterns
Accessibility to employment has been linked to income levels (Nelson 1992). As such, the
transportation infrastructure in a city should be designed in such a way that individuals can access the employment opportunities which match their skill sets. In an autocentric American context, this almost requires every worker to have a personal vehicle, while in the Indian context, it frequently requires the residence be within a walkable distance. Because of this locational requirement that is specific to income levels, further investigation of travel patterns by income is warranted.
Transportation patterns are especially important in lower income cities, where the costs of transport are frequently a higher percentage of personal wealth. In parts of India, up to 50% of the employed population report no commuting expenses, reinforcing the large modal share of walking (Anand 2005). Like this analysis, past studies have been based upon cross-sectional studies, and thus deserve reanalysis in a rapidly urbanizing region, which is currently building transportation networks. As indicated elsewhere in the literature (Chen 2011) perhaps more important than cost is the amount of time that is spent traveling for households with above average incomes. However, some authors report a bias towards a car culture, with the private vehicle being a symbol of privilege (Ashalatha 2013, Kim 2014.)
confirms a premise previously set forth by Tiwari and Singh (1980), finding that bus-riders from the outskirts of Delhi with low monthly incomes spend more than 25% of their income on daily commuting. This quantification of travel time is very important for a city’s future growth and has never been
calculated for Bangalore.
CONCLUSIONS
Using a unique travel behavior dataset for Bangalore this paper tested for differences in travel patterns by household location, gender, and income. I found that Bangalore has become a polycentric city, with transportation patterns across the city appearing to be independent of distance from the hypothesized geographical center. As a result of this polycentricity, transportation design, pedestrian network allocation, and potential delegation of the bus network as a feeder to the metro system should be further investigated.
As demonstrated above, women are more likely to have a shorter commute, and less likely to travel by personal motorized vehicle. As such, the transportation demands placed on the network by women are vastly different from those of men. Neglect of the bus network will disproportionately affect women, as will a lack of investment in safe pedestrian paths. Investment in these two areas will not only result in a higher level of accessibility for those who currently use them, but can draw individuals from more resource-intensive modes of transit (Chen 2011).
notable exception of walking trips for the subjects in the lowest two income brackets, whose trips made up 84% of our sample! As a result, the largest positive effect for low-income populations in Bangalore would be investment in a safer, more highly-connected pedestrian network. However, given that the prevalence of Bangalore Metropolitan Transport Corporation (BMTC) bus trips by both income brackets was significant (28%), increased spending on a bus network would also greatly improve mobility for the urban poor.
For a developing country, where there are still large mode shares in public transit and walking, appropriation of funding for transit that serves the majority of the people rather than the automobile owners would appear to better meet the goals of transit planners in Bangalore. The findings of this report indicate that more consideration should be given to modes of transit other than the automobile,
particularly walking. Additionally, spending on the provision of a bus network providing public access has the potential to stave off much of the adoption of motorized two-wheelers (Chen 2011). While this investment is likely to be expensive, the alternatives require greater road networks as well as an increased consumption of fuel by individual motorized transit and potentially a greater consumption of time due to increased rates of congestion.
If Bangalore continues to evolve many cities within a city, the metro will not be a viable solution, and even BRT will be difficult to properly fit into the urban fabric, being both too expensive to create new lines as well as lacking clear destinations which would result in low ridership. However, the strengthening of the sidewalk network for short trips as well as increased spending on a comprehensive bus network, increasing both frequency and coverage, will allow for the large number of relatively short trips (less than 30 minutes) to be accomplished with the least congestion, emissions, and expense. If Bangalore chooses not to address the transportation needs of the city, it will continue to require additional roadways to keep up with the exponential growth in private motorized transit, particularly motorcycles and motor scooters. In short, the current path leads towards additional emissions per capita, and an urban fabric which requires individual transit to access amenities.
ACKNOWLEDGEMENTS
I would like to thank my new wife, Kristen Rogers Page, for putting up with me throughout the writing process, and tirelessly reading through my drafts. Dr. Meenu Tewari for showing an amazing amount of support and feedback for each step of the master’s project. And my family, for showing financial, emotional, and physical support throughout the graduate school experience; especially my grandfather, Joseph Page, and my little sister, Rachel Page.
Works Cited
Ahlfeldt, G.M., Wendland, N. 2012. How polycentric is a monocentric city? Centers, spillovers and hysteresis. Journal of Economic Geography. Issue 13, pp. 53-83
Anand, A., Tiwari, G. 2006. A Gendered Perspective of the Shelter-Transport-Livelihood Link: The Case of Poor Women in Delhi. Transport Reviews, Volume 26, No. 1, pp 63-80.
Ashalatha, R., Manju, V.S. Zacharia, A.B., 2013. Mode Choice in Behavior of Commuters in
Thiruvananthapuram City. Journal of Transportation Engineering, Volume 139, No. 5, pp. 494-502.
Badami, M., Tiwari, G., and Mohan, D., 2004. Access and Mobility for the Urban Poor in India: Bridging the Gap between Policy and Needs. Paper Presented at the Forum on Urban Infrastructure and Public Service Delivery for the Urban Affairs, Delhi, India.
Bopp, M. Kaczynski, A.T. Campbell, M.E., 2013. Health-Related Factors Associated with Mode of Travel to Work. Journal of Environmental and Public Health. Volume 2013, Article ID 242383, p 9.
Cervero, R. 1988. America’s Suburban Centers: A Study of the Land Use-Transportation Link. Office of Policy and Budget, U.S. Department of Transportation. Chapter 4, Classifying Suburban Employment Centers, pp. 53-74.
Chen, C., Lai, W. 2011. The effects of rational and habitual factors on mode choice behaviors in a
motorcycle-dependent region: Evidence from Taiwan. Transport Policy, Volume 18, pp. 711-718. Dokmeci, V., Berkoz, L. 2007. Transformation of Istanbul from a monocentric to a polycentric city.
European Planning Studies. Volume 2, Issue 2, pp. 193-205.
Doshi, S. 2012. The Politics of the Evicted: Redevelopment, Subjectivity, and Difference in Mumbai’s Slum Frontier. Antipode, Volume 24, Number 4, pp. 844-865.
Dimitriou, H.T., Gakenheimer, R. 2011. Urban Transport in the Developing World: A Handbook of Policy and Practice. Edward Elgar Publishing, Inc. Northampton.
EMBARQ India. 2014. Relationship between Built Form, Travel Behavior and Energy Use in Gated Communities in Bangalore. Embarq India Hub, Retrieved 2/1/2015 at
http://embarqindiahub.org/sites/default/files/DOE%20-%20%20%20Built%20Form,%20Travel%20Behavior%20%26%20Energy%20Use%20in%20Gated% 20Communities%20in%20BGL%20-%20Final%20Report%20-%20Oct%202014.pdf
Energy Consumption: India. Nd. World Population Balance http://www.worldpopulationbalance.org/energy_india
Ewing, R., Cervero, R., 2010. Travel and the Built Environment. Journal of the American Planning Association, Volume 76, Issue 3, pp. 265-294.
Fatima, E., Kumar, R. 2014. Introduction of public bus transit in Indian cities. International Journal of Sustainable Built Environment. Volume 3, pp. 27-34.
Figueroa, M. et al. 2014. Energy for Transport. Annual Review of Environment and Resources. Volume 39, pp. 295-325.
Frank, L., Bradley, M., Kavage, S., Chapman, J., Lawton, T.K., 2007. Urban form, travel time, and cost relationships with tour complexity and mode choice. Transportation, Issue 35, pp 37-54.
Goel, R. Guttikunda, S. K., Mohan, D., Tiwari, G. Benchmarking vehicle and passenger travel characteristics in Delhi for on-road emissions analysis. 2014. Travel Behaviour and Society. Retrieved 1/9/2015 at
doi:10.1016/j.tbs.2014.10.001.
Gordon, P., Kumar, A., Richardson, H. 2006. Gender Differences in Metropolitan Travel Behaviour. Regional Studies. Volume 23, Issue 6, pp. 499-510.
Hanson, S. 2010. Gender and Mobility: New Approaches for Informing Sustainability. Gender, Place & Culture: A Journal of Feminist Geography. Volume 17, Issue 1, pp. 5-23.
Kim, C., Wang. S. 2014. Empirical Examination of Neighborhood Context of Individual Travel Behaviors. Applied Geography. Pp. 1-10.
Litman, T. 2015. Land Use Impacts on Transport: How Land Use Factors Affect Travel Behavior. Victoria Transport Policy Institute. Retrieved 2/1/2015 from http://www.vtpi.org/landtravel.pdf. Litman, T. 2011. Generated Traffic and Induced Travel: Implications for Transport Planning. Victoria
Transport Policy Institute. Retrieved 11/05/2014 from http://www.vtpi.org/gentraf.pdf. McDonald, J. 1987. The Identification of Urban Employment Subcenters. Journal of Urban Economics.
Volume 22, Issue 2, pp. 242-258.
McKinsey Global Institute. 2010. India’s Urban Awakening: Building Inclusive Cities, Sustaining Economic Growth. Retrieved 2/1/2015 from
http://www.mckinsey.com/~/media/McKinsey/dotcom/Insights%20and%20pubs/MGI/Research/ Urbanization/Indias%20urban%20awakening%20Building%20Inclusive%20Cities/MGI_Indias_urb an_awakening_full_report.ashx.
Mohan, D., Tiwari, G. 2000. Mobility, Environment and Safety in Megacities: Dealing with a Complex Future. Transport and the Environment. Volume 24, Issue 1, pp. 39-46.
Mohan, D. 2002. Road Safety in Less-Motorized Environments: Future Concerns. International Journal of Epidemiology, Issue 31, pp 527-532.
Mohan, D. 2008. Mythologies, Metro Rail Systems and Future Urban Transport. Economic and Political Weekly. Volume 43, No. 4, pp. 41-53.
Nelson, A.C. 1992. Effects of Elevated Heavy-Rail Transit Stations on House Prices with Respect to Neighborhood Income. Transport Research Record, Issue 1359 pp. 127-132.
Pucher, J., Korattyswaropam, N., Mittal, N., Ittyerah, N., 2005. Urban Transport Crisis in India. Transport Policy, Issue 12, pp. 185-198.
Rahul, T.M., Verma, A. 2013. Economic Impact of non-motorized transportation in Indian cities. Research in Transportation Economics. Volume 38, pp. 22-34.
Rodriguez, D. A., 2004. The relationship between non-motorized mode choice and the local physical environment. TRR. Volume 9, Issue 2, pp. 151-173.
Sabapathy, A., Flachsbart, P.G., Saksena, S. 2011. Commuting patterns of employees in the Information Technology and traditional manufacturing sectors of Bangalore, India. Transport Policy. Volume 19, pp. 155-166.
Schwanen, T., Dieleman, F.M., Dijst, M. 2001. Travel behavior in Dutch monocentric and polycentric urban systems. Journal of Transport Geography. Volume 9, Issue 3, pp. 173-186.
Singh. S. L., Tiwari, B.M.L., Gupta, V.K. 1980. Common Fixed Points of Commuting Mappings in 2-Metric Spaces and an Application. Mathematische Nachrichten. Volume 95, Issue 1, pp 293-297. Srinivasan, S. 2005. Influence of Residential Location on Travel Behavior of Women in Chennai, India.
Transportation Research Board of the National Academies- Volume 2: Technical Papers, pp. 4-14. Srinivasan, S. 2005. Linking land use and transportation in a rapidly urbanizing context: A Case Study in
Delhi, India. Transportation. Volume 32, pp. 87-104.
Thynell, M., Mohan, D., and Tiwari, G., 2010. Sustainable Transport and the Modernization of Urban Transport in Delhi and Stockholm. Cities, Volume 27, Issue 6, pp 421-429.
Warner, S.B., Whittemore, A. 2012. American Urban Form: A Representative History. Cambridge. The MIT Press.
White, M.J. 1988. Location choice and commuting behavior in cities with decentralized employment. Journal of Urban Economics. Volume 24, Issue 2, pp. 129-151.