Taylor G. Abernethy. Assessing the State of Metrics Demonstrating Value in a
Government Special Library. A Master’s Paper for the M.S. in L.S degree. November, 2016. 37 pages. Advisor: Rebecca Vargha
Libraries regularly collect statistics in order to understand and communicate the value of products and services to stakeholders. These statistics, also known as metrics, can incur quantitative or qualitative data and can fall into one of five categories: input measures, process measures, output measures, outcome measures, or impact measures. Outputs, such as the number of books circulated or attendees to a webinar, are the most common, but outcomes, such as how a class helped streamline a patron’s workflow, are the most desired. The monthly statistics collected in a government special library were gathered and classified according to their conformity to one of these types of performance measures. The library collected the most output metrics, followed by inputs, then outcomes. While metric diversity is beneficial, suggestions for how to improve the evaluation procedures and gain more outcomes and impacts are discussed.
Headings:
Special libraries -- Evaluation Government libraries
ASSESSING THE STATE OF METRICS DEMONSTRATING VALUE IN A GOVERNMENT SPECIAL LIBRARY
by
Taylor G. Abernethy
A Master’s paper submitted to the faculty of the School of Information and Library Science of the University of North Carolina at Chapel Hill
in partial fulfillment of the requirements for the degree of Master of Science in
Library Science.
Chapel Hill, North Carolina November 2016
Approved by
Table of Contents
Introduction ... 2
Literature Review... 7
Methods... 16
Results ... 20
Discussion ... 23
Implications and Limitations ... 26
Introduction
Many years ago, a scientist would enter the special library of a research organization and ask a specific question, such as “what is the atomic mass of element X?” The
librarian would walk over to the reference section, pick up the “Big Book of Elements,” and locate a number for the researcher. This would be one reference question tally mark on the statistics clipboard (Orr, 1973). These days, the same scientist would send a chat query, asking about all of the methodologies currently used in research studies involving factor Y and factor Z published in the last 10 years. The librarian will spend multiple days searching databases, compiling articles on the topic, and formatting a bibliography for the patron. This might also be recorded as one reference question (Oberg, 2011). Things have changed in the way reference interactions and other library services are conducted. Many patrons are capable of finding their own resources online to
accommodate research needs for ready reference questions. Libraries are finding new ways to remain valuable to patrons by updating services to incorporate emerging technologies and working on the more in-depth inquiries. An unchanging aspect is the need to record statistics documenting interactions with patrons, and the need to provide those statistics to stakeholders and decision makers.
order to ensure the best picture of value is being displayed, evolving activities and needs must be reflected in modern metrics tailored to fit a special library’s offering.
The study of library value is not new; it has been constantly revisited through the years. The first challenge is how to define value, and another obstacle is how to measure it. Generally, value refers to the potential or perceived benefit, importance, or preciousness of something (Poll, 2003, p. 5). But in this case, the true meaning of value should be embedded within the context of the library under analysis, where the defining
characteristics are a reflection of the institution itself (Town, 2011). In order to decipher what determines value for an institution, the organization must be dissected.
The Environmental Protection Agency’s Research Triangle Park Library is a
federally funded special library serving scientists, researchers, and other employees both locally on campus and virtually. The library’s physical collection is composed largely of older print journals and a small monograph assemblage focused primarily on
environmental science concepts. The library is also a repository for air-related documents published by the EPA. The most heavily used resources are the electronic journal subscriptions. Many patron interactions involve supplying users with PDF’s from the subscriptions or through interlibrary loan. The EPA-RTP Library also staffs a reference desk and supports researchers with virtual and face-to-face reference services, instructional classes, and literature searches. Additionally, librarians field phone calls and emails from the public during operating hours.
Other examples include how libraries facilitate value-added activities to resources, save the organization space and enormous amounts of time, and provide exceptional customer service (Baldwin, 2002). Instead of having goals concerning education, special libraries are valued for their direct focus on assisting the patron and organization through the delivery of services and products (Murray, 2013).
Each library participates in value-added activities that can be evaluated for their contributions to both users and the parent organization and might not be best
communicated using counts compiled at the end of the month. In the EPA-RTP Library, activities contributing to value and patron interactions are multidimensional. Scientists are busy and rely on the library to fulfill time-consuming services such as document delivery and literature searches. Regular metrics like door totals or numbers of books circulated are not the most important exchanges and are therefore not as relevant when investigating the library’s worth. What might be more useful are stories of user
experiences translating the time or financial savings services provided for patrons and how users were able to expend effort on matters more directly related to their work (Dalton, 2012; Oakleaf, 2010; Scotti, 2010).
special library activities such as quick and in-depth reference transactions, literature searches completed, and instructional classes taught are displayed solely as quantities, an important part of the story may be missed. These numerical evaluations will not have the same effect on managers’ recognition of value as would other more explanatory methods (Haswell, 2012).
The metrics typically called for in this type of assessment have experienced changes as the field has seen a centering on user outcomes, an influx of available online
resources, and increasingly stressed budgets (Hiller, 2012; Murray, 2013). Just as there has historically been a shift to examining qualitative user outcomes in libraries, there has been a shift toward deriving qualitative measures to supplement quantitative metrics (Ard, 2012; Bowlby, 2012). Matthews (2002) addresses evaluating deeper processes by assessing performance outcomes and subsequent impacts on the organization.
Performance outcomes and impacts refer to the effects a library has on its users and the organization through its services (Hiller, 2012). Even so, stakeholders rely on concise quantitative reports in order to make important organizational decisions. The challenge then is to collect metrics accurately demonstrating the unique services and valuable work performed while meeting the needs of managers (Ard, 2012). Balancing this combination is essential for a library’s message of value to be accurately and effectively communicated.
progressive librarians re-examining operational value methods need to ask questions such as “is this method the best?” and if the organization compares well to others who are similar. The EPA-RTP Library is in need of such an inquiry. A qualitative audit of the library’s evaluation procedures will allow for an in-depth examination of the current metrics’ ability to convey the library’s value to managers. This case study investigates the efficiency of evaluation design using the following research questions:
• What does the literature suggest as being important for value measurement in special libraries?
• What are the current statistics collected at the EPA-RTP Library?
• How are these metrics being compiled for managers?
Literature Review
One way to assess a library’s transmission of value is by identifying the
measurements and metrics used to examine its resources, services, and influence. These metrics are derived from the value-added activities occurring in libraries and are used to communicate accountability (Dugan, Hernon, & Nitecki 2009). They can be
quantitative, qualitative, or a combination of methods (Tenopir, 2013), and their format can be an influential factor when deciding which metric is better reflective of the information need. Each statistic and measure has its pros and cons, which is why a combination of both quantitative and qualitative metrics best communicates the library’s message of value (Hales, 2012).
A collection of statistics transforms into informative library metrics when there is an established context and relevance to the stakeholder’s information need. Metrics in combination with supportive data visualizations and explanatory narratives construct a picture capable of translating a message readers can apply to make institutional
the underlying theoretical concepts supporting the various methods libraries can pursue. This literature review will examine relevant information and library science literature on metrics indicating value and those pertaining to special libraries.
Many organizations rely on standardized methods for guidance in evaluation processes leading to decisions concerning operations and funding. The standards involving metrics directly applicable to special libraries vary (Murray, 2013; Dash & Padi, 2010), and in the case of the EPA-RTP Library, are not incorporated into the development of these processes and procedures. The variance and associated criticisms of qualitative standards result in libraries reaching beyond into the scholarly literature and writings of accomplished field theorists and practitioners (Matthews, 2002). From there, administrators investigating library value for their institution can triangulate the standards, theoretical frameworks, and practice-based case studies to fit their own situation.
and performance measurements for academic, public, school, and certain special
libraries. Matthews (2002) advocates for the focus to move from controversial projected standards for inputs and outputs to more meaningful performance outcome
measurements.
Frameworks for organizational assessment can help libraries measure effectiveness through different perspectives. They provide a means through which complex
relationships between drivers and their outcomes can be comprehended (Matthews, 2011). Many frameworks concerning performance measurement are based on business concepts because of the need to find new ways to streamline organizational operations and efficiency. Businesses in all domains are becoming acquainted with the culture of “doing more with less” and providing measures of how they are doing so using value indicators. By assessing organizational effectiveness through the lens of certain frameworks, libraries have the opportunity to connect how resources are being used to directly meet goals and demonstrate this performance to stakeholders (Matthews, 2011). Metric method construction provides support for continuation of activities in an
environment where the special library is contained inside a business with a bottom line (Oakleaf, 2010). Useful frameworks assist libraries in concentrating on a few best-fit, applicable key elements compared to all of those that may be appropriate for their situation (Matthews, 2011). Literature proposing frameworks allows interested organizations to adopt and adapt the structure to fit their needs. From this situation is where practice-based literature is developed.
because individual experiences have the opportunity to fill a gap standards often leave (Dash & Padhi, 2010). Information professionals encounter similar challenges and thus should be able to look to colleagues and other organizations for solutions (Murray, 2013). Action research and evidence-based practice literature are useful for practitioners contemplating an institutional change (Oakleaf, 2010). By analyzing similar
organizations, librarians can hypothesize how such an activity would fare in their own environment. This study applies that idea to the EPA-RTP Library.
When addressing metrics, it is key to be able map each metric’s contribution to the library in context. The literature describes measures capable of tracing metrics back to categories of library productivity. The works of Joseph R. Matthews (2002, 2015) dedicate significant study to determining library value and its place in special libraries. His classification scheme builds from Richard Orr’s (1973) classic model for
components of evaluation in libraries. Where Orr proposes resources, capability,
outputs, outcomes, and impacts as the important pieces of the library evaluation process, Matthews (2015) proposes input measures, process measures, output measures, outcome measures, and impact measures as the corresponding indicators for these components.
part-time staff. Input measures are important when benchmarking and making side-by-side comparisons to other similar institutions (Dudden, 2008).
Once inputs are implemented in libraries they must be translated into services patrons can utilize. The measure of this activity is referred to as a process measure, or sometimes productivity measure, because it directly indicates the transformation step (Matthews, 2011). It is reflected during analyses revealing a quantification of the time or money required to produce services using the institution’s resources. Often, these
measures generate ideas of efficiency (Stevens, 2009). Process measures can also be used in comparisons with peer libraries (Matthews, 2011).
Inputs and their processes facilitate the production of services and resources in the library called outputs (Hiller, 2012). Output measures are completed in order to help determine the level to which users are participating in services offered (Matthews, 2011). Examples include volumes of activities that can be quantitatively measured, such as circulation statistics, door counts, class attendance, and reference questions answered. Again, these measurements can be used when comparing a particular library to others of similar makeup. They convey the message that something is being accomplished within the organization and can even infer emerging trends (Dudden, 2008). However, output measures involving use are often inadequately associated with being pure value
measures because they do not fully convey the “goodness” of the activities or the effect library services are having on users (Oakleaf, 2010).
measures, process measures, and output measures, their focus lies away from the actual user. Because of this, an important opportunity for progression through processes (such as innovation or customer service) might be lost if the focus is narrowed to just inputs and outputs (Brophy, 2002). Inputs and outputs are traditional internal measures that no longer resonate strongly with stakeholders. The information they provide from an assessment point of view may not contribute to the value of the greater organization as understood by those making its decisions (Oakleaf, 2010). A brief investigation into the history of metrics and library evaluation reveals an evolution in the types of metrics collected and their corresponding focus. As a transition to user-centered evaluation has emerged, libraries are advocating the use of outcomes and impacts as better
communicators of library value (Matthews, 2015).
Contrasting from the previous measures discussed, outcome measures concentrate more on the library patrons than internal activities. This measurement focuses on the effects a library produces on and surrounding its customers (Matthews, 2002). Outcomes are some of the most difficult aspects to measure as they can happen both directly and indirectly, planned and unplanned (Matthews, 2011). Matthews (2015) suggests some indicators of outcome measures reflected in the individual including changes in attitudes, values, skillsets, understanding, behavior, and overall satisfaction or enjoyment. Outcome measures can be quantified when the results of the previously mentioned measurements (input, process, and output) are compiled and become
important when examining program planning and evaluation (Rubin, 2006). This type of measurement is often discussed in the context of academic libraries where user
Impact measures stem from outcome measures, but occur within a community of users or the greater organization. While some literature uses the terms “outcomes” and “impacts” interchangeably, it is important to make the distinction in this context where value will be addressed for the individual as well as for the organization as a whole. The body of literature distinguishing the two types of measures has been developing in the last decade. Matthews (2015) proposes impact can be viewed as the cumulative effects of outcomes over the long term. Furthermore, impacts can be divided based on sector. Learning impacts, economic impacts, social impacts, and individual impacts are four perspectives through which library impacts can occur (Matthews, 2015).
It is important to connect library assessment procedures to the organizational
mission (Hales, 2012; Albert, 2014; Tenopir, 2013; Bowlby, 2012; Gann & Pratt, 2013; White, 2008; Oakleaf, 2010). Special libraries’ missions center around providing vital services to a specific group or type of users. The mission should be prioritized in the development of efficient outcome and impact metrics, especially where a special library is within a greater organization. This concerns the mission of the special library, but may need to be expanded to encompass the parent organization’s mission and strategic goals (Dalton, 2012). The library being able to justify their contribution to the greater
patrons. It is often the case where outcome measures are better determined by external consultants or large data collection efforts and thus may not be reported consistently Matthews (2002). To compromise, the mission may be used as the basis for a particular model of metric assessment or as an underpinning for aligning metrics and their purpose (Town, 2011).
Many challenges are associated with measuring outcomes and impacts. First, identifying these metrics is not enough to speak to their value. They must be measured and presented appropriately within the context of the organization, and this can
sometimes only be done over a long period of study (Matthews, 2015). Another
challenge is the inability to trace these effects directly to library services (Poll & Payne, 2006). Methods capable of determining impacts can be very invasive or time consuming. Some case studies have developed instruments to make abstract effects more tangible or advocate the use of surrogate measures (Botha, Erasmus, & Van Deventer, 2009; Poll & Payne, 2006). But for now, measuring intangible impact is still in its infancy (Marshall, 2000).
a direct result of library activities, not outside influences, must be defended (Poll, 2003). The challenge then becomes finding the strongest surrogates to answer these questions (Botha, Erasmus, & Van Deventer, 2009). However, Oakleaf (2010) describes how the potential correlations between data sources used as surrogates and institutional impacts are dependent on the current data collection procedures. Links between the two cannot be known if those possible areas of association are not explored.
Methods
This case study involved multiple steps in order to address each piece of the proposed research question. The metrics gathered in the EPA-RTP Library were analyzed through a form of mixed methods. Mixed methods research has been used increasingly in management research and possesses the ability to unveil concepts that may be missed in qualitative or quantitative research alone (Srnka & Koeszegi, 2007). Following Zhang and Wildemuth’s (2009) suggestion, this study implemented a directed content analysis approach where arising themes allowed for the perception of patterns in the data. This study sought to leverage the advantages of quantitative content analysis, but in the context of a more qualitative interpretation of the units being analyzed (Kohlbacher, 2006). The list of coding classifications was generated using categories outlined in the literature review. And finally, qualitative themes were used to turn data into numeric counts whose frequencies could be compared. As Tashakkori and Teddie (2003) describe, a “quantititizing” of qualitative data took place.
Sampling and Data Collection
Collecting metrics was not as simple as recording the numbers from each departmental clipboard. In some cases, the clipboard quantities were parts of an
equation, whose total was submitted to the Director. For other departments, the statistics were gathered from database queries and printed to physical paper for the Director. This means the final numbers were often not direct transfers and a lot of effort went into producing the data for management. Additionally, 18 metrics were recorded physically and not passed onto management, but were instead retained for internal recordkeeping. Coding Framework
The coding system was built on two schemes by defining 1) what type of
measurement the metric represents and 2) the type of library service the metric supports. For the first measure, metrics were coded based on Matthews’ (2002; 2015) model, acknowledging conformity to one of the mutually exclusive measurement types shown in Figure 1, as supported by the literature.
Figure 1. Types of measurements adapted from Matthews 2002, 2015.
Measure Definition
Input quantifiable resources provided to the library
Process activities that convert allocated resources into library products or services
Output quantifiable volumes and counts of patrons’ use of services and
products
Outcome the effects of the library’s products and services on the individual
Impact the effects of the library’s products and services on the community or organization over time
Other refers to measures which do not immediately involve the user but
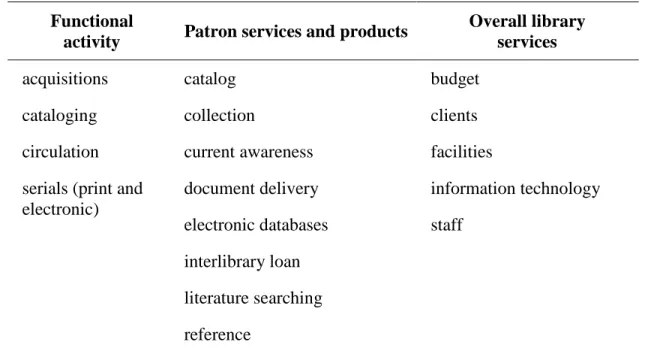
In Matthews’ framework and those who research from it (Hiller, 2012; Dudden, 2008), specific examples of questions collected are provided with their corresponding category. These instances were used to code the metrics. Then, the data was classified according to the second measure defined by the mutually exclusive function or service type the metric addresses as listed in Figure 2 (Matthews, 2002).
Functional
activity Patron services and products
Overall library services
acquisitions catalog budget
cataloging collection clients
circulation current awareness facilities serials (print and
electronic)
document delivery information technology electronic databases staff
interlibrary loan literature searching reference
Figure 2. Activities and services in a special library organized by scope.
When coding according to the first measure, the selection was supported with the reference or references for which the coding decision for that instance was made. There was also a notation acknowledging the corresponding library service area representing the second measure in order to trace the metric to its purpose. Examining these
Unit of
Analysis Input Process Output Outcome Impact
Door count
Matthews, 2002 (Overall library services)
Figure 3: Example coding matrix.
Analysis
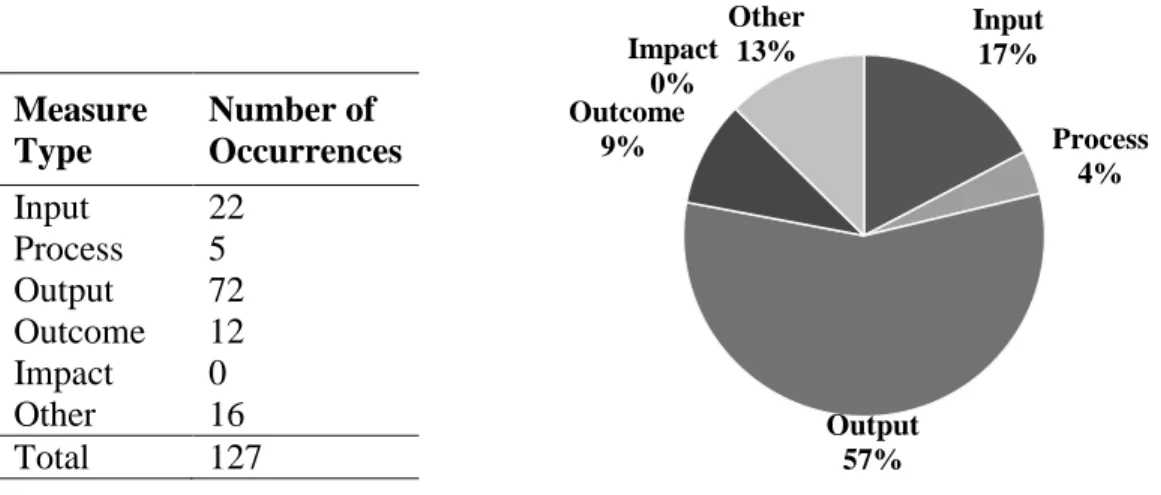
Input 17% Process 4% Output 57% Outcome 9% Impact 0% Other 13%
Results
Analysis revealed the library is disproportionately recording output measures above all other types of metrics with 72 of the 127 statistics, or 57%, falling into this category. The next most prevalent category was input measures with 17% of the metrics. “Other reasons” comprised the next most significant category covering about 13% of the metrics. Outcome measures, the most sought after category, only produced 9% of the metrics. Process measures followed with a 4% makeup. No impact measures were observed in this data collection.
Measure Type
Number of Occurrences
Input 22
Process 5 Output 72 Outcome 12 Impact 0
Other 16
Total 127
Figure 4. Overall occurrence of performance measures by type.
Of the outcome measures observed, the entirety involved metrics assessing patron services and products. 96% of the output measures were also this type of library
Matthews (2002), functional activities even though they are generally considered to be in the reference realm. None of the input measures or process measures were accounted for in the patron services and products category.
When examining the various departments in the library, reference, or sometimes referred to as “research,” had the most outcome measures. This same department also had the most output measures. Cataloging and acquisitions hosted the most input measures.
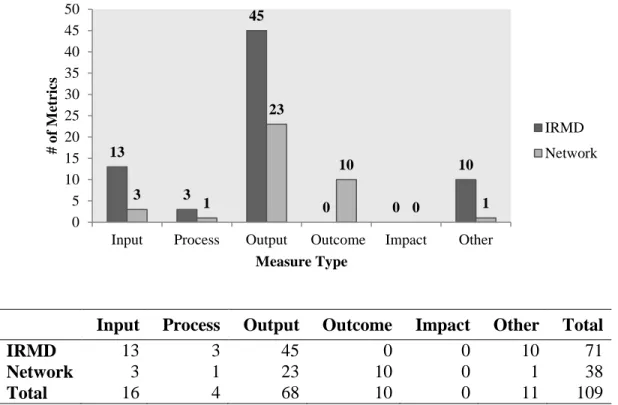
Between the two entities for which statistics are submitted, 56% of the statistics collected were for IRMD and 30% were for the EPA Library Network. Of those, output measures were the statistic type with the highest frequency, with both reports comprised of greater than 60% output measures. IRMD recorded both more input measures and more statistics falling into the other reasons category than the Network (Figure 5).
Input Process Output Outcome Impact Other Total
IRMD 13 3 45 0 0 10 71
Network 3 1 23 10 0 1 38
Total 16 4 68 10 0 11 109
Figure 5. Total number of metrics according to entity.
13 3 45 0 0 10 3 1 23 10 0 1 0 5 10 15 20 25 30 35 40 45 50
Input Process Output Outcome Impact Other
Discussion
The EPA-RTP Library is overwhelmingly collecting outputs as performance measures. There are a few reasons speculated for this. For one, outputs are the easiest and least invasive user-related activities to monitor. They can be recorded throughout the month and put together at the end of the month with minimal burden. They can be gathered, for the most part, without the patron being disturbed or having to take time away from his or her work. It is not surprising that activities relating to the reference department log the most statistics and the greatest concentration of output measures. Libraries need to examine their performance metrics at interfaces with customers and the EPA-RTP Library has made significant efforts to quantify the extent of these activities.
What outputs are missing is the ability to demonstrate the value the library is
other words, there is no way to be sure if the time spent on the task by the librarian is the exact amount of time it would have taken the scientist, a little less, or a little more.
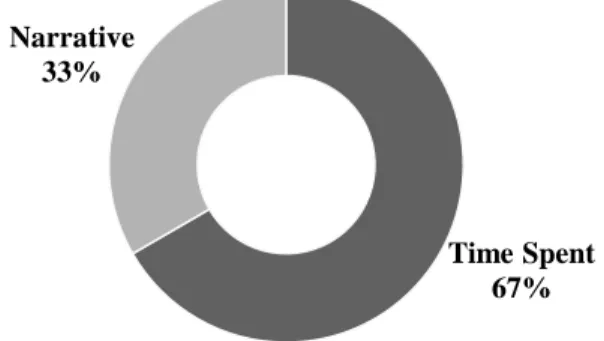
Figure 6. Outcomes separated by format.
The EPA Network Library statistics do provide opportunities for submission of outcomes that do not have to be determined by surrogates. The entries for research detail and monthly anecdotes provide the space for the library to describe any known
outcomes the services may have had on the patron. Again, in order to refrain from being invasive, staff must rely on a number of strategic methods to gather this information including the email survey, post-training surveys, and comments or conversations with patrons. These surveys are the best opportunity for the library to obtain non-numerical, open-ended, narrative information about how the services are affecting patron outcomes and impacts. Maximizing survey participation is key to maintaining these lines of communication.
Beyond this type of passive data gathering, obtaining real impacts concerning how the library contributed to the greater mission of the organization is challenging,
especially in this type of government special library setting. In this investigation, no opportunity for this information to be transferred to management was observed. Such results would probably have to be sought out by explicitly learning from patrons how the
Time Spent 67% Narrative
library helps them in their contributions to the organization. There may be opportunity for surrogates used in outcomes to be expanded upon. In cases where salary is known, time saved could possibly be extended further into money saved for the organization. The key to being able to work impacts into monthly statistics is to choose metrics that are easily obtained and easily recordable and to make sure those metrics are truly addressing areas of need.
Implications and Limitations
The research was conducted only on the metrics used by the EPA-RTP Library, a single sample in the large realm of government special libraries. Therefore its
applicability and generalizability to other special libraries will be limited. This method addresses a small part of the greater picture of library value. By analyzing solely the state of the current metrics through the proposed model, inferences and conclusions will have to be drawn in order to contemplate future directions. Additionally, the process of communicating metrics is not examined in depth, as it requires an entire different set of research questions. However, some details of the study contribute to its generalizability. The coding is based on deductive application of categories derived from a theoretical framework, which can then be assessed numerically (Kohlbacher, 2006). In fact, the triangulation of quantitative and qualitative methods as has been proposed argues in favor of generalizability (Kohlbacher, 2006). This also supports the analysis’s implementation in other contexts (Brewerton & Millward, 2001).
to signatures in emails delivered solely to patrons within the organization and gaining volunteer survey participation can be challenging. As with regularly distributed surveys, responses are typically only warranted when an experience was either outstanding or problematic. Given these circumstances, this unobtrusive approach examining internal reporting methods was selected over other more invasive qualitative research methods.
Certain liberties were taken during the coding. For example, when applicable, various cataloging and acquisitions statistics were used as surrogates for input measures. Traditional inputs such as budget are not included in the statistics because of contractual rules between library staff and federal management. However, the governing body wished to know greater detail about the library’s processes than just how many books were added to the collection. In this method, books added through multiple cataloging methods, through donations, and ways of acquiring serials are described. Also in the cataloging and interlibrary loan departments, figures are often recorded in the day-to-day operations in order to be used in the calculation of what is submitted to management. In an effort to be comprehensive, metrics like these along with some others, such as those not influencing patrons, were included in the “other reasons” category.
Conclusion
The current study investigated the status of statistics recorded in the EPA-RTP Library. Metrics recorded by staff members and submitted to library management were evaluated based upon adherence to a model. Each metric was classified as either an input, process, output, outcome, or impact measure and the frequency for each category was analyzed. The library collects the most output measures, the easiest and least
invasive statistic to record. Outcome measures, the most desirable metric, were collected but only by one of the management entities. In order to improve the state of metrics at the EPA-RTP Library, there needs to be a greater focus on noninvasive ways to gather information about outcomes and impacts rather than the current emphasis on
quantitative outputs. By implementing more of these measures, the organization will be able to better understand how services influence patrons and more effectively
Bibliography
Albert, A. B. (2014). Communicating library value - the missing piece of the assessment puzzle. Journal of Academic Librarianship, 40, 634-7. Retrieved from
http://hdl.handle.net/2324/1124694
Ard, C. (2012). Beyond metrics: The value of the information center. Information Outlook, 16(5), 16-18.
Baldwin, J. (2013). The crisis in special libraries: An overview and case study. Sci-Tech News,56(2), 4-11.
Botha, E., Erasmus, R., & Van Deventer, M. (2009). Evaluating the impact of a special library and information service. Journal of Librarianship and Information Science, 41(2), 108-123.
Bowlby, R. (2011). Living the future: Organizational performance assessment. Journal of Library Administration, 51(7), 618-644. doi:10.1080/01930826.2011.601267 Brewerton, P.M., & Millward, L.J. (Eds.). (2001). Organizational Research Methods.
London, England: SAGE Publications, Ltd. doi:
http://dx.doi.org.libproxy.lib.unc.edu/10.4135/9781849209533
Brophy, P. (2002). The quality of libraries. In K. Hilgermann, & P. te Boekhorst (Eds.),
The effective library (pp. 30-46). Munich: K.G.
Castiglione, J. (2008). Environmental scanning: An essential tool for twenty-first century librarianship. Library Review, 57(7), 528-536.
Choo, C.W. (2001). Environmental scanning as information seeking and organizational learning. Information Research, 7(1).
Dalton, M. (2012). Key performance indicators in irish hospital libraries: Developing outcome-based metrics to support advocacy and service delivery. Evidence Based Library and Information Practice, 7(4), 82-95. Retrieved from
http://www.ceeol.com/aspx/getdocument.aspx?logid=5&id=37F17027-B5C7-4FAD-AF8B-6B9A52629CEE
Dash, N. K., & Padhi, P. (2010). Quality assessment of libraries. DESIDOC Journal of Library & Information Technology, 30(6), 12-23. doi:10.14429/djlit.30.672 Downe‐Wamboldt, B. (1992) Content analysis: Method, applications, and issues. Health
Care for Women International, 13(3), 313-321, DOI: 10.1080/07399339209516006
Dudden, R. F. (2008). The necessity of measurement. Medical Reference Services Quarterly, 27(3), 323-338. doi:10.1080/02763860802198986
Dugan, R. E., Hernon, P., & Nitecki, D. A. (2009). Viewing library metrics from different perspectives: Inputs, outputs, and outcomes. Santa Barbara, CA: Libraries
Unlimited.
Gann, L. B., & Pratt, G. F. (2013). Using library search service metrics to demonstrate library value and manage workload. Journal of the Medical Library Association : JMLA, 101(3), 227. doi:10.3163/1536-5050.10L3.015
Gerould, J. T. (1906). A plan for the compilation of comparative university and college library statistics. Library Journal, 31, 761-763.
Haswell, M. (2012). Benchmarking: A powerful management tool. Information Outlook, 16(5), 13-15.
Heath, F. (2011). Library assessment: The way we have grown. The Library Quarterly, 81, 7-25.
Henczel, S. (2002). Benchmarking--measuring and comparing for continuous improvement. Information Outlook, 6(7), 12-20. Retrieved from http://search.proquest.com/docview/197372540?accountid=14244
Hiller, S. (2012). What are we measuring and does it matter? Information Outlook, 16(5), 10-12.
Kohlbacher, F. (2006). The Use of Qualitative Content Analysis in Case Study Research.
Forum Qualitative Sozialforschung, 7(1), no. 21. Retrieved from
http://www.qualitative-research.net/index.php/fqs/article/%20view/75/153January%202006#g422 Marshall, J. G. (2000). Determining our worth, communicating our value. Library
Journal, 125(19), 28-30.
Matthews, J. R. (2002). The bottom line: Determining and communicating the value of the special library. Santa Barbara, CA: Libraries Unlimited.
Matthews, J. R. (2011). Assessing organizational effectiveness: The role of performance measures. The Library Quarterly: Information, Community, Policy, 81(1), 83-110. doi:10.1086/657447
Matthews, J.R. (2015). Assessing outcomes and value: It's all a matter of perspective.
Morrison, J. L. (1992). Environmental scanning. In M. A. Whitely, J. D. Porter, and R. H. Fenske (Eds.), A primer for new institutional researchers (pp. 8699). Tallahassee, Florida: The Association for Institutional Research.
Murray, T. E. (2013). How much is a special library worth? valuing and communicating information in an organizational context. Journal of Library Administration, 53 (7-8), 462-471. doi:10.1080/01930826.2013.882200
Oakleaf, M. (2010). The value of academic libraries: A comprehensive research review and report. Chicago: Association of College and Research Libraries. Retrieved from http://www.acrl.ala.org/value/
Oberg, K.J. (2011). An Investigation of Reference Question Difficulty over Time (Master’s thesis). University of North Carolina, Chapel Hill, NC.
Orr, R. H. (1973). Measuring the goodness of library services: A general framework for considering quantitative measures. Journal of Documentation, 29(3), 315-332. doi:10.1108/eb026561
Poll, R. (2003). Measuring impact and outcome of libraries. Performance Measurement and Metrics, 4(1), 5-12.
Poll, R., & Payne, P. (2006). Impact measures for libraries and information services.
Library Hi Tech, 24(4), 547-562.
Rubin, R. J. (2006). Demonstrating results : Using outcome measurement in your library. Chicago, Ill: American Library Association.
Schutt, R. K. (2011). Chapter 10: Qualitative Data Analysis. In Investigating the social world: The process and practice of research. Pine Forge Press. Retrieved from: http://www.sagepub.com/sites/default/files/upm-binaries/43454_10.pdf
Sinnott, A.E. (2011). Library Assessment Practices in North Carolina Public Libraries: What are they measuring and how are they measuring it? (Master’s thesis). University of North Carolina, Chapel Hill, NC.
Srnka, K. J., & Koeszegi, S. (2007). From words to numbers: how to transform qualitative data into meaningful quantitative results. Schmalenbach Business Review, 59.
Stevens, K. (2009). Introduction to library metrics: Statistics, evaluation and assessment. Unpublished manuscript from ANZTLA Workshop.
Tashakkori, A., & Teddie, C. (2003). Handbook of mixed methods in social & behavioral research. Thousand Oaks, CA: SAGE Publications.
Tenopir, C. (2013). Building evidence of the value and impact of library and informations services: Methods, metrics, and ROI. Evidence Based Library and Information Practice, 8(2), 270-274. Retrieved from
http://www.ceeol.com/aspx/getdocument.aspx?logid=5&id=37F17027-B5C7-4FAD-AF8B-6B9A52629CEE
Town, J. S. (2011). Value, impact, and the transcendent library: Progress and pressures in performance measurement and evaluation. The Library Quarterly: Information, Community, Policy, 81(1), 111-125. doi:10.1086/65744
White, L.N. (2008). Aligning library assessment processes to the library's service
environment. Library Review, 57(7), 499-513. doi:10.1108/00242530810894022 Zhang, Y. W., & Wildemuth, B. M. (2010). Qualitative analysis of content. In B.