Changes in Environmental Tobacco Smoke Policies in North Carolina Indoor Recreational Facilities
from 1999 to 2002 By
April L. Buscher
A Master's Paper submitted to the faculty of the University ofNorth Carolina at Chapel Hill
In partial fulfillment of the requirements for The degree of Master of Public Health in
The Public Health Leadership Program.
Chapel Hill 2003
:hclu
8:.ZOQ3
ABSTRACT
Objective: To examine changes in environmental tobacco smoke (ETS) policies and exposure from 1999 to 2002 in North Carolina indoor recreational facilities.
Methods: Telephone interviews of owners and managers of244 indoor North Carolina recreational sites in 1999 and 250 sites in 2002 (enclosed shopping malls, commercial airports, skating rinks, bowling alleys, and indoor spectator facilities that seat 1,000 people or more) were conducted to assess their
knowledge and attitudes about ETS exposure, current smoking policy, incentives and barriers to changing the policy and knowledge about the Americans with Disabilities Act (ADA).
Results: The response rate was 71% in 1999 and 72% in 2002. From 1999 to 2002, participants reported stronger beliefs that ETS causes lung cancer in non-smokers (81% vs. 93%,
x
2 = 13.857, p<.001) and heart disease in non-smokers(71% vs. 83%,
x
2 = 7.575, p<.007). While the percentage of sites that did notallow smoking increased slightly from 1999 to 2002 (58 vs. 62%,
x
2 = .596, p<.441 ), the percentage of malls that reported having no limitations on smoking decreased significantly between 1999 and 2002 (21% vs. 6%,x
2 = 4.166, p<.042).smokers (58%) in 1999 to a signed petition by 100 school children (58%) in 2002. Significantly more respondents in 2002 compared to 1999 (76 vs. 65%,
x
2 =5.229, p<.02) reported that they felt the Americans with Disabilities Act might be applicable to non-smokers with respiratory problems who could be exposed to ETS in their establishments.
Conclusions: Although public exposure to ETS continues in many recreational facilities in North Carolina, there appears to be some progress in strengthening protections from exposure. Public health efforts must continue to focus on public venues where high levels of exposure remain, as well as private venues such as homes. Efforts may also focus on increasing education about separate ventilation, decreasing perceived economic barriers, supporting youth involvement with advocacy, and supporting regulatory standards for clean indoor air.
INTRODUCTION
Environmental tobacco smoke exposure is common in the United States'
population. Data from the Third National Health and Nutrition Examination
l
Survey (1988 to 1991) showed that, of the adult non-tobacco-using population,37% reported home or work exposure to ETS. Serum cotinine levels, a byproduct of nicotine found in blood and urine, reflect exposure to nicotine from the
previous 1 to 2 days. In this same survey, 87.9% of persons who were non-
t--L
tobacco users had detectable levels of cotinine, most likely from exposure to
~
ETS is a well-established cause of multiple diseases including lung cancer, heart disease, pulmonary disease and Sudden Infant Death Syndrome. Conservative estimates determine that exposure to ETS causes approximately 53,000 deaths annually, making it the third leading preventable cause of death, after active smoking and alcohol use.Z In 1992, the US Environmental Protection Agency classified ETS as a group A (known human) carcinogen and has since then estimated that 3,000 excess lung cancer deaths occur yearly among non-smokers because ofETS?·4 Heart disease mortality and morbidity are also
epidemiologically associated with ETS5, with ETS contributing to about 37,000
heart disease deaths annually _2·6•7
restricts coronary blood flow and increases cholesterol levels in non-smokers for 8-1 0 hours. 10• 11
Several of the Healthy People 2010 objectives are to reduce the proportion of non-smokers exposed to environmental tobacco smoke and increase the proportion of worksites with formal smoking policies that prohibit smoking or limit it to separately ventilated areas. In 1998-99,79 percent ofworksites in the U.S. with 50 or more employees had formal smoking policies that prohibited or limited smoking to separately ventilated areas. 12 Although the primary purpose of restrictive smoking policies at the worksite is to reduce non-smokers' exposure to environmental tobacco smoke, such policies are often a facilitator of smoking cessation as well. 13"15
Most research on voluntary smoke-free policies has focused on broadly defined worksite locations. There is little research to target which facilities continue to allow ETS exposure and which ones do not and why such facilities might change or not change their policies. For most states that have not implemented statewide ETS regulations, information about certain worksites that still allow smoking is important for public health purposes. This research study was designed to survey business owners and managers of youth and family-oriented indoor recreational facilities throughout North Carolina in 1999 and 2002 about their smoking policies and knowledge and attitudes about ETS exposure.
l
METHODS Design
Five categories of public youth and family-oriented indoor recreational sites in North Carolina were chosen for this study: shopping malls, commercial airports, skating rinks, bowling alleys, and large public indoor spectator facilities (seating at least 1,000 people) such as sports arenas, convention centers and auditoriums.
In 1999, sites were identified through several methods including Internet searches, phone calls and emails to the 150 NC Chambers of Commerce and the 40
members of the NC Association of Convention and Visitors' Bureaus. Sites were verified by the NC State Department of Transportation- Aviation Division, the US Roller Skating Association, the Bowling Proprietors' Association of America, the NC State Property Office, and the University ofNorth Carolina College System Office of General Administration, and phone calls to all of the community and technical colleges and independent universities in the state. The same method was used in 2002 to identifY sites irrespective of whether or not they participated in 1999.
Sample
In 1999, the target population included 345 sites: 53 shopping malls, 14 airports, 85 skating rinks, 97 bowling alleys, and 96 indoor spectator facilities. In 2002, 348 sites made up the target population, including 63 shopping malls, 14 airports, 88 skating rinks, 1 02 bowling alleys, and 80 indoor spectator facilities. Sites such
' L
as museums and libraries were excluded because it was believed that almost all such facilities already prohibited smoking on the premises. Strip shopping centers were excluded because of a lack of common indoor shopping areas. The low traffic and lack of significant indoor common spaces excluded small municipal airports from the study. Small indoor spectator facilities were excluded to keep the study size manageable and to target those sites that have the highest volume of customers or patrons for a single event. To keep the study size manageable, restaurants were excluded.
The great majority of interviews were conducted by telephone through trained interviewers; the remaining interviews were either done in person or through the mail. Targeted contacts not reached after five attempts were considered non-participants. In some cases, the owner/manager operated more than one facility. In these situations, answers to the knowledge and attitude questions were counted only once. The names of the owners/managers were not recorded during the data collection process.
Although there were some 1999 businesses that may not have participated in 2002, there was no significant difference between the basic characteristics of the 1999 businesses that participated in 2002 and those that either did not agree to participate or could not be reached in 2002. In addition, although there were some 2002 businesses that may not have participated in 1999, there was no
significant difference between the basic characteristics of the 2002 businesses that participated in 1999 and those that did not participate in 1999.
Measures
Study participants (the site owner or manager) were asked to complete a 36-item questionnaire with scaled responses (i.e. strongly agree to strongly disagree). The questions assessed general demographic information about the establishment (e.g. number of patrons per week, respondents' smoking status), knowledge and attitudes about ETS, the current smoking policy at the establishment, the
respondent's exposure to ETS, perceived incentives and barriers to changing their policy, and knowledge about the Americans with Disabilities Act.
Analysis
In this study, the unit of analysis was either the individual facility or respondent, as appropriate. Lists of participants from 1999 and 2002 were reviewed to
determine which businesses participated in both years. The collected survey data for the businesses that participated in 1999 and 2002 and the data for the
businesses that participated in either 1999 or 2002 was coded and entered separately into two SPSS statistical software files. SPSS was used to test associations by chi-squares and independent means t-tests. In cases where answers were scaled, strongly agree and agree were grouped together, as was strongly disagree and disagree. A two-tailed p-value of 0.05 was used as the level of statistical significance.
' •
f-l
t
r-L
~
RESULTS
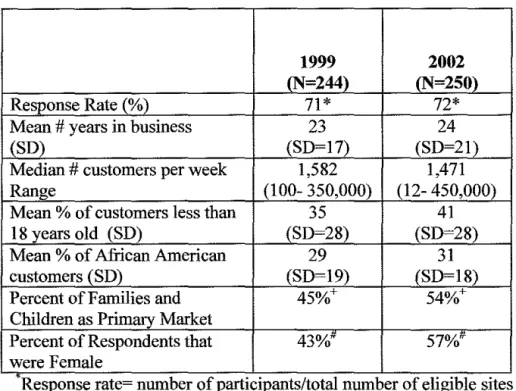
The characteristics of the businesses that participated in 1999 and 2002 are shown in Table 1. Of345 eligible sites in 1999,244 (71%) agreed to be interviewed, and in 2002, 250 out of 348 eligible sites (72%) were interviewed. Seventy-four businesses could not be reached after multiple attempts (21%) and only 26 of those who were reached declined to participate (8%) in 1999. In 2002, 56 businesses could not be reached after multiple attempts (16%), and 43 of those who were reached declined to participate (12%). At least 60% of each type of site agreed to participate in 1999, and at least 68% of each type of site agreed to participate in 2002. Participating sites covered 63% ofNC counties in 1999 and 61% ofNC counties in 2002. One-third of participating sites in 1999 were located in Project ASSIST (Americans Stop Smoking Intervention Study) counties while 40% of participating sites in 2002 were located in ASSIST
counties. Over 75% of interviews in both years were conducted with managers of the establishments. Significantly more respondents in 2002 were female (57%) compared to the percent of female respondents (43%) in 1999
x
2 = 10.835,p<.002).
Overall, sites participating in 1999 had been in business an average of 23 years and those participating in 2002 for an average of24 years. The median number of customers per week in 1999 was 1,582 (range 100- 350,000) and in 2002 was 1,500 (range 12- 450,000). There was little difference in the estimates of percent
of customers under the age of 18 in each year Gust over a third) and the estimated percent of customers that were African-American Gust under a third). Families and children comprised 45% of the primary market in 1999 and 54% in 2002 (x2
= 3.779, p<.053).
Knowledge and Attitndes about ETS Exposure
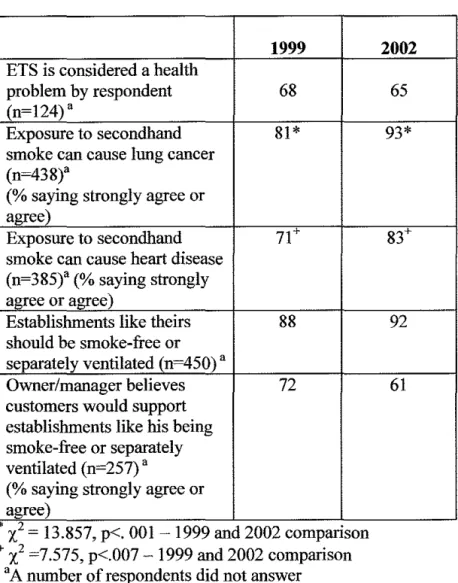
Respondents' knowledge and attitudes about ETS exposure are shown in Table 2. While the majority of participants in both years agreed that ETS exposure is a serious health problem, there was a significant increase from 1999 to 2002 in the percentage of participants that agreed or strongly agreed that exposure to ETS can cause lung cancer in non-smokers (81% vs. 93%,
x
2 = 13.857, p<.OOl). Also,there was a significant increase in the percentage of participants that agreed or strongly agreed that exposure to ETS can cause heart disease in non-smokers smokers between 1999 and 2002 (71% vs. 83%,
x
2 = 7.575, p<.007). In bothyears, the great majority of participants stated that public exposure should be restricted, that all establishments like theirs should either be smoke-free or have separately ventilated areas, and that their patrons would support such policies.
Current ETS Policies
The percentage of sites within ASSIST counties that reported being smoke-free also showed a small but insignificant increase between 1999 and 2002 (35% vs. 44%,
x
2 = 2.127, p = .145). There was a significant increase in the percentage of businesses that reported being separately ventilated between 1999 and 2002 (0% vs.l9%,x
2 = 51.890, p<.OOI). Simultaneously, there was a significant decline inthe percentage of businesses that reported having separate smoking sections between 1999 and 2002 (28% vs. 9%,
x
2 = 30.136, p<.OOI). These results forseparately ventilated areas and separate sections were not only true when comparing the sample cross-sectionally, but also in the subset of those that
participated in both 1999 and 2002. Policy type was independent of the gender of the survey respondent.
When examining ETS policies among different venues (Figures 2-6), there were significant changes in smoking policies for malls and bowling alleys between 1999 and 2002. The percentage of malls that reported having no limitations on smoking decreased significantly between 1999 and 2002 (21% vs. 6%,
x
2 = 4.166, p<.042). Also, there was a significant decrease in the percentage of malls that reported having separate sections between 1999 and 2002 (21% vs. 0%,x
2 =11.142, p<.002). Simultaneously, the percentage of malls that reported being separately ventilated increased significantly between 1999 and 2002 (0% vs. 17%,
x
2= 6.983, p<.009).
II
L
L f
I
The percentage of bowling alleys that reported having separate smoking sections also significantly decreased between 1999 and 2002 (62% vs. 20%,
x
2 = 24.952, p<.001). Simultaneously, there was a significant increase in the percentage of bowling alleys that reported being separately ventilated between 1999 and 2002 (0% vs. 43%,x
2 = 37.238, p<.001). These results for bowling alleys' smokingpolicies were not only true when comparing all of the businesses that participated in 1999 and all of those participating in 2002, but was also true when comparing the same businesses that participated in 1999 and 2002.
Personal Exposure to ETS and Smoking Status
Table 3 shows the amount of personal exposure to ETS and the smoking status of the respondents in 1999 and 2002. The number of respondents who were current smokers increased significantly between 1999 versus 2002 (16% vs. 25%,
x
2 = 5.545, p<.020). Compared to respondents in 1999, those in 2002 who were current smokers were more likely to report that their site had a smoking policy other than 'no smoking' (38% vs. 16%,x
2 = 11.058, p<.002).p<.OOl). There was also a significant increase in these sites in the number of participants that reported that ETS causes them no discomfort from 1999 to 2002 (57% vs. 78%,
x
2 = 5.341, p<.02) or that air quality in their facility was good(47% vs. 80%;
x
2 = 21.845, p<.OOl).Incentives and Barriers to Changing Smoking Policy
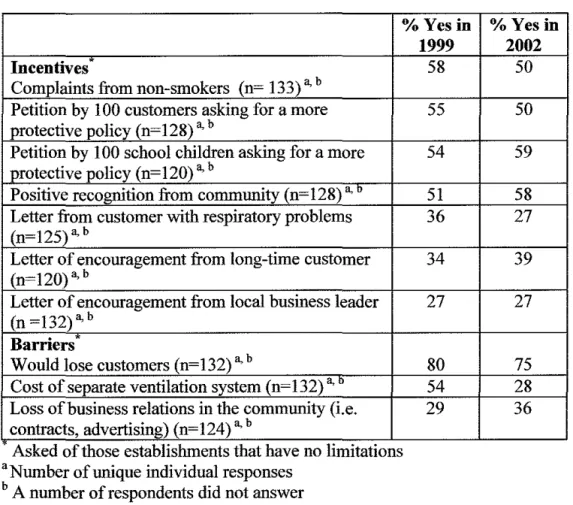
The most commonly reported incentive for businesses that currently allow smoking to change their smoking policy was complaints from non-smoking patrons in 1999 (58%) and a signed petition by 100 school children in 2002 (59%) (Table 4). The majority of participants in 1999 (80%) and 2002 (75%) reported that concern about losing customers was the most important barrier to
implementing a more restrictive smoking policy (Table 4).
Attitudes about the Americans with Disabilities Act
Significantly more respondents in 2002 versus 1999 (76% vs. 65%,
x
2 = 5.229,p<.023) reported that they felt the Americans with Disabilities Act might be applicable to non-smokers with respiratory problems who could be exposed to ETS in their establishments.
DISCUSSION
This is the first study to assess reports of statewide changes over time in
i
environmental tobacco smoke exposure in all public indoor recreational facilities
~-in a state. This study is also unique ~-in that North Carol~-ina is the nation's lead~-ing
tobacco-producing state. Therefore, it is remarkable that, even over a three-year
r-time span, the attitudes and policies that support limiting ETS exposure in publicvenues have increased.
The findings from this study are consistent with national surveys. A 1998 survey
by the National Campaign for Tobacco-Free Kids reported that 84% of adults
b
~·'
favor prohibiting smoking or having separately ventilated areas in public places and most workplaces. In this same survey, 73% of adults favored a national tobacco policy to protect non-smokers from the dangers ofETS.16 Also, a 1999 Behavioral Risk Factor Surveillance System survey reported that 76% of North Carolina workers had smoke-free policies at their worksite.17 These smoke-free policies have been implemented voluntarily in many sites such as schools,
restaurants, hospitals, and private worksites with little awareness ofETS exposure in other public indoor recreational facilities such as those in this study.
to participate. The other facilities that did not participate could not be reached after multiple attempts. The overall high response rate of 72% suggests that this data is representative of businesses around the state. In addition, many of the respondents in 1999 and 2002 were managers. Such individuals may not have decision-making ability regarding their business' smoking policy but likely have a good sense of their business operations and customer concerns.
Interpretation of Findings
Although public exposure to ETS continues to occur in many recreational
facilities throughout North Carolina, there has been a 4% absolute and 7% relative increase from 1999 to 2002 in the percentage of indoor recreational facilities that are smoke-free. While overall changes were not statistically significant, there were statistically significant changes occurring in recreational facilities with the highest remaining exposure such as malls and bowling alleys.
In this study the percentage of bowling alleys reporting that they have separate ventilation (vs. no smoking allowed or separate sections) has increased, indicating perhaps that owners and managers of these businesses may have higher health concerns about ETS and believe that they are protecting their non-smoking patrons from ETS exposure by having reportedly separately ventilated areas. Common ventilation systems are designed to recirculate air, not to filter it, often bring polluted air from smoking areas into designated smoke-free areas and not adequately protecting non-smokers from ETS exposure.18 Completely separately
15
l
f
[
!
f
ventilated and enclosed areas can limit ETS exposure, but they are expensive. In
addition, many of the respondents who stated that their businesses are separately ventilated also stated that such a system is not very costly. This suggests that many business owners/managers may not be aware of the defmition of a
separately ventilated and enclosed area that can adequately protect patrons from exposure to ETS. It is likely that many reports of separate ventilation in this study do not provide the full protective effects needed to limit exposure to acceptable standards. Such a standard requires that there must be an enclosed smoking lounge with a minimum of 60 cubic feet per minute of supply air per smoker and that the air from the area must be exhausted outdoors. 19 The increase in reported separate ventilation suggests that owner/manager education about ventilation systems is needed in combination with advocacy and legislation to affect maximum policy change.
Legislative Efforts
Aside from an increase in reported ventilation, in 2002, respondents from establishments that continue to allow smoking reported that their patrons were exposed to less ETS and that a lower percentage of their patrons were smokers. However, the adult smoking rate in North Carolina from 1999 to 2002 increased from 25 .I% to 26.2%. 20• 21 Therefore, it is clear that a need still exists for stronger
facilities that allow smoking that their employees are likely exposed to ETS for longer periods of time than are most of their patrons and that such long-term exposure can be hazardous to their health. Since this study showed that there was a significant increase from 1999 to 2002 in the percentage of owners/managers that were smokers and that those same respondents were more likely to allow smoking in their facilities, worksite cessation opportunities may be an important method in influencing owners/managers to establish well-defined separately ventilated areas or adopt a 100% smoke-free policy. In fact, there is a growing push across the country to provide ETS protection to employees and making ETS exposure a workplace safety issue. For instance, in 1994, California passed the California Smoke-Free Workplace Act making nearly all restaurants and other workplaces 100% smoke-free?2 Also, a Florida Smoke-Free Workplaces amendment entitled "Protect People from the Health Hazards of Second-Hand Tobacco Smoke by Prohibiting Workplace Smoking" was approved in the November 2002 general election and will go into effect no later than July 1, 2003
?
3 Connecticut, New York and Delaware have also recently passed state smoke-free workplace laws?4Currently, North Carolina, like most states, has no statewide laws protecting non-smokers from ETS exposure. Instead, it has a preemptive law (GS143-597: Smoking in Public Places) requiring 20% of state controlled buildings to be designated for smoking, thereby prohibiting entire state buildings from becoming completely smoke-free.25 This law also prohibits local governments from
enacting their own laws that protect their citizens from ETS exposure. As more facilities strengthen their ETS policies, the general public will become more aware of the importance of curbing ETS exposure. This in turn could lead to a victory for public health advocates in changing North Carolina's legislative norms and attitudes about public exposure to ETS and causing the preemptive law to be overturned. The state of Louisiana has recently shown that overturning preemption can happen. Their state legislature recently passed a bill that will allow local governments to be able to adopt tougher no-smoking laws. 26 Overturning preemption would give North Carolina's local governments the authority to pass ordinances restricting smoking in public places. Research shows that passing local ordinances is more effective in protecting non-smokers from exposure to ETS, easier than statewide restrictions to enforce, is less difficult than statewide restrictions to pass, and decreases the social acceptability of smoking, thereby deterring initiation.14• 27 However, overturning preemption would
Advocacy in North Carolina
For many states, particularly tobacco-producing states, the ability to pursue legislative policy change in the near future will still be limited. Thus, intensive educational and local advocacy efforts must continue to influence owners/ managers of businesses to voluntarily change their ETS policies. In North Carolina, state and local public health officials have concentrated efforts within the last three years on educating owners, managers and customers of recreational facilities about ETS exposure and advocate policy change. This study shows that there was a small though not statistically significant increase in the percentage of recreational facilities that became smoke-free between 1999 and 2002 in ASSIST counties versus non-ASSIST counties. This result was not statistically significant because there are low numbers of ASSIST counties and low numbers of indoor recreational facilities within such counties. Several local ASSIST coalitions have advocated for smoke-free recreational facilities.3
°
For instance, Guilford County Project ASSIST encouraged volunteers to complain about permitting smoking indoors to the owners/managers of three malls in their area which may or may not have participated in this study. Consequently, the malls became smoke-free thereafter (Mary Gillett, Coordinator of Guilford County Project ASSIST, personal communication, 2003). Thus, it appears that ASSIST may be having a positive and measurable impact on affecting clean indoor air policy change. Tracking these changes in future surveys can further pinpoint such contributions.North Carolina has recently set a statewide objective to eliminate ETS exposure by 2010 and has used some of its tobacco settlement money to form a Health and Wellness Trust Fund for addressing tobacco-related issues. Over 25local
coalitions are conducting advocacy campaigns around the state, in part to reduce youth exposure to ETS. Local coalitions should ensure that they use the results of this survey to inform public advocacy efforts. For instance, this study found that the most commonly reported incentive for businesses that currently allow
smoking to change their smoking policy switched from being complaints from non-smoking patrons in 1999 to being a signed petition by I 00 school children in 2002. Also, this study shows that a higher percentage of families and children are patrons of the businesses participating in 2002 compared to those participating in 1999. Therefore, the owners and managers may care more about the health effects ofETS exposure on children and young adults now because these groups make up the majority of their patron population. A petition by children represents a potentially effective strategy for public health to use in advocating clean indoor air. For example, the North Carolina Environmental Tobacco Smoke Training, Education and Research Program has been training school children to develop media pieces to express their views on ETS exposure?1 Such a program could be used to teach children how to advocate for clean indoor air in their favorite
Addressing Barriers
The most commonly reported barrier to changing an ETS policy in both 1999 and 2002 was concern among owners/managers that they would lose customers if they adopted a more restrictive smoking policy. Health advocates should relay to owners/managers that, in reality, ETS restrictions have not been shown cause a loss of revenue. 32.34 Also, public health workers could develop a website listing
smoke-free facilities. This added publicity could even increase such facilities' business on the long run. In addition, public health workers could enlist the owners/managers of such sites on the website list that have successfully established smoke-free policies without losing business to help other
I
r
owners/managers do the same. Working with such owners/managers with smoke-free policies may alleviate the apprehension that other owners/managers may have about the potential loss of business with such a policy.
Americans with Disabilities Act
In addition to educating owners/managers about perceived economic barriers as a way to get them to change their ETS policy, smoke-sensitive individuals could use the Americans with Disabilities Act to seek ETS protection. This act prohibits places of public accommodation from discriminating on the basis of disability. Under the law, a disability is defined as physical or mental impairment that substantially limits one or more major life activities.35 People with chronic respiratory illnesses such as asthma have filed claims under ADA, claiming that breathing without hardship is a major life activity. Significantly more
owners/managers/employees in this study in 2002 compared to 1999 reported that
they felt ADA might be applicable to non-smokers with respiratory problems who
could be exposed to ETS in their establishments. Interestingly, fewer
owners/managers in 2002 reported that a letter from a customer with respiratory
L
problems would be an incentive for them to change their ETS policy. Therefore,
businesses may be responsive to interventions that allow them to avoid litigation
by smoke-sensitive patrons and aim to increase compliance with the ADA. Also,
educating employees about using the ADA as a legal remedy to avoid unwanted
ETS exposure in their worksites may be worthwhile.
Conclusion
I
In 2003, local and statewide health advocates should focus their efforts on venues
at which patrons still have had significant ETS exposure since 1999, such as
bowling alleys. Patrons of many North Carolina restaurants, grocery stores,
convenience stores and hotel lobbies also continue to have exposure to ETS and
l
therefore also require public health attention in order to affect policy change.31
Public health workers should build on owners' and managers' knowledge that
ETS can affect the long-term health of non-smokers. It will be important to
educate owners/managers about separate ventilation and perceived economic
barriers; support petitions by youth and media involving youth against ETS
exposure; work to give local authorities the power to regulate smoking in their
law; and educate employees about the protection that the ADA offers smoke-sensitive individuals.
I
REFERENCES
1. Pirkle JL, Flegal KM, Bemert JT, eta!. Exposure of the US Population to Environmental Tobacco Smoke: The Third National Health and Nutrition Examination Survey, 1988 to 1991. Journal of the American Medical
Association. 1996; 275: 1233-40.
2. Glantz SA, Parmley WW. Passive Smoking and Heart Disease: Mechanisms and Risk. Journal of the American Medical Association. 1995; 273(13): 1047-1053.
3. U.S. Environmental Protection Agency. Respiratory Health Effects of Passive
Smoking: Lung Cancer and Other Disorders. Washington, DC: Indoor Air !,
Division, Office of Atmospheric and Indoor Programs, Office of Air and
I
Radiation, US Environmental Protection Agency; 1992. Publication no. EP A/600/6-90/006F.
4. Jaako1a MS, Samet JM. Summary. Workshop on health risks attributable to ETS exposure in the workplace. Environmental Health Perspectives. 1999; 107 ( suppl): 823-827.
5. He J, Vupputuri S, Allen K, eta!. Passive Smoking and the Risk of Coronary Heart Disease- A Meta-Analysis of Epidemiologic Studies. New England
Journal of Medicine. 1999; 340(12): 920-926.
7. Howard G, Wagenkneckt LE, Burke GE, et al. Cigarette smoking and
progression of atherosclerosis. The atherosclerosis in communities (ARIC) study.
Journal of the American Medical Association. 1998; 279: 119-124.
8. Chilmonczyk BA, Salmun LM, Magathlin KN, Neveux LM. Association between exposure to environmental tobacco smoke and exacerbations of asthma in children. New England Journal of Medicine. 1993; 328: 1665-1669.
9. Institute of Medicine Division of Health Promotion and Disease Prevention.
Clearing the Air: Asthma and Indoor Air Exposures Committee on the Assessment
of Asthma and Indoor Air. Washington, D.C: National Academy Press; 2000.
10. Otsuka R, Watanabe H, Hirata K, et al. Acute Effects of Passive Smoking on the Coronary Circulation in Healthy Young Adults. Journal of the American
Medical Association. 2001: 286( 4); 436-441.
11. Pisavos C, Panagiotakos DB, Chrysohoou C, et al. Association between exposure to environmental tobacco smoke and the development of acute coronary syndromes: the CARDI02000 case-control study. Tobacco Control. 2002; 11: 220-225.
12. U.S. Department of Health and Human Services. Healthy people 2010 (conference ed, in 2 vols). Washington, DC: US Department of Health and Human Services; 2000.
13. Biener L, Nyman AL. Effect of Workplace Smoking Policies on Smoking Cessation: Results of a Longitudinal Study. Journal of Occupational and
Environmental Medicine 1999: 41(12); 1121-1127.
14. Hopkins DP, Briss PA, Ricard, CJ, et al. Reviews ofEvidence Regarding Interventions to Reduce Tobacco Use and Exposure to Environmental Tobacco Smoke. American Journal of Preventive Medicine. 2001; 20(2S): 16-66. 15. U.S. Department of Health and Human Services. Reducing Tobacco Use: A
Report of the Surgeon General. Atlanta, Georgia: U.S. Department of Health and
Human Services, Centers for Disease Control and Prevention, National Center for Chronic Disease Prevention and Health Promotion, Office on Smoking and Health, 2000.
16. National Center for Tobacco-Free Kids. Tobacco Free U.S. National Survey. 1999.
17. Centers for Disease Control and Prevention. State-Specific Prevalence of Cigarette Smoking Among Adults; Policies and Attitudes About Secondhand Smoke. Behavioral Risk Factor Surveillance System, Atlanta, GA; 1999. 18. Repace, J. Can Ventilation Control Secondhand Smoke in the Hospitality
Industry? Bowie, MD: Repace Associates, Inc.; 2000.
19. U.S. Environmental Protection Agency (EPA). Secondhand Smoke: What You
Can Do About Secondhand Smoke As Parents, Decision-Makers, and Building
Occupants. Washington, D.C: US Environmental Protection Agency, Office of
22. California Department of Health Services: Tobacco Control Section. The
California Smoke-Free Workplace Act. Sacramento, CA; November 2001.
23. Kelsey S. United States: It Affects You! Florida's Smoke-Free Workplaces Amendment. Mondaq. May 9, 2003.
24. Dixon K. Smoker rights snuffed: Lighting up in bars, restaurants barred after Rowland signs historic legislation. Connecticut Post. May 8, 2003.
25. Goldstein AO, Malek SH, Butzen AY. Labored Breathing: Policies to Eliminate Environmental Tobacco Smoke Exposure in North Carolina. North
Carolina Medical Journal. 2001; 62: 266-271.
26. Briefing Book: News and views from the Louisiana Capitol. The
Times-Picayune. June 11, 2003.
27. Jacobson PD, Wasserman J. Are Tobacco Control Laws Just Blowing Smoke? Tobacco Control Laws: Implementation and Enforcement. 1997. 28. Move on Smoking. Burlington Free Press. May 16,2003.
29. Kunzelman M. Senate proposal would expand smoking ban statewide. The
Metro West Daily News. May 30, 2003.
30. Goldstein AO, Knowles SB, Gamble G, et al. Environmental Tobacco Smoke Policies in North Carolina Recreational Sites. 1999.
31. Goldstein AO, Butzen AY. The ETS Policy Manual: An A to Z Toolbox for
Community Change. Chapel Hill, NC. 2002.
32. Goldstein AO, Sobel R. Environmental Tobacco Smoke Regulations Have Not Hurt Restaurant Sales in North Carolina. North Carolina Medical Journal. 1998; 59(5): 284-288.
33. Sciacca J, RatliffM, eta!. Prohibiting Smoking in Restaurants: Effects on Restaurant Sales. American Journal of Health Promotion. 1998; 12(3): 176-184. 34. Glantz SA, Smith LR. The Effect of Ordinances Requiring Smoke-Free Restaurants and Bars Revenues: A Follow-up. American Journal of Public
Health. 1997; 87(10): 1687-1693.
Table 1. Study Characteristics of Businesses that Participated in 1999 and 2002
1999 2002
(N=244) (N=250)
Response Rate (%) 71* 72*
Mean # years in business 23 24
(SD) (SD=17) (SD=21)
Median # customers per week 1,582 1,471
Range (100- 350,000) (12- 450,000)
Mean % of customers less than 35 41
18 years old (SD) (SD=28) (SD=28)
Mean % of African American 29 31
customers (SD) (SD=19) (SD=18)
Percent of Families and 45%+ 54%+
Children as Primary Market
Percent of Respondents that 43%* 57%" were Female
.
.
..
Response rate= number of participants/total number of eligible sites +
l
=3.779, p<.053- 1999 and 2002 comparison#
x
2 = 10.835, p<.oo2Table 2. Knowledge/Attitudes about ETS Exposure of 1999 and 2002 Respondents
1999 ETS is considered a health
problem by respondent 68 (n=124)a
Exposure to secondhand 81* smoke can cause lung cancer
(n=438)a
(% saying strongly agree or agree)
Exposure to secondhand 71+ smoke can cause heart disease
(n=385)a (% saying strongly agree or agree)
Establishments like theirs 88 should be smoke-free or
separately ventilated (n=450) a
Owner/manager believes 72
customers would support establishments like his being smoke-free or separately ventilated (n=257) a
(% saying strongly agree or agree)
'x
2= 13.857, p<. 001 -1999 and 2002 comparison +
x
2 =7.575, p<.007- 1999 and 2002 comparison"A number of respondents did not answer
100% 90% 80% 70% 60% 50% 40% 30% 20% 10% 0% Total1999 -3.5% -19.1% +3.4% Total2002
~~DNo Limita-!J-.o-ns-~---.
1111 Separate Sections
1!11 Reported as Separately Ventilated
1111100% Smoke-Free
Figure 1. Percent Change from 1999 to 2002 of Certain ETS Policies for All Establishments Combined
100%
90% -14.8%
80% 70% 60% 50% 40% +19.2 30% 20% 10% 0%
Malls 1999 Malls 2002
ioN~ Limitation-s--~·~,
I
1111 Separate Sections
11!1 Reported as Separately Ventilated
1111100% Smoke-Free
- - - ----~·~-'
Figure 2. Percent Change from 1999 to 2002 of Certain ETS Policies for Malls
100% 90% 80% 70% 60% 50% 40% 30% 20% 10%
Oo/oc_ _ _
Airports 1999 Airports 2002
D No Limitations
lllil Separate Sections
lllil Reported as Separately Ventilated
111100% Smoke-Free
Figure 3. Percent Change from 1999 to 2002 of Certain ETS Policies for Airports 100% 90% 80% 70% 60% 50% 40% 30% 20% 10%
0% "----~
Skating Rinks 1999
----0 No Limitations
Ill Separate Sections
Ill Reported as Separately : Ventilated
111100% Smoke-Free
L _ _ _ _ _ _ ~,
Skating Rinks 2002
Figure 4. Percent Change from 1999 to 2002 of Certain ETS Policies for Skating Rinks
100% 90% 80% 70% 60% 50% 40% 30% 20% 10% 0%
Bowling Alleys 1999 -0.9%
-41.8%
+42.9%
-0.3%
I D No Limitations
IIIII
Separate SectionsI
IIII Reported as Separately Ventilated
L~IOO%
Smoke-FreeBowling Alleys 2002
Figure 5. Percent Change from 1999 to 2002 of Certain ETS Policies for Bowling Alleys 100% 90% 80% 70% 60% 50% 40% 30% 20% 10% 0%
Arenas 1999 Arenas 2002
- - - · · - - - ,
D No Limitations
1111 Separate Sections
lill Reported as Separately Ventilated
IIIII 00% Smoke-Free
Figure 6. Percent Change from 1999 to 2002 of Certain ETS Policies for Arenas
L
!-Lf
l
I
r
Table 3. Personal Exposure to ETS and Smoking Status of Owners/Managers for Businesses Participating in 1999 and 2002
1999 2002
% Current smoker (n=94) a 16 25* %Former smoker (n=99) a 24 19 %Non-smoker (n-269 )a 60 57 Time at work exposed to 37 33 ETS (n=83)b
(% saying more than 4 hours per workday)
Mean % smokers in 41+ 8+
establishment
Amount of discomfort 43" 22" caused by secondhand
smoke (n=50) b
(% saying a lot or some discomfort)
*
x
2=5.545, p< .020- comparison of current smokers and former+ non-smokers in 1999 and 2002
+ t-test = 12.069, p<.OOl - 1999 and 2002 comparison
#
x
2 = 5.341, p<.022 -1999 and 2002 comparison•Number of unique individual responses
Table 4. Reported Incentives and Barriers to Changing Smoking Policy in 1999 and 2002
%Yes in Incentives
Complaints from non-smokers (n= 133) a, b
Petition by 100 customers asking for a more protective policy (n=128) a, b
Petition by 100 school children asking for a more protective policy (n=l20) a, b
Positive recognition from community (n=128) a,"
Letter from customer with respiratory problems (n=125) a, b
Letter of encouragement from long-time customer (n=l20) a, b
Letter of encouragement from local business leader (n =132) a, b
Barriers
Would lose customers (n=132) a, b
Cost of separate ventilation system (n-132) a,"
Loss of business relations in the community (i,e, contracts, advertising) (n=124) a, b
Asked of those establishments that have no limitatiOns "Number of unique individual responses
b A number of respondents did not answer
ACKNOWLEDGEMENTS
I would like to acknowledge Dr. Adam Goldstein for all of his help and support in
this project. Also, I would like to thank Sarah Knowles for all of her hard work
on the 1999 study. I also thank Annie Butzen, Carol Moffitt and Bronwyn
Charlton for their hard work and dedication in collecting the 2002 survey data for
this project. In addition, I would like to thank Dr. George Gamble for his