Are there Enough Doctors in My Community? People's Perception of Local Physician Supply.
By Holly Biola, MD
A Master's Paper submitted to the faculty of the University ofNorth Carolina at Chapel Hill
In partial fulfillment of the requirements for the degree of Master of Public Health in
the Public Health Leadership Program.
ABSTRACT
Purpose. To assess how closely people's perception oflocal physician supply relates to physician-to-population ratio, and identify what other factors are associated with this perception.
Method. Adults (n=4,879) from 150 Southern rural counties completed telephone surveys November 2002-July 2003. Response to a question about perception of adequacy oflocal physician supply was analyzed with bivariate and multivariate methods assessing strength of association between this perception and actual physician-to-population ratio,
individual characteristics, county characteristics, and perceptions about and experience with health care.
Results. Respondents more likely to feel there were enough physicians in their area include those who were less likely to state: doctors should be used as a last resort (OR 2.0,p < .001 ), their travel time to care was less than 30 minutes (OR 1.52,p <.001), cost of care was not a problem for them (OR 1.45,p <.001), they were satisfied with the care they had received (OR 1.67,p=.023) and confident in the skills of their physician (OR 1.39, p=.006). Respondents in areas with higher physician-to-population ratios, who were over 65, White, male, and in good health were also more likely agree there were enough local doctors. In our model most variance in opinion about physician supply was explained by perceptions and experience variables, followed by individual
characteristic variables, physician-to-population ratio, and county-level variables.
L
~-
~--ACKNOWLEDGEMENTS
My sincere thanks to Donald Pathman, MD, MPH for making his data,
his skillful editing, and his time available to me throughout my fellowships. Without his mentorship this paper would not have been possible. Many thanks also to Mark Hohnes, PhD at Cecil G. Sheps Center for Health Services
Research for his statistical help. A sincere thank you goes to Deborah
Porterfield, MD, MPH of the Department of Social Medicine for her confidence
in my abilities and constant encouragement. Of course, my deepest appreciation goes to my husband, Steven Grambow, PhD at the Duke Clinical Research Institute and Durham Veteran's Administration Biostatistics Department who
independently reviewed the study design and has given continuously of his time, patience, love and support.
Thanks also to attendees of the North American Primary Research Group meeting (where preliminary data was presented) in October 2003 Larry Green
INTRODUCTION
Rural residents, especially those in the rural south, suffer from poorer
baseline health status, less access to health care, and specifically less access to physicians than urban residents. 2• 3 4• 5 Over the past 30 years, although the
number of physicians has increased in all areas, the disparity between physician-to-population ratios in rural areas relative to urban areas has continually
worsened. 2• s-s Federal and state governments have attempted to address this
problem with programs that place physicians in areas with low physician-to-population ratios, presuming that additional physicians would translate into greater access to physician care in these areas. 6• 7 However it is not clear if
increasing the number of physicians alone improves local residents' access to care. 7, 9, 10
Access to Care
It is necessary to step back briefly to discuss the definition of "access
to care" before moving further forward with the more specific discussion of access to physician care. Defining access to care has been a career-long effort for
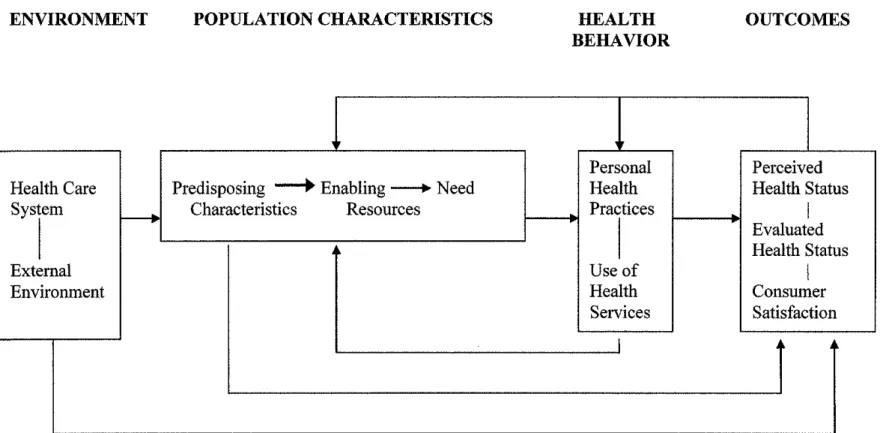
model developed by Ronald Andersen, Lu Ann Aday, and colleagues.11 This model (which has been revised and updated a number oftimes) proposes that characteristics of the health care system, the individual and the environment interact with the individual's resources and need for health care to influence their
personal health practices and use of health services.1• 12 One of the more recent
iterations of Andersen's model theorizes that a person's perceived health status,
evaluated health status, and satisfaction with health services depend on all of the aforementioned variables and then become part of the individual's "enabling resources and predisposing characteristics" feeding back in to their perceived
need for health care. (Figure 1 ).1 This idea that an individual's perceptions of oneself, one's health, and perceptions about medical care could affect one's
perception of need for medical care affects how we think about, discuss, and
measure access to care.
How to measure access to care has been debated for over 60 years.13 Many organizations (Institute of Medicine, Robert Wood Johnson Foundation, Rand Corporation, World Health Organization) appear to have settled upon
measuring access by asking people whether have had unmet medical needs, postponed care they thought they needed, whether they have a usual source of care, whether they have health insurance, whether they are satisfied with their
h h th h d . th d . '1 . 13·20
care, w et er ey ave seen a octor m e past year an smn ar questions.
L
There is usually some variation or addition to these questions depending uponwhat the researcher is studying (e.g. whether a child with special needs was able
immigrants, etc.14• 15•21) but a person's perception of need for medical care is
almost always assessed as a, or the, main outcome in studies of access to care.
Using perceived need for care as the main outcome or
measurement of access to care makes some important assumptions. For instance, asking someone whether there was a time in the past year when they "did not get needed medical care" assumes that he or she could accurately perceive need for
medical care (not always true with many common diseases such as hypertension, diabetes, depression, and hyperlipidemia). Another assumption inherent in the
questions about unmet or postponed care is that the subject believes that
allopathic medicine is efficacious. If a person does not have a positive view of allopathic medicine or physicians due to social, cultural, historical, or personal
experience then he or she may report a "satisfactory" level of access when there is
no access to care.
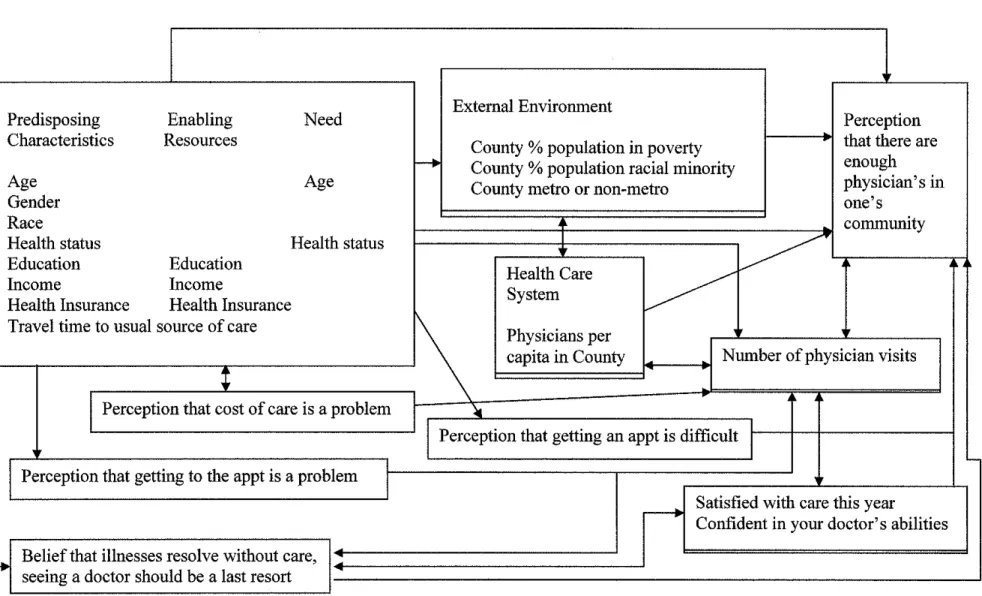
This concept of perceptions being due to one's experiences, individual
and environmental characteristics as well as affecting one's future actions and
future perceptions is illustrated in a modified model of access in Figure 2. This model represents the complexity of the dynamic interaction between mutable perceptions, immutable characteristics, and available resources all of which likely
affect perception oflocal physician supply.
Rural Physician Workforce Planning
The goal of rural physician workforce planners is to improve
not approach access to physician care in the same way that access to care
researchers approach their subject. Generally physician workforce researchers do not directly ask people whether they have adequate access to a physician or feel
they need more physicians in their area. Models and decisions about the number of doctors necessary to meet the health care needs of a community are generally
based on externally measured characteristics of communities and populations. Models and formulas developed by experts to determine the optimal physician-to-population ratio and specialty mix generally include county level data such as
distribution of age, gender, poverty level, as well as health indicator such as infant rtal. d I f hr . "lln . th . I ul . 7 9 22-26 1n th mo Ity rate an preva ence o c omc 1 ess m err ca c atwns. · ' e recent past, task forces and policymaking bodies have produced recommendations
on the reform and redistribution of the physician workforce based mainly on these factors. 22
Up until now, even those researchers who attempt a "patient-oriented" approach to estimate physician supply needs have used the tautology of previous utilization patterns as a proxy for patient demand or desire for care. 24 The
supposition is that by examining objective measures such as demographic characteristics and past behavior we can determine how many physicians are "enough." However, policymakers' understanding of people's needs is not
necessarily the same as people's understanding of their own needs. Perhaps
physician workforce plarmers should turn towards some more difficult, but
perhaps more relevant ways of assessing need for physicians-asking people what they think.
L
F-
There has already been a trend in physician workforce planning to tum away from what some call the "needs based model." This model supports
increasing physician supply in areas with fewer physicians based on a
theoretically ideal amount and type of services needed to maintain and promote the health of a population.25• 27 The dominant opposing model supports increasing
physician supply based on increasing utilization of care patterns, the perceived desire for more specialty care, a trend towards more technological interventions, and our national trend of continually increasing our spending on health care.28• 29
Again, neither side of the debate is considering people's perceived access to physician care.
Physician workforce planners on both sides of this debate have been criticized for not including actual "consumer viewpoints" in physician workforce needs assessments, as people's perceptions ofboth their access to medical care and the quality of care they receive have been shown to significantly affect their health care seeking behavior.9• 30• 31 However, it has been seen that higher
physician-to-population ratios do not necessarily imply greater access, and that access to physicians in rural areas may depend more on one's financial,
sociodemographic, and cultural background than has been previously
recognized.30•10 In one multivariate analysis, an elderly population's perceptions
perhaps we need to pay more attention to these potential barriers. Aetna! need
and perceived need cannot be effectively separated or easily defmed- and both must improve before access is improved.
How people in medically underserved areas perceive availability of medical care affects how, where, whether, and from whom they will seek care. In
the 1970s and 1980s stndies suggested that an individual's characteristics and
predisposing opinions or perceptions about medical care in general had more to do with perception of a need for more local physicians than the aetna! number of physicians nearby. 32• 33 Ronald Andersen posited that people's use of health
services is a function of their original predisposition to use services (in part determined by how they feel about medical care), along with their ability to
access care and their need for care.1 A stndy of data from the Illinois Health Survey in 1980 found that people with "positive attitndes about the medical system" were more likely to visit a physician when they perceived their symptoms
to be significant than those with negative attitndes towards the medical system?4
In a stndy by the Rand Corporation, small differences in patient satisfaction scores of previous medical care had a significant associations with whether they
would seek care in given hypothetical situations. 31 One stndy of physician utilization patterns in the elderly found that while a higher local
physician-to-population ratio was associated with a higher likelihood of visiting a physician, a stronger predictor of physician contact was not having "doubts about some things doctors say they can do for you." In another stndy of consumer perceptions of
inferior to those available in nearby urban settings and in many cases preferred to travel to these larger urban health facilities.35
Despite multiple research groups finding indications that certain attitudinal and background characteristics have as much to do with access to physician care as physician-to-population ratio, there has been little recent
research exploring this further. The models to date have studied one or two attitudinal characteristics and their association with a person's predisposition to
seek care and opinion about access to care. A more comprehensive model (Figure 2) may more closely reflect the complexities of the connections between individual characteristics, environmental characteristics, access to care, perception
of access to care, perception of number of physicians, and perceptions of and attitudes about health care attitudes.
Our aim is to further understand what factors are associated with the perception of physician supply adequacy. We do not suggest that perception of inadequate physician supply be considered a proxy for need for more physicians,
nor that the perception of an adequate number of physicians be considered "enough." We seek to understand what factors affect perceptions of availability
METHODS
Survey Instrument
Survey data were obtained by telephone interviews consisting of 89 questions about subjects' perceptions about health care and
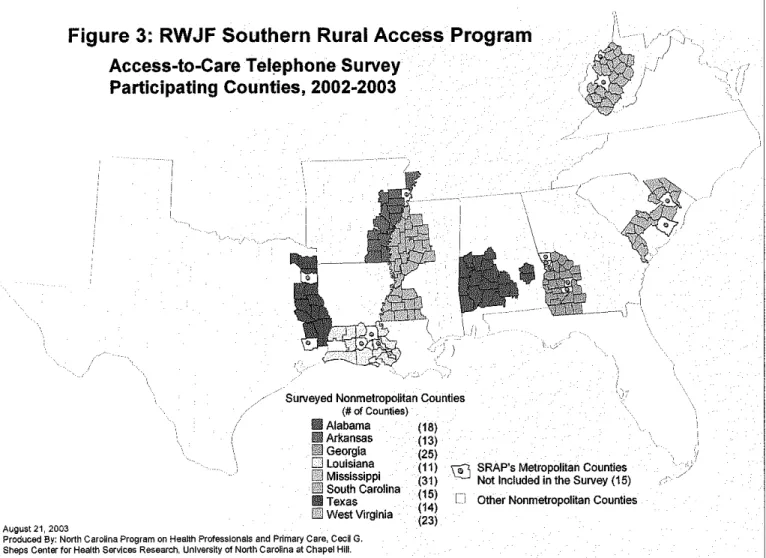
access-to-care fielded from November 2002 to July 2003 as part of the evaluation of the Robert Wood Johnson Foundation's Southern Rural Access Program (SRAP). The primary aim of the SRAP is to improve access to
basic health care in targeted rural areas of 8 states (Alabama, Arkansas, Georgia, Louisiana, Mississippi, South Carolina, eastern Texas, and West
Virginia-see Figure 3).3 Project leaders in each state selected counties for participation in the SRAP based on perceived local health needs and program feasibility in that area.
The survey was administered by Professional Research
Consultants, Inc. of Omaha, Nebraska (www.prconline.com). The survey sample was obtained using accepted random digit dialing techniques
within telephone exchanges in SRAP's ISO non-metropolitan counties
with over-sampling of residents in smaller counties. In each household reached, one English or Spanish-speaker over the age of 18 who had lived in the community for at least 12 months was randomly selected to participate. The overall response rate to the survey was 51.0%, with
the planned analyses, declaring them exempt due to the de-identification of individual data.
Dependent Variable: Enough doctors?
This study focuses on responses to one item on the questionnaire: "How much do you agree with the statement: I feel that there are enough doctors in my community?" Similarly worded items have been used in
national polls and surveys concerning access to health care. 37• 38 Response
options were "strongly agree", "agree," "neither agree nor disagree," "disagree," and "strongly disagree."
Independent Variables: Demographic, County, and Attitudinal
Characteristics
Demographic characteristics of the respondents included in our
study were age, gender, race, Hispanic ethnicity, educational attainment, income, self-reported health status, and presence of children under 18
living in household. (Figure 2 and Table 2) We also collected data on respondents' health insurance, number of visits to a physician in the past year, and travel time to their usual source of care. Prior studies have
found many of these variables to be related to perceptions about
h .. 13233
Analyses were performed at the county level because the survey data were collected and coded for counties, and 'physician shortage area'
designation is often calculated at the county level.
County characteristics included in this analysis were whether the county was adjacent to a metropolitan area, percentage of county
population that is of a racial or ethnic minority, and percentage of
population living below the federal poverty level. Physician (MD and DO) location data were taken from the Area Resource File (ARF), a
national health services information system containing information on more than 6,000 variables at the county level (Quality Resource Systems, Inc. 2000-2005 under contract to the National Center for Health
Workforce Analysis, Bureau of Health Profession within the Health Resources and Services Administration).39 We used the ARF total
number of clinically active physicians who were not federally employed (derived from the American Medical Association Masterfile for the year
2000 and the American Osteopathic Association 2001) and appended U.S. Census 2000 population information about our study counties to calculate physician-to-population ratios in each county. 7• 9• 40• 41 Ratio
values were divided into five categories (1 to 2::4,000, 1 to 3,999-3,000, 1 to 2,999-2,000, 1 to 1,999-1,000, and 1 to s999), a practically
interpretable scale for use in rural physician workforce planning. Because the physician population of interest was non-Federal and non-military,
system were dropped from our analysis (n= 69). The fmal population analyzed included 4,810 adults.
Six questions addressing perceptions about and experiences with
health care were whether the respondent: 1) considered cost of care a problem, 2) perceived getting an appointment within one or two days to
be difficult, 3) was satisfied with health care received in the past year, and 4) perceived that their doctors had the ability to help them. Early in data analyses the fifth and sixth question addressing perception of
medical were noted to be so highly correlated that they appeared to be measuring the same thing, so the decision was made to analyze them as
one perception (average of the two Likert scales). These two questions have been used together previously to assess an individual's readiness to
see a physician.34 The two questions were, "How strongly do you agree with the statement: 'If a person waits long enough, they can get over almost any illness without medical care.'?'; and "How strongly do you agree with the statement: 'A person should use doctors only as a last
resort.'?" All perception and experience item data were dichotomized from Likert scales.
Analysis
incomes below $15,000. Analyses were weighted for these variables and county sampling probabilities using Stata software (Intercooled Version
8.0, Stata Corporation, College Station, Texas).42•43
Race initially included all choices given to respondents: Native American, Asian, Pacific Islander, Black, White, Unknown, and Refused. There was also an ethnicity question asking the subject to self-identify as Hispanic, or nonhispanic. These categories were collapsed for fmal
analyses into White nonhispanic, Black nonhispanic, and Other based on our sample distribution. Likewise, educational attainment, income,
self-reported health status all had 5 or more response options in the original survey and were collapsed into a smaller number of categories or
dichotomized when possible in order to simplify analysis and prepare variables for more easily interpretable use in a multivariate logistic regression model.
Responses to the primary question about the perception of adequate number of doctors in the community were dichotomized into "agree" or "disagree," with the small proportion (5.2%) of respondents in the neutral category grouped with those who "agree." The decision to do
this was made only after the analyses were repeated three ways: frrst with
the neutral category excluded from analyses, next with the neutral group included within the "disagree" group and last with the neutral group included within the "agree" group. There was no difference in the main outcomes in any of these approaches, so the choice was made to include
i
L
r:::_
the neutral group within the "agree" group to comply with convention in
the field.
These responses were then correlated with the actual physician-to-population ratio in the respondent's county, individual respondents' characteristics, county characteristics, and individuals' perceptions of and
experiences with medical care, using chi-squared analyses for bivariate
comparisons.
Using Stata software's "survey logistic regression" command, which automatically adjusts analyses for the weighting variables and
accounts for the county sampling design mentioned earlier, we ran a logistic regression model to simultaneously adjust for all independent variables. The levelp < 0.05 was considered statistically significant. We
were interested in the relative contribution the physician-to-population ratio made to the variance of the full model, as compared with other
groups of variables, so we ran four partial models (isolating physician-to-population ratio, individual characteristics, county characteristics, and perceptions of and experiences with health care) to compare how much
their partial pseudo
r
contributed to the full model's pseudo r2•Based on previous studies' findings that predisposing perceptions of and demographic characteristics could contribute as much to access as
physician-to-population ratio, the intent was to examine this sample for
evidence of a similar pattern. The Primary Investigator of the original dataset advised the inclusion of county characteristics in the analyses to
,--look for effects that might be based on local demographic differences. After examining the results of standard multivariate logistic regression model with all of the selected variables, partial logistic regression models were run to see how much variance could be explained by each group of
characteristics by itself: Individual demographic characteristics, County characteristics, and predisposing perceptions of and experiences with medical care. After reviewing literature concerning the influence of
primary care physicians on health outcomes,27• 44 it was decided to do a
post-hoc analysis of the question, comparing perception of physician supply to actual primary care physician (PCP) supply, specialist supply, and total patient care physician supply.
i
RESULTS
Descriptive Statistics
Most subjects were between 30 and 64 years old (average age 47.1) with more women (57.1%) than men in the weighted sample. The majority of subjects were White, about one-third Black and 2.8% other
races. Most (75.0%) felt they were in good or excellent health and about half ( 46.6%) of the sample reported household incomes ofless than $25,000 per year. Over half(57.8%) of the households surveyed had
children under 18. About a quarter (25.7%) of the sample had no
visits to a physician over the past year, and the majority (81.9%) lived
within 30 minutes of their usual place of care (Table 1).
Responses to the primary question, "How much do you agree
with the statement 'I feel there are enough doctors in my community?" were evenly divided with about half answering "strongly disagree" or "somewhat disagree" ( 45.7% ), and about half "strongly agree" or
"somewhat agree" ( 48.2%). The 5.1% of respondents who answered "neither" were grouped with "agree" for analyses (Figure 1 ).
Bivariate results
Almost half ( 49.3%) of respondents living in a county clearly
qualifYing as a medically underserved area (1 physician to > 4,000 people) believed there were enough doctors in their area while an only modestly higher proportion (59.4%,p=.005) of respondents felt this way
in areas with much higher physician-to-population ratios (1 physician to less than 1,000 people). (Figure 2)
)
r
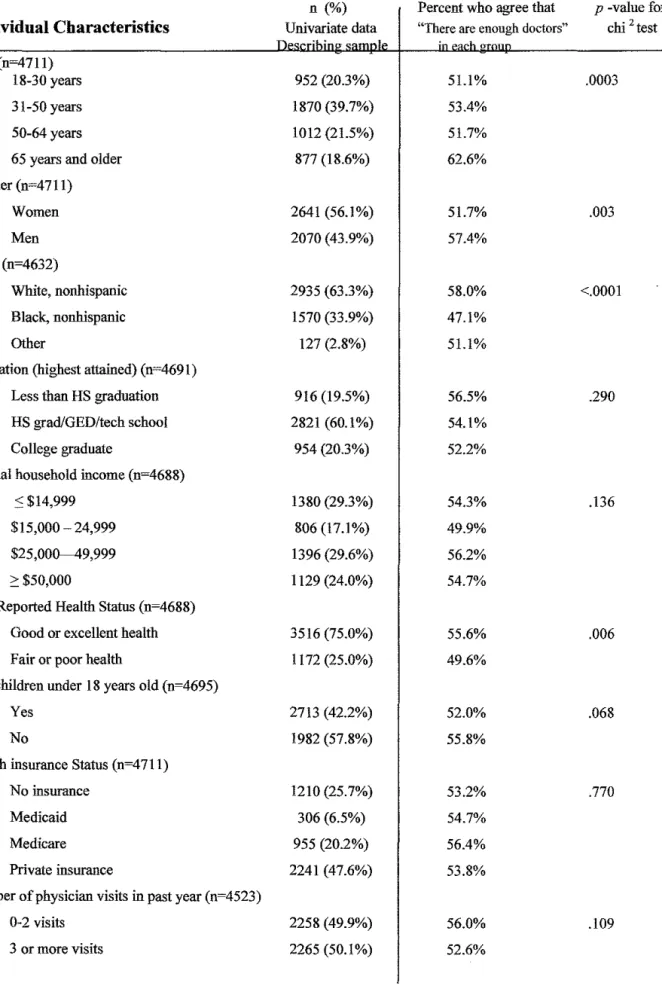
Bivariate analysis revealed that those who were more likely to
perceive an adequate local physician supply were male, older than 65,
White, in good or excellent health, and traveled less than 30 minutes to
care (Table 1). The perception of adequate physician supply was not L related to educational level, income, having children in the household,
insurance status or number of doctor visits in the past year. County-level
L
local physicians included a higher physician-to-population ratio, lower poverty rate, and a lower percentage of racial and ethnic minorities.
All of the questions about perceptions of and experiences with medical care were significantly related to the belief that there were enough physicians in the community. Respondents were more likely to feel there were enough doctors in their community if they reported that
the cost of care was not a problem (58.1% vs. 42.4% of those who reported that cost of their care was a problem, p <.0001). Subjects who reported that it was easy to get an appointment were also more likely to
feel there were enough doctors in their community versus those who
reported that this was difficult (55.8% vs. 44.6%, p =.0007). Those who expressed satisfaction with their health care and confidence in their doctor were also more likely to believe that there were enough local
physicians than those who did not (55.7 vs. 36.3%, p < .0001 and 57.2% vs. 43.6%, p < .0001). Further, people who believed seeing a doctor should be one's last resort were more likely to feel there were enough
doctors than those who felt that one should see a physician early with problems (68.0% vs. 51.1 %, p<.0001).
Multivariable results
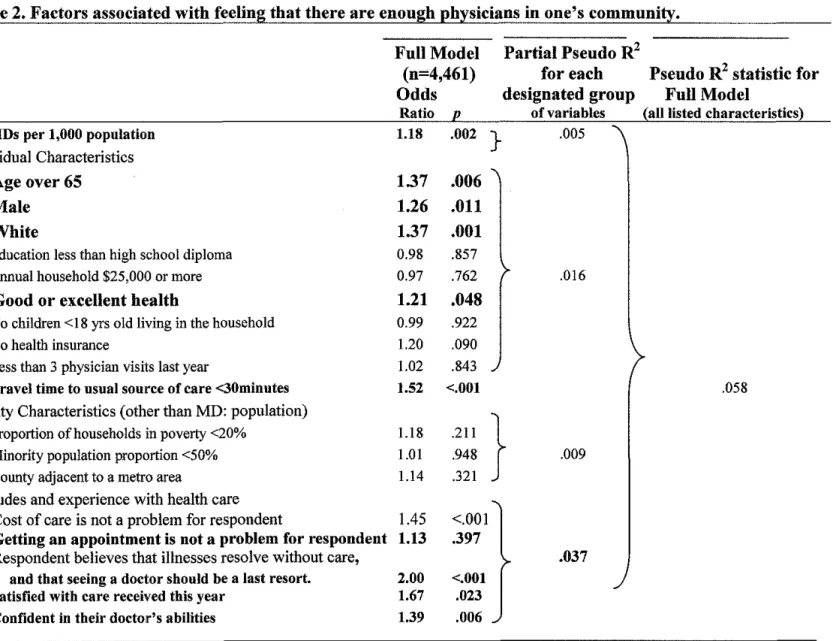
The full logistic regression model adjusting for all of our
physician supply as the bivariate chi2 models (male, older than 65, White,
in good or excellent health, and traveled less than 30 minutes to care). The only county characteristic that had a significant association when adjusting for all variables was the physician-to-population ratio. All of
the perceptions of and experiences with health care variables except for the "getting an appointment is/is not a problem" variable were
significantly associated with perception of physician supply, with those
who believed that "illnesses resolve with time and seeing a physician should be the last resort" being much more likely (OR 2.0, p <.001) to
feel there were enough physicians.
In an attempt to isolate the relative importance of individual demographic characteristics, county characteristics, and perceptions of
and experiences with health care, each of these groups of characteristics was tested in a model alone, without adjusting for the other two groups of
characteristics. To assess the stability of the model and the relationships between the dependent and independent variables, we also analyzed this
data with a more traditional backward elimination logistic regression. The outcomes ofthose models were the same.
The partial pseudo
r
analyses allows a ranking of the groups ofvariables in our model according to their contribution to the variance in whether people felt there were enough doctors in their community. The groups of variables who contributed most to people's perceptions of
whether there were enough doctors in their community were, in order: 1.)
L
r:::::
~-i
i
Perceptions and experiences with health care, 2.) Individual
characteristics, 3.) county physician-to-population ratio, and 4.) other
county characteristics. The overall pseudo r2 of the full model was .058.
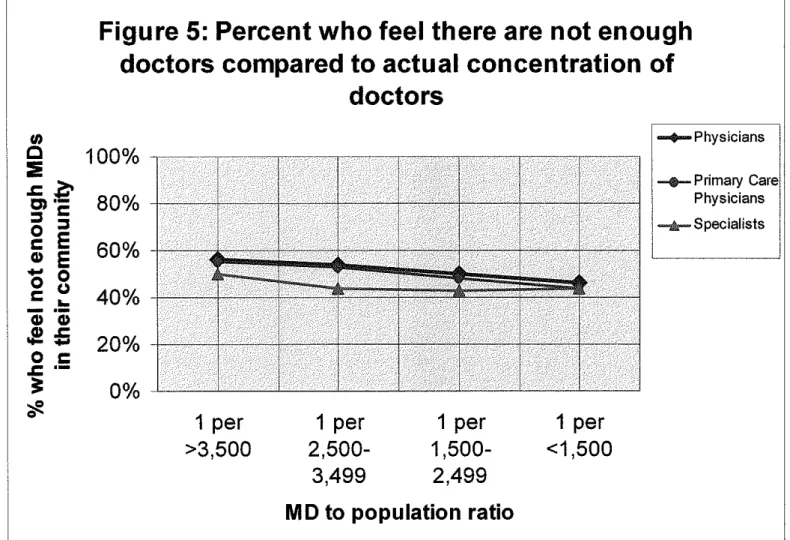
Post-hoc analysis
In a bivariate comparison looking at the percentage of people who felt there were not enough physicians in their area against the ratio of
PCPs, specialists, and all physicians to the county population the relationship was not tightly associated with the ratio of primary care physicians: population. In other words, as the supply of primary care
physicians went up, the number of people who felt there were not enough physicians went down (Figure 5). This relationship was not clear or
consistent for specialists. However, none of these relationships were statistically significant and the numbers of specialists in the areas we
studied was quite small, so these analyses will not be included in the paper we submit for publication.
DISCUSSION
People's perception that there are or are not enough doctors in
race, gender, travel time to care, and whether respondents felt they could afford care. We also found that people who perceived a lack oflocal physicians were more likely to be dissatisfied with and less confident in the care they had received in the past year.
Limitations
When asked whether there were enough doctors in their community, it is likely that for many the term "community" evoked geographic or social demarcations other than county, which is the geographic unit for which we had "community" in our analyses. This sample consisted of rural Southern counties selected in part due to problems with health care access. Therefore our results may not
generalize to more urban areas or areas with better access to health care. Our telephone survey used landline telephone numbers only, thereby excluding household without a phone or with only a cellular phone from participation. It is not yet known how or whether the prevalence of cell phone use may bias data in phone surveys, especially in a mral Southeastern population.
who lived in areas with 1 physician for every 250 or 500 people were surveyed we would have found a closer association between perception
of physician supply and actual physician supply. However, due to the
nature of the original sample, few people were surveyed who lived in areas with a high physician-to-population ratio. There may be a
threshold effect for physician-to-population ratio above which people's perceptions more closely reflect actual physician-to-population ratio and
perhaps we did not have the proper population or region in which to
detect this.
In the results section, while the partial models and (!analyses show
that more of the variance was explained by 'perception of and experience
with medical care' characteristics than any other group of variables, we also see that all of the variables in the model taken together only explain .058 of the total variance between groups who felt there were enough physicians compared to those who did not. While all variables
hypothesized to have any relationship to people's perceptions about adequacy of physician supply were included in the full model, there may be variables that we did not include that contribute to this variance, or the
association may be in large part random.
Strengths and Implications
L
alone do not necessarily imply greater speed of access, while the geographic distribution of physicians (among other factors) in rural
areas does play a role in access to care.9 In order to expedite access, the physician's office must be convenient and potential patients must have transportation to the office. The frustration that may ensue from the perception that there are not enough local doctors or that getting to a
local physician is difficult may contribute to dysfunctional care seeking behavior such as postponing care or increasing the use of the
emergency room.
Neither the needs-based model nor the demand-based model of
workforce planning takes into account the complex interplay of needs, wants, and perceptions as they relate to the adequacy of the physician workforce. Needs-based proponents would say that we have evidence-based recommendations about the minimal amount of medical care
needed for preventive health and should train enough doctors to assure this care. Demand-based proponents would argue that as people use
more care, we should attempt to provide more doctors. However, it may be the case that the "problem of not having enough physicians" would be
A central goal in physician workforce planning is to improve access to physician as a means of facilitating appropriate use of health care. If people do not feel they have "enough" local physicians, we need to understand precisely what factors are influencing this sense of
inadequacy before we strive to frx it. As Andersen and Agnire pointed out almost 25 years ago, financing programs to help people pay for their care may do as much to improve people's satisfaction with access to care
as increasing the physician-to-population ratio. Developing programs to address cost of care, distance or transportation to care, and people's
confidence in and satisfaction with medical care may improve perception of access with minimal increases in the physician workforce.
People's perceptions are important in their own right, as they are
associated with behavior and with satisfaction, which is now considered by most to stand alone as a health care outcome.4547 The "consumer
viewpoint" when it comes to medical manpower has largely been ignored since the late 70's I early 80's, when there was a call for more research in this area.30 This study addresses the question in a unique way in an
underserved population.
Outcomes in access to care models (Figure 1) may become more difficult to define if we acknowledge the loop: perception of care affects
care-seeking and experience with care affects perception of care (Figure 2). However,
that satisfaction with care is highly associated with many other satisfaction
variables ... which may all have their root in pre-existing attitudes.
Though the available dataset did not have adequate numbers of specialists and primary care physicians to detect it, analyses indicated that there may be a closer association between people's perception of physician supply and primary care physician-to-population ratios than
total patient care physician-to-population ratio. If people's perception of physician supply is better with higher numbers of primary care
physicians and is not related to numbers of specialists this might indicate
REFERENCES
1. Andersen RM. Revisiting the behavioral model and access to medical care: does it matter? J Health Soc Behav. Mar 1995;36(1):1-10. 2. Felix H, Shepherd J, Stewart MK. Recruitment of rural health care
providers: a regional recruiter strategy. J Rural Health. 2003; 19 Suppl:340-346.
3. Beachler M, Holloman C, Herman J. Southern Rural Access Program: an overview. J Rural Health. 2003;19 Suppl:301-307.
4. Hartley D, Quam L, Lurie N. Urban and rural differences in health insurance and access to care. J Rural Health. Spring 1994;10(2):98-108. 5. Rosenblatt RA, Hart LG. Physicians and rural America. West J Med. Nov
2000;173(5):348-351.
6. Kindig DA, Movassaghi H. The adequacy of physician supply in small rural counties. Health Aff (Millwood). Summer 1989;8(2):63-76. 7. Frenzen PD. The increasing supply of physicians in US urban and rural
areas, 1975 to 1988. Am J Public Health. Sep 1991;81(9):1141-1147. 8. Salsberg E. Physician workforce policy guidelines for the U.S. 2000-2020.
Paper presented at: Council on Graduate Medical Education Meeting; September 17-18,2003, 2003; Bethesda, MD.
9. Jacoby I. Geographic distribution of physician manpower: the GMENAC (Graduate Medical Education National Advisory Committee) legacy. J
Rural Health. 1991;7(4 Suppl):427-436.
10. Rosenblatt RA. Quality of care in the rural context: a proposed research agenda. J Rural Health. 2002;18 Suppl:176-185.
11. Aday LA, Andersen RM. Development of Indices of Access to Medical
Care. Anu Arbor: Health Administration Press; 1975.
12. Andersen R. Behavioral Model of Families' Use of Health Services. Chicago, IL: University of Chicago; 1968.
13. Berk ML, Schur CL. Measuring access to care: improving information for policymakers. Health Aff (Millwood). Jan-Feb 1998;17(1 ): 180-186. 14. Cunningham P, Hadley J. Expanding care versus expanding coverage:
how to improve access to care. Health Ajf (Millwood). Jul-Aug 2004;23(4):234-244.
15. Kogan MD, Newacheck PW, Honberg L, Strickland B. Association between underinsurance and access to care among children with special health care needs in the United States. Pediatrics. Nov 2005;116(5):1162-1169.
16. Bindman AB, Grumbach K, Osmond D, eta!. Preventable hospitalizations and access to health care. Jama. Jul26 1995;274(4):305-311.
17. Steams SC, Slifkin RT, Edin HM. Access to care for rural Medicare beneficiaries. J Rural Health. Winter 2000;16(1):31-42.
19. Murray C, Frenk J. World Health Report 2000: a step towards evidence-based health policy. Lancet. May 26 2001;357(9269):1698-1700.
20. Access to Health Care in America. Washington, DC: Institute of
Medicine, Committee on Monitoring Access to Personal Health Care Services; 1993.
21. Marshall KJ, Urrutia-Rojas X, Mas FS, Coggin C. Health status and access to health care of documented and undocumented immigrant Iatino women. Health Care Women Int. Nov-Dec 2005;26(10):916-936.
22. Rivo ML, Jackson DM, Clare FL. Comparing physician workforce reform recommendations. JAMA. Sep 1 1993;270(9): 1083-1084.
23. Vitiello JR, Levary RR. Determining the optimal physician mix in health maintenance organizations. J Med Syst. Aug 1997;21(4):249-266.
24. Pathman DE. Estimating rural health professional requirements: an assessment of current methodologies. J Rural Health. 1991 ;7( 4 Suppl):327-346.
25. Rosenblatt RA, Lishner DM. Surplus or shortage? Unraveling the physician supply conundrum. West J Med. Jan 1991;154(1):43-50.
26. Carlsen F, Grytten J. Consumer satisfaction and supplier induced demand.
J Health Econ. Sep 2000;19(5):731-753.
27. Shi L, Macinko J, Starfield B, Politzer R, Wulu J, Xu J. Primary Care, Social Inequalities, and All-Cause, Heart Disease, and Cancer Mortality in US Counties, 1990. Am J Public Health. Apr 2005;95(4):674-680.
28. Cooper RA. Weighing the evidence for expanding physician supply. Ann
Intern Med. Nov 2 2004;141(9):705-714.
29. Cooper RA, Stoflet SJ, Wartman SA. Perceptions of medical school deans and state medical society executives about physician supply. Jama. Dec 10 2003;290(22):2992-2995.
30. Andersen R, Fleming GV, Aday LA, Aguirre M, Fearon Z. The consumer
viewpoint: "What is health care and what do we want?" & A Response.
Hyattsville, MD: Graduate Medical Education National Advisory Committee; September 1979. (HRA) 79-632.
31. Ware JE, Jr., Davies AR. Behavioral consequences of consumer
dissatisfaction with medical care. Eva! Program Plann. 1983;6(3-4):291-297.
32. Stoller EP. Patterns of physician utilization by the elderly: a multivariate analysis. Med Care. Nov 1982;20(11):1080-1089.
33. Ahearn MC. Factors affecting the consumer satisfaction with the
availability of medical care. [Master of Science]. State College:
Agricultural Economics and Rural Sociology, Pennsylvania State University; 1978.
34. Sharp K, Ross CE, Cockerham WC. Symptoms, beliefs, and the use of physician services among the disadvantaged. J Health Soc Behav. Sep
1983;24(3):255-263.
36. CASRO. Council of American Survey Research Organizations Code of Standards and Ethics for Survey Research. Available at:
http://www.casro.org/codeofstandards.cfin. Accessed March 9, 2005.
37. American Medical Association poll (Roper Center July 24, 1981) .
38. Harvard School of Public Health survey IJCR poll August 16, 2000.
39. Area Resource File. Available at: http://www.arfsvs.com/main.htm. Accessed October 30, 2005.
40. Health Resources and Services Administration, Bureau of Health Professions, Area Resource File (ARF) System, (Fairfax, VA: Quality Resource Systems, Inc., 2003).
41. United States Census 2000. Available at:
http://\V\vw.census.gov/main/www/cen2000.html. Accessed October 30, 2005.
42. CyBulski K, Sinclair M, Potter F, Ciemnecki A. Adjusting for
Nonresponse Among Medicaid Households That Could Not Be Located or Were Located but Did Not Participate in the Minnesota Managed Care Survey. Available at: http://www.jpsm.umd.edu/icsn/papers/cybulski.htm. 43.
44. 45. 46.
47.
Accessed October 26, 2004.
Thomas R, Purdon S. Telephone Methods for Social Surveys. Available at: http://www.soc.surrev.ac.uk/sm/SRU8.html. Accessed October 26, 2004.
Starfield B. Primary care and health. A cross-national comparison. Jama.
Oct 23-30 1991;266(16):2268-2271.
Vuori H. Patient satisfaction--an attribute or indicator of the quality of care? QRB Qual Rev Bull. Mar 1987;13(3):106-108.
Corbella Jane A, Maturana Dominguez S. Citizens' role in health services: satisfaction behavior: Kano's model, Part I. Qual Manag Health Care.
Jan-Mar 2003;12(1):64-71.
Corbella Jane A, Maturana Dominguez S. Citizens' role in health services: satisfaction behavior: Kano's model, Part 2. Qual Manag Health Care.
Jan-Mar 2003;12(1):72-80.
L
,---[
Figure 1: Andersen's Emerging Model of the Behavioral Model of Access to Health Care (1995)
1ENVIRONMENT POPULATION CHARACTERISTICS
Health Care Predisposing
--+
Enabling - - Need System~ Characteristics Resources
I
External Environment'
HEALTH BEHAVIOR
Personal Health Practices
I
Use of Health ServicesI
Journal of Health and Social Behavior 1995, Vol36 (March): 1-10.
OUTCOMES
Perceived Health Status
I
Evaluated Health StatusI
Consumer SatisfactionFigure 2: Proposed (Modified from Andersen) Model of Access
POPULATION CHARACTERISTICS ENVIRONMENT
Predisposing Enabling Need External Environment Perception
Characteristics Resources County % population in poverty that there are
!---+
County % population racial minority enoughAge Age County metro or non-metro physician's in
Gender one's
Race community
Health status Health status
•
~~
Education Education
Health Care
Income Income
System Health Insurance Health Insurance
Travel time to usual source of care
~
Physicians percapita in County Number of physician visits
:
I
Perception that cost of care is a problem ~Perception that getting an appt is difficult
I
'-Perception that getting to the appt is a problem
I
Satisfied with care this year--+
Confident in your doctor's abilities
Figure 3: RWJF Southern Rural Access Program
Access-to-Care Tel~phone Survey Participating Counties, 2002-2003
Swveyed NonmetropoUtan Counties
(#of Counties)
\_-,_/
II Alabama
1111 Arkansas
Ill Georgia
D Louisiana
Lill Mississippi
~ South Carolina
111 Texas
(18) (13) (25) (11) (31) (15) (14) (23)
\:!] SRAP's Metropolitan Counties
Not Included in the Survey (15) [] Other Nonmetropolitan Counties
till] West Virginia
August21, 2003
Produced By: North Carolina Program on Health Professionals and Primary Care, Cecil G. Sheps Center for Health Services Research, University of North Carolina at Chapel Hill.
Figure 4:
Percentage who Agree "There are enough doctors in my community." Compared to their County Physician-to-Population Ratio (p=.005)100% -.Increasing physician density-.
00%
I
80%
I
-- ...
70% . . . •· . <
sa.:i%·· ..
· .
a
= .
60% .
49,3%
Ait· QO/..; All!' AOI50% 40%
30%
20%
10%
0%
1
to
> 3,999 1to
3,000-3,9991
to
2,000-2,999L
c
Table 1. Summary Univariate Statistics (n=weighted counts), and Bivariate Analysis-
'-Percent in each group who agreed "I feel there are enough doctors in my community."n (%) Percent who agree that p -value for
Individual Characteristics Univariate data "There are enough doctors" chi 2test Age (n'"4711)
18-30 years 952 (20.3%) 51.1% .0003 31-50years 1870 (39.7%) 53.4%
50-64 years 1012 (21.5%) 51.7% 65 years and older 877 (18.6%) 62.6% Gender (n=4 711)
Women 2641 (56.1%) 51.7% .003 Men 2070 (43.9%) 57.4%
Race (n'"4632)
White, nonhispanic 2935 (63.3%) 58.0% <.0001 Black, nonhispanic 1570 (33.9%) 47.1%
Other 127 (2.8%) 51.1% Education (highest attained) (n'"4691)
Less than HS graduation 916 (19.5%) 56.5% .290
~
HS grad/GED/tech school 2821 (60.1%) 54.1%..
~" College graduate 954 (20.3%) 52.2%I
Annual household income (n=4688)r
:S $14,999 1380 (29.3%) 54.3% .136 $15,000-24,999 806 (17.1%) 49.9%
$25,000--49,999 1396 (29.6%) 56.2% 2:$50,000 1129 (24.0%) 54.7%
~
Self-Reported Health Status (n=4688)
Good or excellent health 3516 (75.0%) 55.6% .006 Fair or poor health 1172 (25.0%) 49.6%
Has children under 18 years old (n=4695)
Yes 2713 (42.2%) 52.0% .068 No 1982 (57.8%) 55.8%
Health insurance Statns (n'"4711)
No insurance 1210 (25.7%) 53.2% .770
~
Medicaid 306 (6.5%) 54.7% Medicare 955 (20.2%) 56.4%
Private insurance 2241 (47.6%) 53.8%
Number of physician visits in past year (n=4523)
L
' ~
Typical travel time to care (n~4659) ~
30 minutes or less 3817 (81.9%) 43.9% <.0001 Greater than 30 minutes 842 (18.1%) 44.7%
n (%) Percent who agree that p -value for
County Characteristics Univariate data "There are enough doctors" chi 2test Describing sample in each group
Number of active MDs in county (n~4697)
1 MD per more than 4,000 people 166 (3.5%) 49.3% .006 I MD per 3,000-3,999 people 267 (5.7%) 53.1%
1MD per 2,000-2,999 people 453 (9.6%) 45.4% I MD per 1,000-1,999 people 2075 (44.2%) 53.2% 1 MD per less than 1,000 people 1736 (37.0%) 59.4% Percent poverty in county (n~4711)
0-20% 2059 (43.7%) 58.4% .012 20-36% 2653 (56.3%) 50.9%
Percent racial minorities in county (n~4 711)
<50% 3164 (67.2%) 56.5% .021 2:50% 1547 (32.8%) 49.4%
~
Adjacent to Metropolitan Area (n~4711)
L
Yes 3077 (65.3%) 54.2% .234
I
ii
No 1634 (34.7%) 51.4% !'"
Health care attitudes n (%) Percent who agree that p -value for
and experiences Univariate data "There are enough doctors" chi 2test Describing sample in each group
How mucn ot a proOJem IS cost ot care? (n 4o5o J
Not a problem/minor problem 3490 (75.0%) 58.1% <.0001
Somewhat a problem/great problem 1166 (25.0%) 42.4%
f
How difficult is it to get an appointment? (n~4530)Very easy/easy 3932 (86.8%) 55.8% 0.0007 Somewhat difficult!V ery difficult 598 (13.2%) 44.6%
Believes most illnesses resolve without medical care, doctors should be used ouly as last resort. (n~4685)
Disagree 3 834 (18.2%) 51.1% <.0001
Agree (Doctors are last resort) 851 (81.8%) 68.0%
L
Satisfied with your care this year? (n~4660)Very/Mostly 4304 (92.3%) 55.7% <.0001 Somewhat/Not at all 356 (7.7%) 36.3%
Confident in your doctor's abilities? (n~4664)
Table 2. Factors associated with feeling that there are enough physicians in one's community. MDs per 1,000 population
Individual Characteristics Age over65
Male White
Education less than high school diploma Annual household $25,000 or more
Good or excellent health
No children <18 yrs old living in the household No health insurance
Less than 3 physician visits last year
Travel time to usual source of care <30minutes County Characteristics (other than MD: population)
Proportion of households in poverty <20% Minority population proportion <50% County adjacent to a metro area
Attitudes and experience with health care Cost of care is not a problem for respondent
Getting an appointment is not a problem for respondent Respondent believes that illnesses resolve without care,
and that seeing a doctor should be a last resort. Satisfied with care received this year
Confident in their doctor's abilities
Full Model (n=4,461) Odds
Partial Pseudo R2
for each Pseudo R2 statistic for designated group Full Model
Ratio p of variables (all listed characteristics) 1.18 .002 } .005
1.37 .006 1.26 .011 1.37 .001 0.98 .857
0.97 .762 .016 1.21 .048
0.99 .922 1.20 .090 1.02 .843
1.52 <.001 .058 1.18 .211 }
1.01 .948 1.14 .321
.009
'
1.45 <.001 1.13 .397
.037 2.00 <.001
1.67 .023 1.39 .006
Figure 5: Percent who feel there are not enough
doctors compared to actual concentration of
doctors
Ill ... Physicians
~--~---C
100%
-~-~--~
-
----~
I-.-Primary Care
:::!E , Physicians
1
"§,
:;, c
~
80%
! ... specialistsI
Ic
E
60%-Cl)
E
0
=
t=:::~~~S:~:,;;:~~~~~~~~~~=:=:
... 0g
u
..
40%
a;
·a;
.!
=
20%
0
c
i ·-
0%
l_~~~jL~_L~_L~~~~--~----~
0