Sharif University of Technology
Scientia IranicaTransactions E: Industrial Engineering www.scientiairanica.com
Research Note
A new approach based on queuing theory for solving
the assembly line balancing problem using fuzzy
prioritization techniques
S. Khalili, H. Mohammadzade and M.S. Fallahnezhad
Department of Industrial Engineering, University of Yazd, Yazd, P.O. Box 89195-741, Iran. Received 25 November 2013; received in revised form 31 August 2014; accepted 3 February 2015
KEYWORDS Assembly line balancing; Queuing theory; Fuzzy prioritization technique;
Scenario building.
Abstract. Determining the number of operators for manufacturing operations is important in assembly line balancing. Optimal allocation of manpower increases production eciency, thus, increasing prots of the companies. Since there is a possibility to assign dierent numbers of machines to each operator, a variety of scenarios of machine assignment to operators will occur. Our goal in writing this paper is to help managers choose the best possible scenario. In this model, each of the possible scenarios is modeled using the principles of queuing theory, and costs and revenues for each of these scenarios are calculated. Since uncertainty is an important part of the manufacturing environments, a fuzzy logic model is proposed to consider the uncertainty in problem. Since some inputs of the model, such as service rate and arrival rate, are fuzzy, prot of the model will be a fuzzy number. Therefore, we use fuzzy ranking methods for prioritizing the scenarios. © 2016 Sharif University of Technology. All rights reserved.
1. Introduction
In recent decades, because of the growth of industrial automation systems in manufacturing plants, manual machinery that requires work and continual monitoring of operators is replaced by semi-automatic and fully automatic machines. Most of these machines have automatic production operations and operators are used at the times of loading, unloading, and machine setting. Even some of them work fully automatically with no need for the operator. In such situation, an operator will be able to manage multiple machines in order to increase their eciency. But the main question is that how many machines should be assigned to each operator? In fact, if the managers assign a *. Corresponding author. Tel.: +98 35 31232548;
E-mail addresses: [email protected] (S. Khalili); [email protected] (H. Mohammadzade); [email protected] (M.S. Fallahnezhad)
small number of machines to each operator, it may increase the labor costs. On the other hand, if the managers assign a large number of machines to each operator, although it appears to reduce the cost of re-cruitment and deployment of manpower, the eciency of machinery and eciency of assembly line reduce and consequently, it reduces the prot of companies due to lost production. In this study, an approach dierent from traditional methods of assembly line balancing systems [1-5] and methods, such as the use of man-machine systems [6], is presented. In these approaches, in addition to the cost of manpower and machinery unemployment [7], the cost resulting from queued work in process behind machines and workstations, and consequently increased production time, and the costs of lost prot have been considered with regard to the optimal number of machines that should be allocated to each operator. Also, the assumption of having crisp data, which is one of the major weaknesses of the classical model, is resolved with the help of fuzzy
logic [8] and parameters such as arrival rate of product and service rate of operators that may not always be deterministic [9] and are considered as fuzzy numbers. This article is organized as follows: Section 2 is devoted to the literature review of this concept. Section 3 describes the proposed model. Ranking fuzzy numbers is the topic of Section 4. In Section 5, a numerical example is presented for clarication purposes. Also, a sensitivity analysis is performed on the parameters of the model. Authors' Conclusion and suggestions for future research are given in Section 6.
2. Literature review
Generally, production resources can be categorized into three main categories including machinery, raw mate-rials, and operators. With an overview of the research done in the eld of manufacturing resources, it is seen that many studies have been done for planning raw materials and machines [10,11]. But another important issue that has usually been ignored is the ecient management of human resources. Especially this issue is important when we face expensive equipment in assembly line [12]. Decision-making and planning in the eld of human resource management are done at two levels:
1. Long-term planning necessary to determine the number of line operators;
2. A short-term assignment of operators [13].
A number of researchers have categorized the operators assignment problem into two parts and have considered each part individually. These parts are time study of operator and assignment of operators. In short, assign-ment of operators is associated with the issue that each operation will be done by who and where, but the time study of operators deals with the time of performing operation [14]. In most studies, operator assignment problem is originally formulated as a mixed integer programming problem and it is solved by heuristic algorithm. Vembu and Srinivasan [15] proposed a heuristic algorithm to minimize the production cycle time for manpower assignment problem where they focused on JIT production systems. Bhaskar and Srinivasan [16] proposed a mixed integer programming model for solving the operator assignment problem in a cellular manufacturing system. They also balanced the workload among the cells to minimize the production cycle time. Suer and Bera [12] proposed a heuristic algorithm to solve two-stage mixed integer program-ming model for optimal assignment of operators to production cells. In this model, they used uncertain information, and the goal was to minimize total cost. Nakade and Ohno [17] solved the operator assignment problem in a U-shape production line. Their model
assumed that operators with multiple skills existed and also their aim was to minimize the cycle time with consideration of non-deterministic process. Chauvet et al. [18] solved the problem of operator assignment when time of operation was dependent on the operator. Their goal was to minimize the completion time. Hung and Chen [13] proposed a dynamic approach for the management of human resources and using the simulation model, they showed that if the operators are assigned among all stations based on the needs of stations and the rate of service for machinery, then the eectiveness can also improve. Yang et al. [19] presented a simulation-based dynamic strategy for assignment of operator that considered problems such as setup time, work in process, and interaction of operator with the machine and also considered the random conditions of production systems. Ertay and Ruan [20] presented an approach for decision-making based on Data Envelopment Analysis (DEA) to determine the required number of operators in U-shape cellular manufacturing systems. They evaluated each decision-making unit using simulation. Song et al. [21] proposed a method for the optimal assignment of manpower in assembly line balancing with regard to the eectiveness of multi-skilled operators. They proposed recursive algorithm for the problem of assign-ing operators to develop feasible solutions. Yang et al. [22] used two-criterion decision-making method and fuzzy TOPSIS method for solving operator assignment problem and they used both methods of hierarchical analysis to determine the weights of criteria. Kuo and Yang [23] focused on the problem of optimizing assignment of multi-skilled operators in a production line and presented a mixed integer programming model. In the eld of using queuing models in production environments, much work has been done, but most of the research is about inventory control and achieving optimal inventory levels, optimizing storage capacity and the sequence of operations. For example, Chen [24] presented a fuzzy queuing model with consideration of customer arrival capacity constraints, where the customer arrival rate and service rate of customers were considered in the form of trapezoidal fuzzy numbers, and nally, he determined membership function using -cut method and Zade's extension principle to solve linear programming method in order to determine the optimal parameters of the model. Also, Chen in another article [25] presented a parametric linear programming model for fuzzy queuing system in which service rate and arrival rate were both fuzzy. He used -cut for determining the membership function and validated his method in FM/FM/1 and FM /FMk/1 models, which are used in transportation
management. Chen [26] in another article proposed a mathematical programming approach for machine interference problem in which some parameters were
fuzzy. Fuzzy parameters in this model were machine failure rates and service rates. He formulated a pair of mathematical programs based on the extension principle to calculate the upper and lower limits of the -level performance measures. Also, Chen in another article [27] presented a queuing model in which the arrival rate of customers to the system, the cost of providing service to clients, and also the cost of delaying service to customers were trapezoidal fuzzy numbers. He integrated -cut method, Zade's extension principle, and non-linear integer program-ming to determine service rates with respect to a cost function. Gani and Kumar [28] presented a method for constructing membership functions for measuring the performance of queuing systems when dierent batch sizes entered the system, where the arrival rate, service rate, and the size of batches were fuzzy numbers. In this method, a nonlinear integer programming was presented to calculate the lower limit and upper limit for the performance using -cut method and Zade's extension principle. Ke et al. [29] presented a fuzzy model for a queuing system in which the customer arrival rate, service rate, down time of server, and batch size were trapezoidal fuzzy numbers. Finally, using -cut method and Zade's extension principle and solving the model using parametric nonlinear programming, optimal parameters were determined. Ke and Lin [30] and Kumar [31] presented fuzzy models for the queuing system in which the arrival rate, customer service rate, failure rate, and repair rate were fuzzy numbers and the server was assumed to be unreliable. Finally, to determine the optimal parameters of the problem, they used -cut method and Zade's extension principle and fuzzy nonlinear programming. Lin et al. [32] analyzed queuing systems with consideration of the setup time of server. In this model, arrival rate and setup rate were assumed to be fuzzy. Yao and Chiang [33] pro-posed an economic order quantity model considering the demand and the cost of ordering as a triangular fuzzy number. They obtained the values of economic order and variable annual cost using defuzzication methods. Liu [34] considered fuzzy demand and cost in his model and used -cut method and nonlinear programming for determining membership function to calculate prots and the value of the economic order quantity in a form of triangular fuzzy number. Shishebori et al. [35] developed EPQ model with fuzzy approach using nonlinear programming method and compared the methods of defuzzication with each other. Chen and Chang [36] proposed the model of economic production quantity with consideration of defective product in the case of trapezoidal fuzzy production rate. The model was solved using exten-sion principle when the production rate was deter-ministic and in the case of fuzzy production rate, it was solved using the method of Lagrange coecient.
Bjork [37], with regard to the production cycle as the triangular fuzzy number, proposed an economic production model. This model was developed using extension principle and centroid method; numerical results showed that the size of fuzzy production cycle increased in comparison with the classic model. Also, Bjork [38] proposed economic order quantity model with consideration of demand and order time as the triangular fuzzy number. Using the extension principle and defuzzication method, he obtained the optimal factors of the model. In the numerical example, he proved that the cumulative amount of economic production increases in comparison with the classic model. Yang [39] analyzed the classic economic produc-tion quantity model with consideraproduc-tion of setup cost, demand rate, and production rate as the trapezoidal fuzzy model. Also, he used the Lagrange method and obtained the optimal factors of the model by applying the algebraic expansion and heuristic optimization. Barak and Fallahnezhad [7] analyzed fuzzy queuing systems and compared M=M=1 model with M=E2=1
model.
In this research, we use queuing theory and fuzzy methods in line balancing so that the optimal assignment of machine to operators will be determined in order to minimize total cost of the system.
Using fuzzy queuing models to calculate the amounts of prot function in the proposed model, which is the contribution of this research, has some advantages over the traditional assembly line balancing models. Simplicity and comprehensibility of queuing theory from one side, and diverse numbers of queuing models from the other side have led to easy application of the proposed model in a vast variety of manufactur-ing situations over diverse rms. In fact, the rst step is to select the proper queuing model which is mostly applicable to the dierent situations of each rm and then the designer continues according to steps of the proposed model. However, most of the existing models are only applicable to a specic situation and could not be extended to dierent situations. Also, uncertainty of manufacturing environments is considered in this model which makes it more eective and exible. 3. The proposed model
In the proposed method, rst of all, the production or assembly line is modeled using fuzzy queuing models. Then, dierent scenarios of assigning operators to workstations are designed. Then, a fuzzy prot is calculated for each scenario using unconstrained fuzzy programing method. Then, fuzzy prots obtained from dierent scenarios are ranked using a fuzzy ranking method. The scenario with the maximum prot is chosen as the best scenario of assigning operators to the workstations.
3.1. Assumptions of the model
1. In this model, it is assumed that the sequence of workstations is in a series system and the produc-tion process starts from the rst staproduc-tion and it continues until the last station;
2. Operators have the same abilities and service rates;
3. The average time required to perform the operation is assumed to be the same for all machines. Since the machines are in series, this assumption can be justied.
3.2. Notation
The following notations are necessary to explain and formulate the problem:
B The total income earned per time unit;
~
R The prot of producing each unit of
product;
m Number of operators;
L The average number of products in the
system (waiting or receiving service) in long term;
TS Time horizon of decision-making;
TC Production cycle time;
~
C1 Cost for the unit of work in process in
system per time unit;
C2 The employment cost of each operator
per time unit;
LSi The average number of products at
station i.
In order to model the assembly line with the principles of queuing theory, rst we must adapt the production system components to the components of a queuing system; In this regard, products of assembly line are considered as customers of queuing systems and operators are assumed as servers in the queuing system. Also, we assume that the arrival of items into the assembly line is according to Poisson distribution with the approximate rate of ~. Also, the time to produce products by service operators in dierent machines is the same and exponentially distributed with approximate rate of ~.
Now, to obtain the optimum number of operators assigned to the production line, we must rst determine that how many machines should be assigned to each operator. We can assign one, two, or more machines to each operator; but each of these assignments will result in dierent costs and revenues for the company. So, for each of these cases, the total prot function which includes income and costs arising from the implementation of that case is calculated and according to the values obtained from dierent scenarios, the best scenario of assigning operators to the assembly line will be determined.
Prot function in this model is calculated accord-ing to Eq. (1):
B = ~R
TS
TC
~ C1 L
(C2 m) : (1)
In this prot function, the values of parameters ~R, TS,
~
C1and C2for all scenarios are identical and equal. But
the values of the variables TC, L, and m will change in
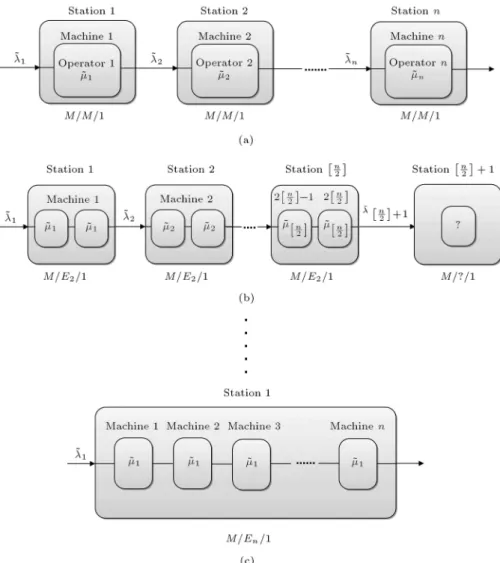
dierent scenarios. In this model, a constant number of machines are assigned to each operator in each scenario. In the rst scenario, one machine is assigned to each operator and in the second scenario, two machines are assigned to each operator and it is obvious that in the last station, we may have assigned one or two machines to an operator with regard to the odd or even number of machines. N dierent scenarios for assignment of machines to the operators exist. Figure 1 shows some of these scenarios and their corresponding symbols. Note that apart from the rst and the last scenarios, the assignment is not fully specied in the scenario and depending on the number of machines in the production line, assignment in the last station changes. For example, as shown in Figure 1(b), the last station is marked with symbol \?". In the second scenario, if the number of machines in the line is a multiple of 2(n = 2k), then the number of stations with 2 machines and consequently, the number of assigned operators, will be equal [n
2]; but if the number of
machines is not a multiple of 2(n 6= 2k), one machine and one operator will be assigned to the last station; thus, we will have an M=M=1 model or M=E1=1 at the
last station. It is obvious that the maximum number of remained machines at the last station in the scenario i is i 1.
In the following, the method to compute prot function for some of these cases has been investigated. For example, for the rst case (Figure 1(a)), the calculations are as follow.
Since the arrival rate of items into assembly line and the service rate of operators at stations are triangular fuzzy numbers, these parameters will be according to the following denition:
~1= (L; M; R); (2)
~1= ~2= ::: = ~n = (L; M; R): (3)
Parameter C1 includes costs such as deterioration cost
or defect cost of products which are waiting between workstations, cost of the space needed to store work in process, and costs of lost opportunity. C1 is dened
as a fuzzy triangular number because of the existing uncertainty in the mentioned costs.
~
Figure 1. Dierent scenarios of allocating operators to the production line: (a) 1st scenario, assignment of stations with 1 machine to each operator; (b) 2nd scenario, assignment of stations with 2 machines to each operator; and (c) nth scenario, assignment of stations with n machines to each operator.
Product prices are not xed and vary in dierent time intervals and according to dierent external parameters (such as supply and demand situations, prices of similar products in market, marketing strategies, etc.). Therefore, in the proposed model, ~R is dened as a fuzzy number:
~
R = (RL; RM; RR) : (5)
However, given that the value of =
for each box
that represents a work station is assumed to be smaller than one, we have:
i=i
i<1) ~1= ~2=:::= ~n= ~=(L; M; R) :(6)
In the rst scenario, the value of L is given by the following formula:
L = Ls1+ Ls2+ ::: + Lsn: (7)
And given that each box is M/M/1 queuing model, Lsi
is calculated as follows: ~Lsi=
~i
~i ~i =
~
~ ~: (8)
As a result, the value of L in this case is: ~L =Xn
i=1
~Lsi =
n:~
~ ~: (9)
With regard to this fact that the result of addition, subtraction, multiplication, and division of triangular fuzzy numbers is a triangular fuzzy number [8,9], the value of L is also a triangular fuzzy number and it is calculated as follows:
~L = n:~
~ ~ = (LL; LM; LR); (10)
LL= min
~Lj~; ~= n:L
LM = n:M
M M; (12)
LR= max
~Lj~; ~=n:R
L R: (13)
Also, in this scenario, m = n; thus, ~TC is obtained by
the following formula: ~
TC = max~t1; ~t2; :::; ~tn
= max
1 ~1;
1 ~2; :::;
1 ~n
=1~=
1 R; 1 M; 1 L : (14) Therefore, prot function (B) is obtained as follows in this scenario:
~ B = ~R
TS
~ TC
~ C1 ~L
(C2 m)
= (BL; BM; BR); (15)
BL= (RL TS L) (C1R LR) (C2 m);
(16)
BM=(RM TS M) (C1M LM) (C2 m);
(17) BR= (RR TS R) (C1L LL) (C2 m):
(18) As a next example, consider the second scenario (Fig-ure 1(b)) where two machines can be assigned to one operator. The calculations are performed as follows.
i = ~~i
i < 1 ) ~1= ~2= ::: = ~[n2]+1= ~
=~L; ~M; ~R
; (19)
~1= ~2= ::: = ~[n
2]+1= ~ = (L; M; R) ; (20)
~L = 8 > > > > > > < > > > > > > : [n 2] P
i=1~Lsi n = 2k
[n 2]
P
i=1~Lsi+ ~Ls[n2]+1 n = 2k + 1
(21) m = 8 > < > : n 2 =n
2 n = 2k
n
2
+ 1 n = 2k + 1
(22)
~ TC =
8 > > < > > :
maxn~t1; ~t2; :::; ~t[n 2]
o
n = 2k maxn~t1; ~t2; :::; ~t[n
2]+1
o
n = 2k + 1
(23)
~ti is calculated as follows:
~ti=
8 > < > : 1 ~ i + 1 ~ i = 2 ~ i = 2 ~
1 i
n 2 1 ~ i = n 2 + 1 (24) So in this case, according to the following formula, the cycle time is equal to 2
i.
~ TC =
8 > > < > > :
maxn2 ~
;2~; :::;2~
o = 2
~
n = 2k
maxn2 ~
;2~; :::;2~;1~
o = 2
~
n = 2k + 1
(25) If the number of machines in this scenario is n = 2k, then we will have (n
2) stations with 2 machines where
all these stations follow M=E2=1 queuing model. In the
queuing model M=Er=1, the expected mean of queue
length (L) is obtained as follows: M=Er=1 ) L =
r + 1
2r 2 ( ) +: (26) As a result, the values of Lsi and ~L are calculated as
follows: ~Lsi=
0 @3 4 ~2 ~ ~ ~ 1
A + ~~; (27)
~L = [
n 2]
X
i=1
Lsi=
3n
8
~2
~ ~ ~ + n:
~ 2~
= (LL; LM; LR); (28)
LL= min
~L ~; ~=
3n
8
2 L
R (R L)
+n:2L
R; (29)
LM =
3n
8
2 M
M (M M)
+n:2M
M ; (30)
LR= max
~Lj~; ~= 3n8 2R
L (L R)
+n:2R
L : (31)
Therefore, where: m =hn2i=n2; ~
~
TC= 2~=
2 R; 2 M; 2 R ; (32) ~ B = ~R
TS
~ TC
~ C1 ~L
(C2 m)
= (BL; BM; BR); (33)
BL=
RL TS2L
(C1R LR) (C2 m);
(34) BM=
RMTS2M
(C1MLM) (C2m);
(35) BR=
RR TS2R
(C1L LL) (C2 m):
(36) The calculations are done similarly for other scenarios up to the last scenario where all machines are assigned to one operator; thus, queuing system M=En=1 is
calculated (see Figure 1(c)). Calculations for the last scenario are as follow:
~1= ~ = (L; M; R); (37)
~1= ~ = (L; M; R); (38)
~L = ~Ls1 =
n + 1
2n
0
@ ~2
~ ~ ~
1 A + ~~
= (LL; LM; LR); (39)
LL=
n + 1
2n 2 L
R (R L)
+L
R; (40)
LM =
n + 1
2n 2 M
M(M M)
+M
M; (41)
LR=
n + 1
2n 2 R
L (L R)
+L
L: (42)
In this scenario, all machines are assigned to one operator; thus, in this scenario, m = 1 and ~TC and
~
B can be obtained as follows: ~
TC= ~t1= ~1 1 +
1
~1 + ::: +
1 ~1 =
n
X
i=1
1 ~1 =
n ~1
=n~= n R; n M; n L ; (43) ~ B = ~R
TS
~ TC
~ C1 ~L
(C2 m)
= (BL; BM; BR); (44)
BL=
RLTSnL
(C1RLR) (C2m); (45)
BM=
RMTSnM
(C1MLM) (C2m);
(46) BR=
RRTSnR
(C1LLL) (C2m): (47)
After calculating the prot function (B) for all the n scenarios, the scenario that has the largest value of prot is chosen as the optimal assignment. But since the values obtained for prot function in dierent scenarios are fuzzy numbers, they should be compared using prioritization techniques; therefore, using fuzzy prioritization techniques is necessary.
4. Ranking fuzzy numbers
Ranking fuzzy numbers can be based on dierent features of fuzzy numbers. This feature may be the centroid, area under the membership function, or the intersection points between sets. A method of ranking fuzzy numbers considers special features and fuzzy numbers will be ranked based on these features. There-fore, it is reasonable to expect the results of dierent ranking methods for ranking fuzzy numbers of the same data to be dierent. Therefore, such complexities make the method of ranking fuzzy numbers to be a relatively dicult process.
Dierent methods have been proposed for prior-itizing fuzzy numbers [40-46]. We have employed Lee and Li [40] method of prioritizing fuzzy numbers in this article. In this method, fuzzy numbers are compared using two criterions: (1) fuzzy number mean, and (2) fuzzy number dispersion. They calculated dispersion using the standard deviation. It is assumed that a fuzzy number with greater mean and less standard deviation has higher priority for the decision maker. Mean and standard deviation of fuzzy number ~M are obtained from Eqs. (48) and (49):
XM~= R
s(M~) x (M~(x))2dx
R
s(M~) (M~(x))2dx
; (48)
M~= 2 4 R
s(M~) x2(M~(x))2dx
R
s(M~) (M~(x))2dx
XM~2 3 5 1 2 : (49) Eqs. (48) and (49) would be converted to Eqs. (50) and (51), if ~M is a triangular fuzzy number as ~M = (l; m:n):
XM~= 1
4(l + 2m + n); (50)
M~=801 (3l2+ 4m2+ 3n2 2nl 4lm 4mn):
Table 1. Ranking of fuzzy numbers. Comparison of
mean values
Comparison of standard deviation values
Prioritization result
XM~i
> XM~j
~ Mi> ~Mj
XM~i
= XM~j
M~i
<M~j
~ Mi> ~Mj After calculating mean and standard deviation of fuzzy numbers ~Miand ~Mj, prioritization is done by the rules
stated in Table 1.
5. Numerical example
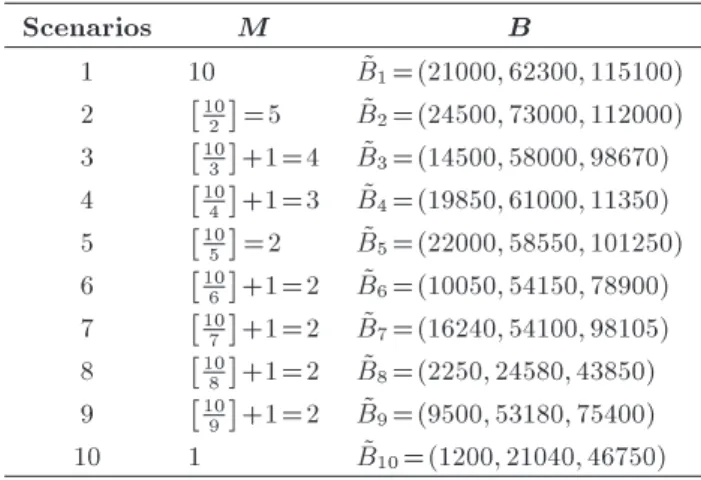
Suppose an assembly line in a factory with 10 machines that are located in series along together. Products according to Poisson distribution with an approximate rate of 500 units per month will be entered into a production line. The time required for operation in each machine in order to produce a single product has exponential distribution with fuzzy parameter (3, 3.25, 3.5). Every month has 25 working days and each day has 8 working hours. If the cost per unit of work in process in system is (950,1050,1100) in the month and the employment cost of each operator is 8000 in the month and the prots generated per unit of product are (200, 220, 250), the objective is to determine optimal allocation of manpower to the production line. Solution. In this case, there are 10 dierent assign-ment scenarios, because 10 machines are available in the production line. Calculations of the prot function have been performed using MATLAB. The outputs of MATLAB calculation for each of the 10 scenarios are shown in Table 2.
C2= 8000;
C1= (950; 1050; 1100);
Table 2. Prot function values for each of the assignment scenarios.
Scenarios M B
1 10 B~1=(21000; 62300; 115100)
2 10
2
=5 B~2=(24500; 73000; 112000)
3 10
3
+1=4 B~3=(14500; 58000; 98670)
4 10
4
+1=3 B~4=(19850; 61000; 11350)
5 10
5
=2 B~5=(22000; 58550; 101250)
6 10
6
+1=2 B~6=(10050; 54150; 78900)
7 10
7
+1=2 B~7=(16240; 54100; 98105)
8 10
8
+1=2 B~8=(2250; 24580; 43850)
9 10
9
+1=2 B~9=(9500; 53180; 75400)
10 1 B~10=(1200; 21040; 46750)
R = (200; 220; 250);
TS = the available time during a month
= 25 8 = 200;
~ = arrival rate to the assembly line in the month = (450; 500; 550);
~ = operator service rate per hour = (3; 3:25; 3:5);
~ = operator service rates in month = (600; 650; 700):
According to the Lee and Li method [40] and by the MATLAB codes, these 10 scenarios are ranked. The MATLAB outputs, resulting in ranking of the dierent assignment scenarios, are as follows:
~
B2> ~B1> ~B4> ~B5> ~B3> ~B7> ~B6> ~B9
> ~B8> ~B10:
According to the above results, the best scenario is to assign ve operators to the production line. In other words, it is optimal to assign two operators to each machine. Also, if we are not able to assign 5 operators to assembly line because of some reasons and constraints, then the rst scenario, the fourth, and the fth, respectively, are the next priorities for the assignment of operators to production line.
It is worth noting that the amounts of parameters C1, C2, R, and are inuential in determining the
best scenario, so that in the example, if that cost of employing labor (C2) increases to a suciently large
value, then the rst scenario will not be denitely selected as the superior scenario.
Therefore, a sensitivity analysis of input param-eters is needed to identify sensitive and insensitive parameters. It is obvious that more attention should be paid to estimate the sensitive parameters.
Sensitivity analysis. Tables 3-7 show the MATLAB output results of the sensitivity analysis for each input parameter of the problem. In these calculations, each parameter is increased 10% in each step, separately, and then, the variations in the nal ranking of assign-ment scenarios are analyzed.
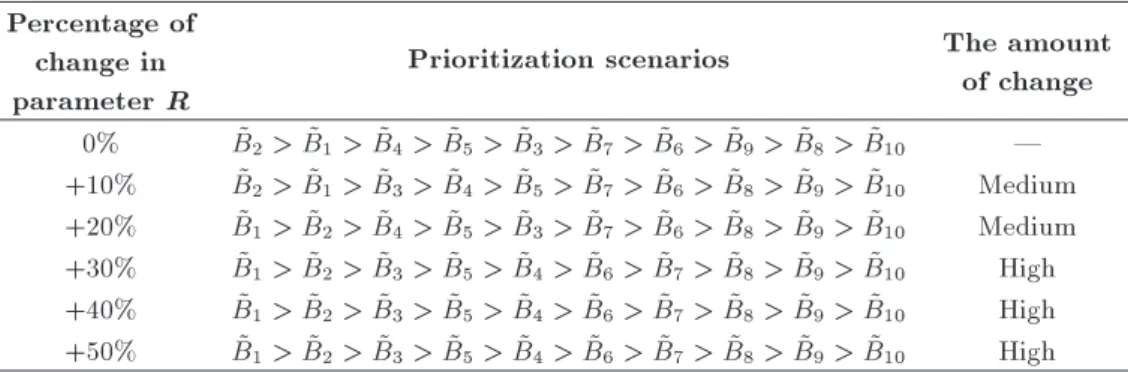
As you can see in Table 3, increasing the amount of parameter R results in signicant changes in the ranking of scenarios. In fact, increasing R leads to those scenarios which assign more operators and they
Table 3. Sensitivity analysis of parameter R. Percentage of
change in parameter R
Prioritization scenarios The amount of change 0% B~2> ~B1> ~B4> ~B5> ~B3> ~B7> ~B6> ~B9> ~B8> ~B10 |
+10% B~2> ~B1> ~B3> ~B4> ~B5> ~B7> ~B6> ~B8> ~B9> ~B10 Medium
+20% B~1> ~B2> ~B4> ~B5> ~B3> ~B7> ~B6> ~B8> ~B9> ~B10 Medium
+30% B~1> ~B2> ~B3> ~B5> ~B4> ~B6> ~B7> ~B8> ~B9> ~B10 High
+40% B~1> ~B2> ~B3> ~B5> ~B4> ~B6> ~B7> ~B8> ~B9> ~B10 High
+50% B~1> ~B2> ~B3> ~B5> ~B4> ~B6> ~B7> ~B8> ~B9> ~B10 High
Table 4. Sensitivity analysis of parameter C1.
Percentage of change in parameter C1
Prioritization scenarios The amount of change 0% B~2> ~B1> ~B4> ~B5> ~B3> ~B7> ~B6> ~B9> ~B8 > ~B10 |
+10% B~2> ~B1> ~B4> ~B5> ~B3> ~B7> ~B6> ~B9> ~B8 > ~B10 |
+20% B~2> ~B1> ~B4> ~B5> ~B3> ~B7> ~B6> ~B9> ~B8 > ~B10 |
+30% B~2> ~B1> ~B4> ~B5> ~B3> ~B7> ~B6> ~B9> ~B8 > ~B10 |
+40% B~1> ~B2> ~B4> ~B5> ~B3> ~B7> ~B6> ~B9> ~B8 > ~B10 Low
+50% B~1> ~B2> ~B4> ~B5> ~B3> ~B7> ~B6> ~B9> ~B8 > ~B10 Low
Table 5. Sensitivity analysis of parameter C2.
Percentage of change in parameter C2
Prioritization scenarios The amount of change 0% B~2> ~B1> ~B4> ~B5> ~B3> ~B7> ~B6> ~B9> ~B8 > ~B10 |
+10% B~2> ~B1> ~B4> ~B5> ~B3> ~B7> ~B6> ~B9> ~B8 > ~B10 |
+20% B~4> ~B2> ~B5> ~B3> ~B7> ~B6> ~B9> ~B8> ~B10> ~B1 Medium
+30% B~4> ~B2> ~B5> ~B3> ~B7> ~B6> ~B9> ~B8> ~B10> ~B1 Medium
+40% B~4> ~B2> ~B5> ~B3> ~B7> ~B6> ~B9> ~B8> ~B10> ~B1 Medium
+50% B~5> ~B4> ~B2> ~B3> ~B7> ~B6> ~B9> ~B8> ~B10> ~B1 High
Table 6. Sensitivity analysis of parameter . Percentage of
change in parameter
Prioritization scenarios The amount of change 0% B~2> ~B1> ~B4> ~B5> ~B3> ~B7> ~B6> ~B9> ~B8> ~B10 |
+10% B~2> ~B1> ~B4> ~B5> ~B3> ~B7> ~B6> ~B9> ~B8> ~B10 |
+20% B~2> ~B1> ~B4> ~B5> ~B3> ~B7> ~B6> ~B9> ~B8> ~B10 |
+30% B~2> ~B1> ~B4> ~B5> ~B3> ~B7> ~B6> ~B9> ~B8> ~B10 |
+40% B~2> ~B1> ~B3> ~B4> ~B5> ~B7> ~B6> ~B8> ~B9> ~B10 Low
+50% B~2> ~B1> ~B3> ~B5> ~B4> ~B6> ~B7> ~B8> ~B9> ~B10 Low would have a higher priority in the nal ranking. This
is because increasing the number of operators leads to decrease in the cycle time, thus increasing the nal prot.
Analyzing the results in Table 4 indicates that by
increasing C1, the nal ranking of the scenarios does
not change substantially. So, this parameter could be assumed as an insensitive parameter of the model.
Sensitivity analysis of parameter C2 in Table 5
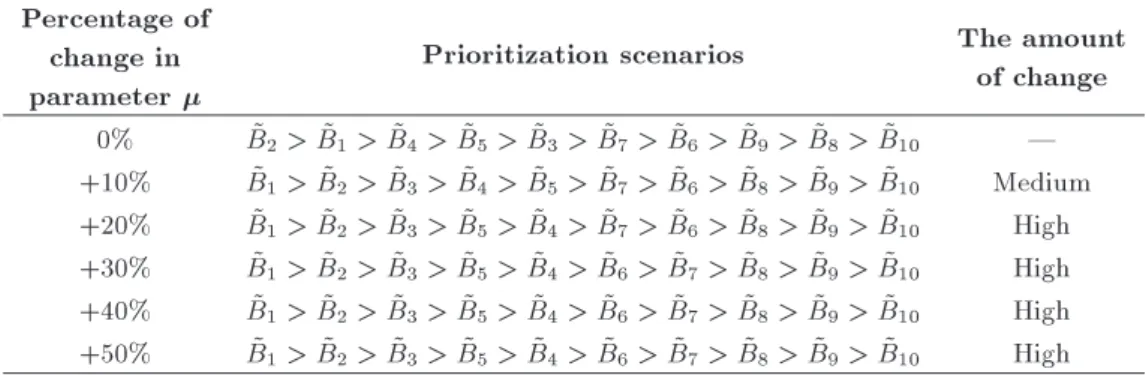
Table 7. Sensitivity analysis of parameter . Percentage of
change in parameter
Prioritization scenarios The amount of change 0% B~2> ~B1> ~B4> ~B5> ~B3> ~B7 > ~B6> ~B9> ~B8> ~B10 |
+10% B~1> ~B2> ~B3> ~B4> ~B5> ~B7 > ~B6> ~B8> ~B9> ~B10 Medium
+20% B~1> ~B2> ~B3> ~B5> ~B4> ~B7 > ~B6> ~B8> ~B9> ~B10 High
+30% B~1> ~B2> ~B3> ~B5> ~B4> ~B6 > ~B7> ~B8> ~B9> ~B10 High
+40% B~1> ~B2> ~B3> ~B5> ~B4> ~B6 > ~B7> ~B8> ~B9> ~B10 High
+50% B~1> ~B2> ~B3> ~B5> ~B4> ~B6 > ~B7> ~B8> ~B9> ~B10 High assumed as sensitive as R, accurate estimation of
this parameter is important (in comparison with C1),
because it has caused drastic changes in the nal ranking in some cases. Also, increasing this parameter resulted in higher priority for those scenarios with less assigned number of operators in the nal ranking.
Tables 6 indicates the results of sensitivity anal-ysis for the parameter . This parameter aects the amounts of L (Eq. (8)). Also, L aects the nal prot considering Eq. (1). Therefore, aects the nal prot of the rm, indirectly. But according to Table 6, this parameter is an insensitive parameter of the model.
Results of the sensitivity analysis for parameter in Table 7 indicate that this parameter is also a sensitive parameter of the model and has a signicant eect on the nal ranking of the scenarios. In addition to its eect on the variable L, it also aects the cycle time (TC) and thus, this parameter is a high sensitive
one.
6. Conclusion and suggestions for future research
In this study, a model for determination of the opti-mal assignment of human resources to the assembly line was presented. Initially, in this model, dierent assignment scenarios were considered. Then, each of these scenarios were modeled using queuing theory models. Then, the prot function including costs and revenues resulted from the implementation of each of these scenarios was determined given that some of the problem inputs were fuzzy. The amount of prot function for dierent scenarios is obtained as a fuzzy number thus we have applied fuzzy prioritization techniques to select the best assignment. In this study, the use of triangular fuzzy numbers is a reasonable approach to deal with the uncertainty that can exist in the manufacturing environment. It follows the results of the data analysis by which this method can provide additional information for decision makers. The results of the classical methods are based on crisp data and any changes to this data makes the results invalid, but results of the fuzzy approach are based
on the data in which the uncertainty of production environments has been considered. Therefore, these results remain valid, even if the initial data has changed in the specied interval (fuzzy numbers interval). As a result, the solutions presented in this research can solve the problem of optimal assignment of human resources when we are faced with uncertainty in the parameters. Also, in this research, there are some cases that have not been considered in the model and they are suggested for future research. The rst suggestion in order to close the model to the conditions of real production environments is to consider dierent service rates for operators. It is also suggested to assume a non-Markovian queuing model with general functions (for example G/G/1) for extending the model presented in this paper where the entry of the products to production line or service time of operators follows a general distribution. Of course, there are also some more sophisticated cases of production that do not have full compliance with the conventional queuing models; thus, in these cases, it is recommended that a combination of simulation techniques and these models should be used.
References
1. Scholl, A. and Scholl, A., Balancing and Sequencing of Assembly Lines, Physica-Verlag Heidelberg (1999). 2. Salveson, M.E. \The assembly line balancing
prob-lem", Journal of Industrial Engineering, 6(3), pp. 18-25 (1955).
3. Mastor, A.A. \An experimental investigation and comparative evaluation of production line balancing techniques", Management Science, 16(11), pp. 728-746 (1970).
4. Wee, T. and Magazine, M. \Assembly line balancing as generalized bin packing", Operations Research Letters, 1(2), pp. 56-58 (1982).
5. Gokcen, H. and Erel, E. \A goal programming ap-proach to mixed-model assembly line balancing prob-lem", International Journal of Production Economics, 48(2), pp. 177-185 (1997).
6. Sheridan, T.B. and Ferrell, W.R., Man-Machine Sys-tems; Information, Control, and Decision Models of Human Performance, The MIT Press (1974).
7. Barak, S. and Fallahnezhad, M. \Cost analysis of fuzzy queuing systems", International Journal of Applied Operational Research, 2(2), pp. 25-36 (2012).
8. Zadeh, L.A. \Fuzzy sets as a basis for a theory of possibility", Fuzzy Sets and Systems, 1(1), pp. 3-28 (1978).
9. Buckley, J.J., Fuzzy Probabilities and Fuzzy sets for Web Planning, pp. 9-10, Springer Verlag (2004). 10. Uzsoy, R., Lee, C.-Y. and Martin-Vega, L.A. \A review
of production planning and scheduling models in the semiconductor industry part II: shop-oor control", IIE transactions, 26(5), pp. 44-55 (1994).
11. Uzsoy, R., Lee, C.-Y. and Martin-Vega, L.A. \A review of production planning and scheduling models in the semiconductor industry part I: system characteristics, performance evaluation and production planning", IIE Transactions, 24(4), pp. 47-60 (1992).
12. Suer, G.A. and Bera, I.S. \Optimal operator assign-ment and cell loading when lot-splitting is allowed", Computers & Industrial Engineering, 35(3), pp. 431-434 (1998).
13. Hung, Y.-F. and Chen, I.-H. \Dynamic operator as-signment based on shifting machine loading", Inter-national Journal of Production Research, 38(14), pp. 3403-3420 (2000).
14. Majozi, T. \A combined fuzzy set theory and MILP approach in integration of planning and scheduling of batch plants2014Personnel evaluation and allocation", Computers & Chemical Engineering, 29(9), pp. 2029-2047 (2005).
15. Vembu, S. and Srinivasan, G. \Heuristics for operator allocation and sequencing in product-line-cells with manually operated machines", Computers & Industrial Engineering, 32(2), pp. 265-279 (1997).
16. Bhaskar, K. and Srinivasan, G. \Static and dynamic operator allocation problems in cellular manufacturing systems", International Journal of Production Re-search, 35(12), pp. 3467-3482 (1997).
17. Nakade, K. and Ohno, K. \An optimal worker al-location problem for a U-shaped production line", International Journal of Production Economics, 60, pp. 353-358 (1999).
18. Chauvet, F., Proth, J.-M. and Soumare, A. \The simple and multiple job assignment problems", Inter-national Journal of Production Research, 38(14), pp. 3165-3179 (2000).
19. Yang, T., Fu, H.-P. and Yang, C. \A simulation-based dynamic operator assignment strategy considering ma-chine interference-a case study on integrated circuit chip moulding operations", Production Planning & Control, 13(6), pp. 541-551 (2002).
20. Ertay, T. and Ruan, D. \Data envelopment analysis based decision model for optimal operator allocation
in CMS", European Journal of Operational Research, 164(3), pp. 800-810 (2005).
21. Song, B., Wong, W., Fan, J. and Chan, S. \A recursive operator allocation approach for assembly line-balancing optimization problem with the consider-ation of operator eciency", Computers & Industrial Engineering, 51(4), pp. 585-608 (2006).
22. Yang, T., Chen, M.-C. and Hung, C.-C. \Multiple attribute decision-making methods for the dynamic operator allocation problem", Mathematics and Com-puters in Simulation, 73(5), pp. 285-299 (2007). 23. Kuo, Y. and Yang, T. \Optimization of mixed-skill
multi-line operator allocation problem", Computers & Industrial Engineering, 53(3), pp. 386-393 (2007). 24. Chen, S.-P. \Parametric nonlinear programming for
analyzing fuzzy queues with nite capacity", European Journal of Operational Research, 157(2), pp. 429-438 (2004).
25. Chen, S.-P. \Parametric nonlinear programming ap-proach to fuzzy queues with bulk service", European Journal of Operational Research, 163(2), pp. 434-444 (2005).
26. Chen, S.-P. \A mathematical programming approach to the machine interference problem with fuzzy pa-rameters", Applied Mathematics and Computation, 174(1), pp. 374-387 (2006).
27. Chen, S.-P. \Solving fuzzy queuing decision problems via a parametric mixed integer nonlinear programming method", European Journal of Operational Research, 177, pp. 445-457 (2007).
28. Gani, A.N. and Kumar, V.A. \A bulk arrival queuing model with fuzzy parameters and fuzzy varying batch sizes", Int. J. Algor. Comput. Math., 2, pp. 1-8 (2009). 29. Ke, J.-C., Huang, H.-I. and Lin, C.-H. \Parametric programming approach for batch arrival queues with vacation policies and fuzzy parameters", Applied Math-ematics and Computation, 180(1), pp. 217-232 (2006). 30. Ke, J.-C. and Lin, C.-H. \Fuzzy analysis of queue-ing systems with an unreliable server: A nonlinear programming approach", Applied Mathematics and Computation, 175(1), pp. 330-346 (2006).
31. Kumar, V.A. \A nonlinear programming approach for a fuzzy queue with an unreliable server", Bulletin of Society for Mathematical Services & Standards (B SO MA SS), 1(2), pp. 69-89 (2012).
32. Lin, C.-H., Huang, H.-I. and Ke, J.-C. \On a batch arrival queue with setup and uncertain parameter patterns", International Journal of Applied Science and Engineering, 6(2), pp. 163-180 (2008).
33. Yao, J.-S. and Chiang, J. \Inventory without back-order with fuzzy total cost and fuzzy storing cost defuzzied by centroid and signed distance", European Journal of Operational Research, 148(2), pp. 401-409 (2003).
34. Liu, S.-T. \Fuzzy prot measures for a fuzzy eco-nomic order quantity model", Applied Mathematical Modelling, 32(10), pp. 2076-2086 (2008).
35. Shishebori, D., Rasti-Barzaki, M. and Hejazi, S.R. \The compassion of two approaches for determining the economic production quantity under fuzzy con-ditions", 5th International Management Conference (2007).
36. Chen, S.H. and Chang, S.M. \Optimization of fuzzy production inventory model with unrepairable defec-tive products", International Journal of Production Economics, 113(2), pp. 887-894 (2008).
37. Bjork, K.-M. \The economic production quantity problem with a nite production rate and fuzzy cycle time", Proceedings of the 41st Annual Hawaii Interna-tional Conference on System Sciences, IEEE (2008). 38. Bjork, K.-M. \An analytical solution to a fuzzy
eco-nomic order quantity problem", International Journal of Approximate Reasoning, 50(3), pp. 485-493 (2009). 39. Yang, G.K. \Discussion of arithmetic defuzzications for fuzzy production inventory models", African Jour-nal of Business Management, 5(6), pp. 2336-2344 (2011).
40. Lee, E.S. and Li, R.J. \Comparison of fuzzy numbers based on the probability measure of fuzzy events", Computers & Mathematics with Applications, 15(10), pp. 887-896 (1988).
41. Yu, V.F., Chi, H.T.X. and Shen, C.-W. \Ranking fuzzy numbers based on epsilon-deviation degree", Applied Soft Computing (2013).
42. Chu, T.-C. and Tsao, C.-T. \Ranking fuzzy numbers with an area between the centroid point and original point", Computers & Mathematics with Applications, 43(1), pp. 111-117 (2002).
43. Yu, V.F. and Dat, L.Q. \An improved ranking method for fuzzy numbers with integral values", Applied Soft Computing, 14, Part C, No. 0, pp. 603-608 (2014),
44. Detyniecki, M. and Yager, R.R. \Ranking fuzzy num-bers using -weighted valuations", International Jour-nal of Uncertainty, Fuzziness and Knowledge-Based Systems, 8(05), pp. 573-591 (2000).
45. Cheng, C.-H. \A new approach for ranking fuzzy numbers by distance method", Fuzzy Sets and Systems, 95(3), pp. 307-317 (1998).
46. Abbasi Shureshjani, R. and Darehmiraki, M. \A new parametric method for ranking fuzzy numbers", Inda-gationes Mathematicae, 24(3), pp. 518-529 (2013).
Biographies
Saeed Khalili obtained his BSc degree in Industrial Engineering from Mashad Payamnoor University. He is currently an MSc student in Industrial Engineering Department at Yazd University. His research interests include queuing theory, fuzzy logic, and facility loca-tion.
Hadi Mohammadzade is currently an MSc student in Industrial Engineering Department at Yazd Univer-sity. He obtained his BSc degree from Tabriz Payam-noor University. His research interests are focused on supply chain management, production planning, and project management.
Mohammad Saber Fallahnezhad graduated from Sharif University of Technology, Tehran, Iran, and is currently an academic sta member of the Faculty of Industrial Engineering at Yazd University, Iran. His research area is focused on quality control. He is also interested in stochastic modeling, dynamic programming, and sequential analysis.