Sharif University of Technology
Scientia IranicaTransactions A: Civil Engineering www.scientiairanica.com
Probabilistic seismic hazard analysis using reliability
methods
M. Kia and M. Banazadeh
Department of Civil and Environmental Engineering, Amirkabir University of Technology, Tehran, P.O. Box 15875-4413, Iran. Received 2 July 2015; received in revised form 12 January 2016; accepted 26 April 2016
KEYWORDS Probabilistic seismic hazard analysis; Reliability methods; Probabilistic model; Epistemic and aleatory uncertainties; Limit-state function.
Abstract. By considering uncertainties in the input parameters (e.g., magnitude, location, wave path, etc.), the Probabilistic Seismic Hazard Analysis (PSHA) aims to compute annual rate of various exceeding ground motions at a site or a map of sites of all anticipated given earthquakes. Uncertainties may be originated due to inherent randomness of the phenomena or variability in the mean values of dierent models parameters, mainly due to use of nite-sample size of observations. The rst, in literature reviews, is commonly named aleatory uncertainty; the second is known as epistemic uncertainty. The total probability numerical integration, generally employed to calculate PSHA, only considers aleatory uncertainties, and variability in the models' parameters is neglected to simplify calculation. In this paper, as an alternative to the total probability numerical integration, matured and standard reliability methods tailored to eortlessly consider both types of uncertainties are put forward to compute site-specic PSHA. Then, as an application study, the peak ground acceleration hazard curve for the site, at which a historical bridge is located, is developed and compared with those obtained from the total probability numerical integration.
© 2017 Sharif University of Technology. All rights reserved.
1. Introduction
The Probabilistic Seismic Hazard Analysis (PSHA) is an approach broadly applied to describe probable future ground shakings at a site. In this approach, annual rate of exceeding for a given ground motion hazard parameter (im) at a specic site is estimated by quantifying uncertainties in the characteristics of seismic source such as magnitude, distance, and wave pathway. The mathematical description of the PSHA was rst set up by Cornell [1]. The formulation was based on total probability theorem. Eq. (1) demonstrates general form of the formulation:
*. Corresponding author. Tel./Fax: +98 21 64543049 E-mail addresses: [email protected] (M. Kia); [email protected] (M. Banazadeh)
(im) =Xn i=1
viP (IM > im) =Xn
i=1 vi
x
P (IM > imjM = m;
R = r)fM(m) fR(r)dm:dr; (1) where vi is the mean annual rate of occurrence of all earthquakes which are greater than or equal to the minimum magnitude, IM denotes a ground mo-tion hazard parameter. Since, in this study, there is more emphasis on the methodology rather than the hazard parameter, the well-known Peak Ground Acceleration (P GA) is chosen as the ground motion measure. n describes number of seismic sources and P (IM > imjM = m; R = r) is the conditional
mentioned uncertainties in the conventional framework makes calculation extremely dicult. Since impacts of epistemic uncertainties on performance evaluation and design have recently received serious attention [2], employing a framework, which is capable of considering both types of uncertainties, would be interesting.
Recently, reliability framework has been widely applied in literature to explicitly address aleatory and epistemic uncertainties in engineering reliability analysis and reliability-based design [3-6]. Haukaas [7] proposed the \unied reliability analysis" as an alternative to the seismic risk analysis based on conditional probabilities. In this approach, First Order Reliability Method (FORM) is implemented to carry out design optimization for a system with limit-state function developed in terms of monetary loss. Du [8] quantied the eects of the aleatory and epistemic uncertainties with belief and plausibility measures in the context of the evidence theory. He implemented the rst order reliability method for probabilistic analysis and nonlinear optimization for interval analysis to handle black-box functions. As an application of the methodology proposed by Haukaas [7], Bohl [9] developed loss curve for an example building and compared the result with the one obtained from Pacic Earthquake Engineering Research (PEER) center approach. Der Kiureghian and Ditlevsen [10] focused on the inuence of the two types of uncertainties on reliability assessment, codied design, performance-based engineering, and risk-based decision-making. Two examples were studied to demonstrate the inuence of statistical dependence arising from epistemic uncertainties on systems and time-variant reliability problems. Koduru and Haukaas [11] studied the viability of the FORM in the context of both static and dynamic nite-element problems. It was concluded that FORM is not an appropriate reliability method for time-variant reliability problems. Xiao et al. [12] proposed an optimization model for sensitivity analysis under both aleatory and epistemic uncertainties. The parameters with sucient information were
address both aleatory and epistemic uncertainties. Magnitude model with random parameters is dened as an example to address the ability of the framework to reect both types of uncertainties within calculation of PSHA. This ability would be more notable when attenuation relations with random model parameters are implemented in calculating PSHA. Furthermore, availability of reliability software, such as \RT", ef-fortlessly capable of carrying-out reliability analysis, makes the reliability-based PSHA more interesting and appealing. This paper starts with describing reliability analysis and limit-state function in detail. Next, magnitude and location models are developed to be applied to conventional and reliability-based framework to develop seismic hazard curve. The results are presented and compared at the end to provide insight into the accuracy and eciency of the suggested reliability methods.
2. Reliability analysis
In classical structural reliability analysis, the system reliability R and probability of failure pf are dened as [4-6]:
R = P [G(X) 0] = Z
g(X)0::: Z
fX(X)dX; (2) pf = P [G(X) < 0] =
Z
g(X)<0::: Z
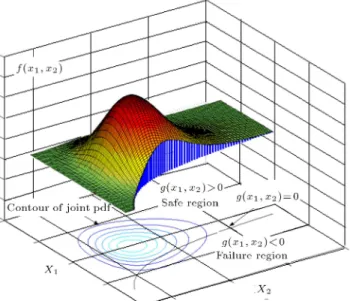
fX(X)dX; (3) where P [:] denotes a probability indicator, G(:) is a limit-state function which denes the performance event for which the probability is being assessed, and X = (X1; X2; :::; Xn) is the vector of random variables. fX(X) denotes the joint probability density function (pdf) of X. Reliability is graphically interpreted as the volume underneath the surface (hyper-surface for higher than 2-D problems) of fX(X) on the side of safe region [6] (Figure 1). The direct evaluation of the probability integration is extremely dicult. The main reasons given in dierent reliability texts are [3-5]:
Figure 1. Graphical interpretation of the probability integration [6].
fX(X) is practically impossible to obtain; evalu-ating the multiple integral is dicult even if this information is available.
In many engineering applications, integration boundary (i.e., G(X) = 0) is not dened explicitly. Even if this function is available, it is usually a nonlinear and complicated function of X.
According to the above reasons, numerical solu-tions are the only choice available. Several reliability methods are introduced to estimate the probability integration numerically. Gradient-based methods, i.e. FORM and Second-Order Reliability Method (SORM) along with more sophisticated Monte Carlo Simulation (MCS), are such techniques broadly applied to solve the probability integration in Eq. (3). MCS generates random outcomes of the random Variables and eval-uates G(X) for each realization. Then, it counts the number of times a failure occurred and estimates the probability of failure by [3,5,9]:
pf = Total number of samplingNumber of failure : (4) This method is extremely robust. It can solve probabil-ity integration in Eq. (3) with any type of limit-state functions, even those with discontinuities. However, the main disadvantage of MCS is that it requires a large number of evaluations of the limit-state function to obtain the failure probability. Hence, the MCS is time-consuming, especially for random event with small probability of failure. This deciency reduces the use of MCS in structural reliability analysis. In contrast, gradient-based methods are highly ecient due to their search for only the point with the highest contribution to the probability integration; no time is
Figure 2. Comparison of the rst order and second reliability methods [6].
wasted in calculations and they do not signicantly contribute to the probability of failure. This charac-teristic of the gradient-based methods making them tailored to compute probability of rare event would be greatly interesting for practical purposes. Since the approximation of the limit-state function in SORM is better than that in FORM (Figure 2), SORM is generally more accurate than FORM, especially for highly nonlinear limit-state function. However, SORM is not as ecient as FORM due to computing the second-order derivatives. Therefore, a great number of solutions are proposed to improve eciency of the SORM using various quadratic approximations, one of which is the Breitung's improved formula using the theory of asymptotic approximations [14]. This simple closed-form solution, applied to the present study as the second-order analysis, modies failure probability of the FORM using the rst principle curvature. Generally, gradient-based methods take the three following steps to estimate probability of failure [3,6,12].
1. The vector of random variables, X = (X1; X2; :::; Xn), in their original random space is trans-ferred into independent standard normal vector, U = (U1; U2; :::; Un), in standard normal space (U-space). After transformation, limit-state function G(X) is changed to ~G(U) in U-space. Note that mathematical formulation of limit-state function after transformation is dierent from that in the original space.
2. Next, a point located on ~G(U) = 0 and has the highest contribution to the probability integration must be sought. In reliability text, this point is named Maximum Probable Point (MPP), or design point, and computed by an iterative optimization process as:
Figure 3. Probability integration in the U-space [6].
(
Max ~f(U) = n
i=1p12 Exp
u2 i
2 Subjected to ~GL(U) = 0
(5) where ~f(U) demonstrates the mathematical de-scription of the integrand in U-space. Since n
i=1p12Exp
u2 i
2
= p1
2Exp
Pn i=1u2i
2
, max-imizing n
i=1p12Exp
u2 i
2
is equivalent to min-imizing Pni=1u2
i. Accordingly, MPP is the point on the integral boundary, i.e. ~G(U) = 0, which has the shortest distance to the origin in U-space (Figure 3). In technical texts, this minimum distance is called reliability index and is shown by .
3. Finally, based on the obtained reliability index, the probability of failure is estimated by the following equations:
pf = 8 > > > < > > > :
( ) ! If FORM selected
( )n 1
i=1(1 + i)12 ! If SORM
(Breitung's improved formulation)
selected (6)
where i denotes the principal curvatures of the limit-state function, i.e. ~G(U), at the minimum distance point.
3. Limit-state function
According to the previous section, limit-state function dening desired event is the core of the reliability methods. A limit-state function consists of two main parts: threshold and probabilistic models. Threshold
employed to solve a reliability problem.
Depending on the objective performance, the number of probabilistic models required to dene desired limit-state function would be dierent. For example, in a seismic risk analysis which computes exceedance probability of monetary loss, three intensi-ties, demand, and consequence models are required to develop limit-state function. But, for seismic hazard analysis which is the subject of this paper, only proba-bilistic intensity model would be adequate. Therefore, following limit-state function is extended in this paper to address the problem of calculating Eq. (1):
G() = pga P GA(; M; R); (7)
where pga indicates peak ground acceleration thresh-old, pga(; M; R) represents an intensity model pre-dicting peak ground acceleration at a designated site. In this model, , M, and R indicate model param-eters, earthquake magnitude, and wave propagation eects, respectively. Fortunately, most of attenuation relations proposed in the literature comply with the mentioned characteristics of a probabilistic model and can be directly amenable to a reliability analysis. One example is the following ground-shaking intensity model predicting peak ground acceleration at a site [15] and implemented in this paper to describe reliability-based PSHA. It is noteworthy that analyst would be autonomous in the use of his developed or other probabilistic intensity model:
Log(P GA) =aMw b p
(R2+ H2)
d:LogpR2+H2+cisi+:": (8) In the above equation, a; b; ci; and siare the parameters of the intensity model; Mw; R; and H represent earth-quake magnitude, focal depth, and epicentral distance, respectively; " is the standard normal random variable representing the model error; and is the standard deviation of the model error. Furthermore, the model yields a unique deterministic value of P GA for a given
realization of input variables and is continuously dier-entiable. Hence, Eq. (8) can be directly implemented in reliability analysis. It is worthwhile to mention that the above model is not capable of addressing epistemic uncertainty due to use of constant parameters. In other words, variability in the model parameters, i.e. a; b; ci; and si, is ignored when the model is developed. By utilizing the above relationship, the limit-state function G() is rewritten to address the problem of calculating the probability that P GA at a site exceeds a specic threshold value:
G() = pga 10
h
aMw bp(R2+H2) d:Logp(R2+H2)+cisi+:"
i : (9) 4. Case study example
In this section, both traditional and reliability-based methodologies are implemented to develop peak ground acceleration hazard curve at a site of a historical bridge. This bridge, dating back to about 250 years, is located at 52:665 east and 36:525 north. Seismicity catalog of the site was rst developed based on all historical and systematic earthquakes occurred at a distance up to 150 km from the site. For the sake of simplicity, three circular area sources with dierent radii were dened. Only major excitations were considered, and near-source eects are limited by dening lower bound radius being equal to 10 km (Figure 4). Next, both magnitude and location probability functions are developed for each seismic zone. These probability density functions are then utilized in the intensity model proposed in the previous section to formulate limit-state function, Eq. (9), for each seismic zone. Af-ter extending limit-state function, reliability methods are employed to calculate the probability that peak ground acceleration exceeds certain ground motion levels.
Figure 4. Concentric circular seismic sources.
4.1. Magnitude model
The relative frequency of various-sized earthquakes has been usually specied by a truncated exponential distribution function developed based on Gutenberg and Richter's recurrence law:
Ln(N(m)) = a b:m ! N(m) = ea:e b:m; (10) where N(m) indicates the number of earthquake with magnitude equal to or greater than \m"; \a" and \b" are the recurrence model parameters. Accord-ing to Eq. (10), cumulative distribution function of earthquake magnitude and consequently its probability distribution function can be computed as:
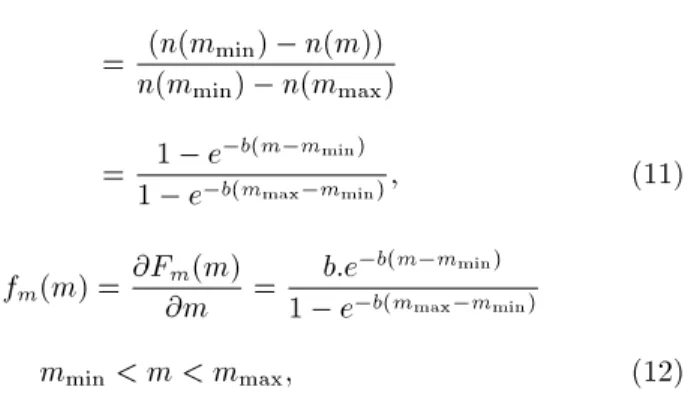
Fm(m) = P (M mjmmin< M < mmax) =n(m(n(mmin) n(m))
min) n(mmax) =1 e1 eb(mb(m mmin)
max mmin); (11)
fm(m) =@F@mm(m) = b:e
b(m mmin)
1 e b(mmax mmin)
mmin< m < mmax; (12)
where mminindicates lower bound value of earthquake magnitude selected based on engineering judgment and seismicity catalog of the site; mmax is the upper bound value of magnitude used to demonstrate that maximum magnitude may be generated by seismic source. Magnitude model parameters, i.e. mmax; b; and mmin, for each of the above three seismic zones are presented in Table 1. Except for the latter, the other parameters are computed by a sophisticated procedure which considers uncertainty in the input magnitude data [16,17].
4.2. Location model
To predict ground motion intensity at a site location, it is also necessary to describe probability distribution of site to source distance as a more common parameter applied to reect wave propagation eects. Since rupture can be extended over ten kilometers, various distance measures have been developed to estimate ground motion parameters at a site (Figure 5). In Eq. (9), the epicentral distance R associated with focal depth H is used to reect wave propagation eects. Probabilistic description of epicentral distance can be easily computed by assuming that earthquakes occur with equal probability anywhere at a seismic zone. Considering the above assumption, the probability of locating an epicenter at a distance of less than \r" and greater than rmin can be calculated by:
Figure 5. Graphical interpretation of the epicentral distance.
FR(r) = P (rmin< R < r) =
8 > < > :
0 r < rmin
:r2 r2 min
r2
max r2min rmin r rmax
1 r rmax
(13) According to Eq. (13), the probabilistic description of epicentral distance can be computed by:
fR(r) =@F@rR(r) = (
2r r2
max rmin2 rmin r rmax
0 Otherwise (14)
Based on the above equation, epicentral probability function of the seismic zones is developed as follows:
f1(r) =1750r 10 r < 60; f2(r) =5400r 60 r < 120;
f3(r) =4050r 120 r < 150: (15)
It is strongly emphasized that the above description is not only limited to circular area source, but also can be extended to line source or area source with a more general shape.
According to Eq. (9), to complete location model, focal depth also requires to be specied. Statistical analysis of focal depth values presented in published global earthquake catalogues shows that lognormal distribution is a suitable distribution function to de-ne focal depth variability. However, focal depths published in seismic catalogues are inaccurate by up to 60 km for events in Iran and the surrounding re-gions [18]. Therefore, it is recommended that only focal depth values determined using accurate methods, such as local network recordings or teleseismic wave form inversion, be used instead of seismic catalogues values in a PSHA [18]. Therefore, based on a study conducted by Magge et al. [19], focal depth value, in this paper, is considered constant and set equal to 12 km.
4.3. Comparison of analysis options
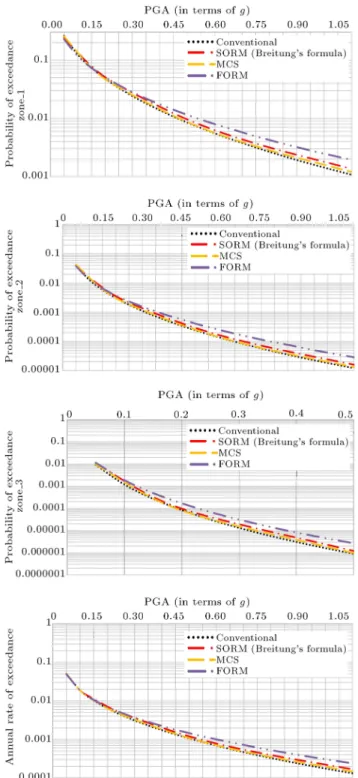
In this section, seismic hazard curve is derived us-ing dierent reliability methods, and the results are
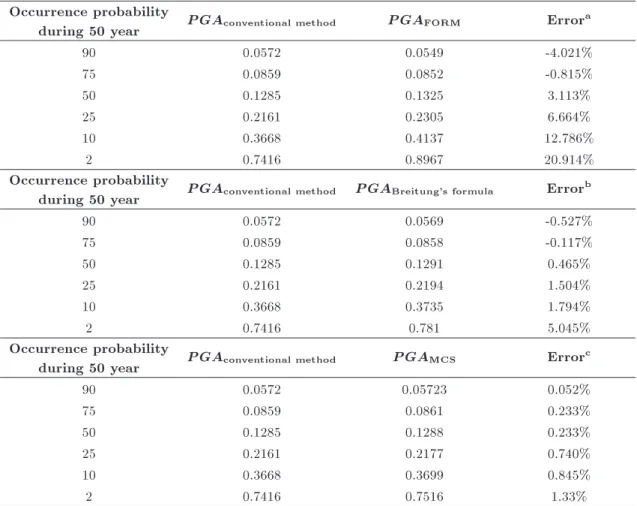
then compared with those obtained from conventional method. The objective followed in this comparison is to nd the appropriate reliability model for computing PSHA with respect to eciency and accuracy criteria. To this end, for a given threshold, the exceedance probability is rst calculated for each zone using dif-ferent reliability methods. Next, the probability of ex-ceedance is converted to the annual rate of exex-ceedance by a simple modication. To this end, it is enough to multiply the probability by annual rate of occurrence of earthquake at the site. Finally, hazard curve is developed using direct summation of the annual rate of exceedance over all seismic zones. The reliability of the obtained results is investigated by its comparison with the results of conventional approach. To demonstrate dierences between methods, vertical axes in Figure 6 are plotted in logarithmic space. According to Figure 6, FORM, especially at the tail of the curves, tends to overestimate the probability of failure compared with conventional and other reliability methods. This is quite reasonable and mainly due to the linearization of the limit-state function in the FORM. To examine the accuracy of the results better, P GA is computed and compared with those obtained from conventional method in terms of percentage errors by applying Poisson occurrence model and reliability-based hazard curves, according to dierent occurrence probabilities in 50 years (Table 2). According to the results of Table 2, it is concluded that MCS is the most accurate method. Figure 6 graphically conrms this conclusion. However, it is too time-consuming to be used for practical purposes. To appreciate this fact, the number of simulations and CPU time required to compute the probability of exceeding a specic threshold value is shown in Table 3 for dierent reliability methods. According to the results of Table 3, the computa-tional cost of MCS increases dramatically when the probability of rare event is sought. For example, to achieve 2% coecient of variation of the probability results, MCS requires 750616 realizations for threshold equal to \0.75g" at the rst seismic zone. The CPU time corresponding to these numbers of simulations is 5665 seconds, namely 1.57 hours. In return, the run time required to compute the probability of exceeding \1.1g" is equal to 32849.02 seconds which is more than 6 times of the run time required for the threshold equals \0.75g". It is noteworthy that the aforementioned computational cost is relevant to only one threshold value. By considering computational eorts of dierent threshold values at all seismic zones, it is concluded that MCS is too time-consuming to be applied for practical purposes. In contrast, to compute the prob-ability of exceeding \0.75g", gradient-based methods, i.e. FORM and SORM (Breitung's improved formula), only 11 realizations are required which are equivalent to 0.102 and 0.149 seconds CPU time for FORM and
Figure 6. Comparison of the results obtained from dierent methods.
SORM, respectively. This brief comparison demon-strates how much faster the gradient-based methods are than MCS, which would be greatly interesting for practical purposes. However, according to Table 2, SORM provides more accurate results than FORM, especially at low probabilities. This is quite reasonable and mainly due to considering limit-state curvature when exceedance probability is sought. Therefore, the second-order reliability analysis based on Breitung's
75 0.0859 0.0858 -0.117%
50 0.1285 0.1291 0.465%
25 0.2161 0.2194 1.504%
10 0.3668 0.3735 1.794%
2 0.7416 0.781 5.045%
Occurrence probability
during 50 year P GAconventional method P GAMCS Error
c
90 0.0572 0.05723 0.052%
75 0.0859 0.0861 0.233%
50 0.1285 0.1288 0.233%
25 0.2161 0.2177 0.740%
10 0.3668 0.3699 0.845%
2 0.7416 0.7516 1.33%
aError = P GAF ORM P GAconventional method
P GAconventional method 100;
bError = P GABreitung's formula P GAconventional method
P GAconventional method 100;
cError = P GAMCS P GAconventional method
P GAconventional method 100.
Table 3. A comparison of computational eorts of the dierent reliability methods for computing probability of exceeding.
Threshold MCS FORM/SORM
Number of evaluations
CPU time (Second)
Number of evaluations
CPU time (Second)
Zone 1
0.25 71363 62.918 5 0.077 / 0.1
0.5 286548 783.961 8 0.086 / 0.116
0.75 750616 5664.16 11 0.096 / 0.112
1.1 2080833 32849.02 14 0.119 / 0.16
improved formula would be the authors' suggested reliability method for computing PSHA.
5. Conclusion
In this paper, an alternative approach based on the application of Reliability Methods is put forward to cal-culate Probabilistic Seismic Hazard Analysis (PSHA). The pioneering work (i.e., Eq. (1)) in PSHA is consid-ered as a reference to exhibit eciency and accuracy of the reliability methods. In both approaches, the results
are peak ground acceleration hazard curves for the site at which a historical bridge in Iran is located. It is concluded that the subsequent use of the SORM (Bre-itung's improved formula) provides accurate results with respect to conventional method with a fraction of the computational eorts involved in MCS. That is, SORM can be adopted as an alternative approach to calculate PSHA because of good balance between accu-racy and eciency. The ability to explicitly account for epistemic uncertainties associated with the capability of eortlessly addressing correlation between random
variables is another advantage, making the reliability-based approach powerful for practical purposes com-pared to conventional method. These advantages are particularly signicant when attenuation relations with random model parameters are implemented in calculating PSHA.
References
1. Cornell, C.A. \Engineering seismic risk analysis", Bul-letin of the Seismological Society of America, 58(5), pp. 1583-1606 (1968).
2. Wen, Y. \Probabilistic aspects of earthquake engi-neering", Earthquake Engineering from Engineering Seismology to Performance-Based Engineering, Ed. by Bozorgnia, Y. and V.V. Bertero, CRS Press LLC (2004).
3. Ditlevsen, O. and Madsen, H.O., Structural Reliability Methods, Wiley New York (1996).
4. Melchers, R.E., Structural Reliability Analysis and Prediction, John Wiley & Sin Ltd (1999).
5. Haldar, A. and Mahadevan, S., Probability, Reliability, and Statistical Methods in Engineering Design, John Wiley & Sons (2000).
6. Du, X. \ME/AE probabilistic engineering design", Class notes, Engineering Uncertainty Repository, http://web.mst.edu/ due/repository, 2016, unpub-lished.
7. Haukaas, T. \Unied reliability and design optimiza-tion for earthquake engineering", Probabilistic Engi-neering Mechanics, 23(4), pp. 471-481 (2008). 8. Du, X. \Unied uncertainty analysis by the rst order
reliability method", Journal of Mechanical Design, 130(9), pp. 091401-10 (2008).
9. Bohl, A. \Comparison of performance based engi-neering approaches", A Thesis Submitted in Partial Fulllment of the Requirements for the Degree of Master of Applied Science, the University of British Columbia (2009).
10. Kiureghian, A.D. and Ditlevsen, O. \Aleatory or epistemic? Does it matter?", Structural Safety, 31(2), pp. 105-112 (2009).
11. Koduru, S. and Haukaas, T. \Probabilistic seismic loss assessment of a Vancouver high-rise building", Journal of Structural Engineering, 136(3), pp. 235-245 (2009). 12. Xiao, N.-C., Huang, H.-Z., Wang, Z. Pang, Y. and He, L. \Reliability sensitivity analysis for structural systems in interval probability form", Structural and Multidisciplinary Optimization, 44(5), pp. 691-705 (2011).
13. Mahsuli, M. and Haukaas, T. \Seismic risk analysis with reliability methods. Part II: Analysis", Structural Safety, 42, pp. 63-74 (2013).
14. Breitung, K. \Asymptotic approximations for multi-normal integrals", Journal of Engineering Mechanics, 110(3), pp. 357-366 (1984).
15. Zare, M., Ghafory-Ashtiany, M. and Bard, P.Y. \At-tenuation law for the strong motions in Iran", In Proceedings of the Third International Conference on Seismology and Earthquake Engineering, 1, pp. 345-354 (1999).
16. Kijko, A. and Sellevoll, M.A. \Estimation of earth-quake hazard parameters from incomplete data les. Part II. Incorporation of magnitude heterogeneity", Bulletin of the Seismological Society of America, 82(1), pp. 120-134 (1992).
17. Kijko, A. \Estimation of the maximum earthquake magnitude, m max", Pure and Applied Geophysics, 161(8), pp. 1655-1681 (2004).
18. Maggi, A., Priestley, K. and Jackson, J. \Focal depths of moderate and large size earthquakes in Iran", Journal of Seismology and Earthquake Engineering, 4(2-3), pp. 1-10 (2002).
19. Maggi, A., Jackson, J., Priestley, K. and Baker, C. \A re-assessment of focal depth distributions in southern Iran, the Tien Shan and northern India: Do earthquakes really occur in the continental mantle?", Geophysical Journal International, 143(3), pp. 629-661 (2000).
Biographies
Mehdi Kia started his university studies in Babol Noshirvani University of Technology, Babol, Iran, in the eld of Civil Engineering, in September 2004. Having nished his undergraduate study in 2008, he continued his studies as a graduate student in Sharif University of Technology in Structural Engineering. He successfully defended his thesis titled \Modeling Local Joint Flexibility using a new element added to the library of OpenSees software" to obtain his MS degree in December 2010. He was accepted as a PhD student in the University of Amir-Kabir, Iran, in 2012, where he worked on reliability analysis and its application on seismic risk evaluations. He is currently a Structural Engineer at Pars Gas Oil Company (P.O.G.C).
Mehdi Banazadeh obtained his BS (Civil Engineer-ing) and MS (Earthquake EngineerEngineer-ing) degrees from the University of Tehran with honor. He then pursued his PhD degree in the University of the Ryukyus in Japan and accomplished it in 2004. He has many years of experience in the next generation performance-based engineering and reliability analysis. He has been a faculty member in Amir-Kabir University of Technology in Tehran, Iran. He has authored and coauthored over 30 technical papers. His research area is mainly focused on seismic risk evaluation using re-liability framework and nonlinear structural modeling and analysis.
![Figure 3. Probability integration in the U-space [6].](https://thumb-us.123doks.com/thumbv2/123dok_us/8377456.2225324/4.892.70.413.144.490/figure-probability-integration-in-the-u-space.webp)